Introduction
Children learn novel words in the context of the words they know. Lexical representations are stored in long-term memory and may influence children's word learning. In particular, the existing lexical representations of known words help children to build a rudimentary lexical representation of a novel word with only a brief exposure to the word, and to strengthen the relationship with the newly made lexical representation. Lexical representations are organized into word neighborhoods based on phonological similarity (Luce & Pisoni, Reference Luce and Pisoni1998). Neighborhood density is the number of words with a one-phoneme difference from a target word by addition, deletion, or substitution (Charles-Luce & Luce, Reference Charles-Luce and Luce1990; Goldinger, Luce, & Pisoni, Reference Goldinger, Luce and Pisoni1989; Luce & Pisoni, Reference Luce and Pisoni1998). Some words have many neighbors, called high-density words, and others have few neighbors, called low-density words.
The effect of density is different across three processes of word learning: triggering, configuration, and engagement (Storkel & Adlof, Reference Storkel and Adlof2009; Storkel, Armbrüster, & Hogan, Reference Storkel, Armbrüster and Hogan2006; Storkel, Bontempo, Aschenbrenner, Maekawa, & Lee, Reference Storkel, Bontempo, Aschenbrenner, Maekawa and Lee2013; Storkel & Lee, Reference Storkel and Lee2011). In the triggering process, the input is recognized as novel if a mismatch occurs between the novel word and an existing lexical representation in long-term memory, initiating word learning (Storkel et al., Reference Storkel, Bontempo, Aschenbrenner, Maekawa and Lee2013; Storkel & Lee, Reference Storkel and Lee2011). Since low-density words have fewer neighbors, the mismatch will be greater than for high-density words. Thus, low-density words facilitate the initiation of word learning (Storkel et al., Reference Storkel, Bontempo, Aschenbrenner, Maekawa and Lee2013; Storkel & Lee, Reference Storkel and Lee2011). In the configuration process following triggering, a phonological form of the novel word is retained in working memory for a short time as a new lexical representation for the novel word is being built in long-term memory (e.g., Gathercole, Frankish, Pickering, & Peaker, Reference Gathercole, Frankish, Pickering and Peaker1999). Since novel high-density words activate more neighbors and get more return activation from their neighbors than low-density words, phonological forms of high-density words may be retained in working memory more accurately and longer than low-density words, supporting the creation of a more accurate representation in long-term memory. In the engagement process, where the connection between the newly created and existing lexical representations is created, new representations for high-density words may form connections with many existing representations, becoming stronger representations than new representations for low-density words (Storkel et al., Reference Storkel, Bontempo, Aschenbrenner, Maekawa and Lee2013; Storkel & Lee, Reference Storkel and Lee2011). In general, past research on children's word learning has found a high-density advantage, especially, in the later processes of word learning: configuration and engagement (Storkel et al., Reference Storkel, Bontempo, Aschenbrenner, Maekawa and Lee2013; Storkel & Lee, Reference Storkel and Lee2011). Word learning following few exposures was assumed to tap triggering, following multiple exposures was assumed to tap configuration, and following post-exposure was assumed to tap engagement (Storkel & Lee, Reference Storkel and Lee2011).
However, the effect of density on word learning has been investigated in quiet conditions, despite children's noisy learning environment in the real world. Children are exposed to various noises other than speech in classrooms, one of the major learning environments for children. Moreover, classrooms are even noisier than recommended, and the noisy learning environment detrimentally affects cognitive processes and academic performance in various areas including word learning (e.g., Crandell & Smaldino, Reference Crandell and Smaldino2000a, Reference Crandell, Smaldino, Valente, Roeser and Hosford-Dunn2000b). Since vocabulary in young children is considered a significant predictor of reading comprehension and eventually academic success (Biemiller, Reference Biemiller, Hiebert and Kamil2005, Reference Biemiller, Dickinson and Neuman2006), it is essential to examine how noise may affect word learning.
However, to date, few studies have directly examined word learning in noise. A study by Riley and McGregor (Reference Riley and McGregor2012) on the effect of noise on word learning revealed that noise interferes with children's ability to retain the phonological form of the newly heard word in working memory, resulting in difficulty recalling the word accurately even with multiple exposures to the word. More specifically, all the different sound streams occurring in a noisy environment should be segregated based on acoustic components coming from each sound source (Bregman, Reference Bregman1990). While processing acoustic cues to separate and select target words from non-target sounds in noise, children may use the information on neighborhood density in learning novel words as they do in the quiet conditions. However, children need more listening effort to separate speech from noise in noisy listening conditions, leaving fewer available resources for language processing (e.g., Rabbitt, Reference Rabbitt1968). Consequently, children may show a different effect of density in noise than in quiet conditions.
The effect of noise on neighborhood density effects also has received little attention. Taler, Aaron, Steinmetz, and Pisoni (Reference Taler, Aaron, Steinmetz and Pisoni2010) examined adult spoken word recognition at two noise conditions (+10 dB and –3 dB SNRs) using a sentence repetition task where target words varying in neighborhood density were embedded in a sentence. The results showed that recognition accuracy was higher at + 10 dB SNR than at –3 dB SNR, and that adults recognized low-density words more rapidly and accurately than high-density words. More interestingly, the magnitude of the neighborhood density effect on recognition was greater in the challenging listening condition (–3 dB SNR) than in the favorable listening condition (+10 dB SNR), indicating that noise may amplify the effects of neighborhood density. Thus, noise may intensify the effect of neighborhood density on word learning. This hypothesis was examined in an adult word learning study by Han, Storkel, Lee, and Cox (Reference Han, Storkel, Lee and Cox2016), where there was no strong effect of density but adults still used the density information in noise. This finding indicates the attenuation of the density effect on word learning in noise.
The purpose of this study was to investigate how noise affects preschool children's ability to learn novel words. Specifically, to examine whether noise alters the effect of neighborhood density on word learning in preschool children, we proposed the following primary research question: What is the relationship between noise and neighborhood density in word leaning by preschool children? Based on the findings of the adult word learning study (Han et al., Reference Han, Storkel, Lee and Cox2016), we hypothesized that, as the listening condition worsens, children would not use existing lexical representations when learning high-density words. Our secondary research question was: Does noise influence children's performance on production and comprehension tasks of word learning? As in Riley and McGregor's (Reference Riley and McGregor2012) study with school-aged children, the effect of noise on word learning would be observed only in the production task but not in the comprehension task because of the ease of the comprehension task even in the presence of noise. However, it would be possible that the effect of noise on word learning would be observed in both tasks for the younger children, given developmental differences in the effect of noise on recognition (Elliot, Reference Elliot1979; Finitzo-Hieber & Tillman, Reference Finitzo-Hieber and Tillman1978; Nittrouer & Boothroyd, Reference Nittrouer and Boothroyd1990; Stelmachowicz, Hoover, Lewis, Kortekaas, & Pittman, Reference Stelmachowicz, Hoover, Lewis, Kortekaas and Pittman2000). Thus, preschool-aged children's performance on both production and comprehension tasks might decline as noise worsened.
Method
Participants
Participants were 102 typically developing preschool children (M: 4;7; Range: 4;0–5;5; SD: 4.68 months). Children were native English speakers from monolingual families with no cognitive, social, emotional, motor, visual, hearing, or major medical impairments as reported by their parents. Normal hearing was determined by a standard screening (ASHA, 1997). Children scored at or above the 16th percentile (standard score of 85) on the Goldman-Fristoe Test of Articulation-2 (GFTA-2; Goldman & Fristoe, Reference Goldman and Fristoe2000), the Expressive Vocabulary Test-2 (EVT-2; Williams, Reference Williams2007), and the Peabody Picture Vocabulary Test-4 (Dunn & Dunn, Reference Dunn and Dunn2007) to confirm normal articulation and vocabulary. Twenty-six, 24, and 27 children were randomly assigned to one of three noise conditions: +15 dB, +6 dB, and 0 dB signal-to-noise ratios, respectively. Twenty-five children were recruited later for the quiet control condition because any amount of noise was detrimental to word learning but the effect was not linear, resulting in the need for making a comparison of a quiet listening condition to each of the three listening conditions.
Materials
Sixteen consonant–vowel–consonant (CVC) nonwords were selected from a real word and nonword child corpus (Storkel, Reference Storkel2013).
Phonotactic probability, a characteristic of phonological representations (Jusczyk, Luce, & Charles-Luce, Reference Jusczyk, Luce and Charles-Luce1994), was measured by calculating positional segment sum and biphone sum (Storkel, Reference Storkel2004a) in the corpus. This study held phonotactic probability constant at a mid-level of positional segment sum and biphone sum (i.e., 50th percentile ± ½SD; Storkel, Reference Storkel2013) to explore the independent effect of neighborhood density as Storkel & Lee, (Reference Storkel and Lee2011) did.
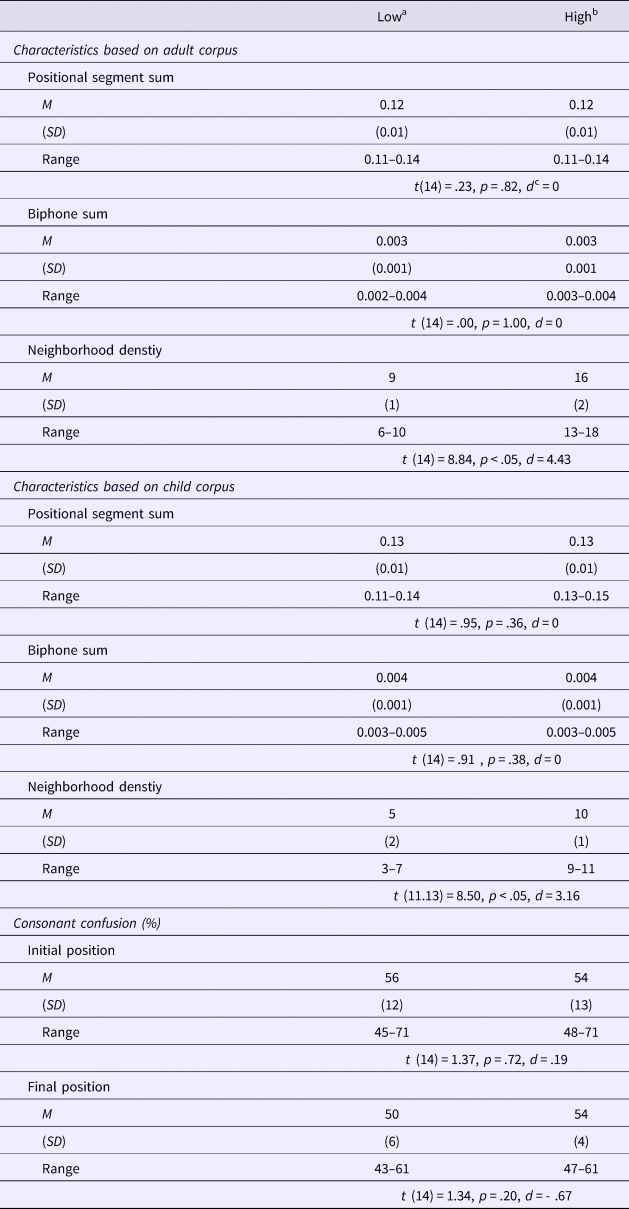
Neighborhood density was measured by counting the number of words in the corpus that have a one-phoneme difference from the target word by addition, deletion, or substitution. For this study, words ranking in the 10th–25th percentile and the 50th–75th percentile in the corpus were defined as low-density and high-density words, respectively, as Storkel & Lee (Reference Storkel and Lee2011) did. Eight low-density words and eight high-density words, with mid phonotactic probability, were selected. Table 1 presents the characteristic values for the CVCs obtained from both the child and the adult corpus.
Stimulus Characteristics

Note: a/gεp wæb fag mib haf jig maıb fup/
b/bo℧g fip mum naık peıg paıf wap j∧t/
c effect size: d = 0.3 small = 0.5 medium = 0.8 large
Possible confusion in noise between speech sounds and other similar sounds (Phatak, & Allen, Reference Phatak and Allen2007) may reduce consonant identification (Phatak, Lovitt, & Allen, Reference Phatak, Lovitt and Allen2008). In this study, to control consonant confusion of nonwords varying in neighborhood density, consonant confusion was calculated by averaging consonant confusion values across –10, –5, 0, +5, +10, and + 15 dB SNRs reported in the consonant confusion matrix of Wang and Bilger (Reference Wang and Bilger1973). Wang and Bilger's consonant confusion matrix provides the percent of time a speech sound is perceived correctly or confused with another speech sound. In this study, for example, consonant confusion of 32% for b in the nonword bo ʊg indicates that the consonant b is correctly heard as b in the initial consonant position for 32% of responses. No significant differences in consonant confusion were found between low- and high-density nonwords for the initial and final consonants [t(14) = 0.37, p = .72, d = 0.19; t(14) = 1.34, p = .20, d = –0.67, respectively], indicating that consonant confusability was controlled.
Novel object referents
This study used the same 16 novel object referents as those in Hoover, Storkel, and Hogan (Reference Hoover, Storkel and Hogan2010), Storkel (Reference Storkel2004b), and Storkel et al. (Reference Storkel, Armbrüster and Hogan2006). Among four novel objects in each of four semantic categories (candy machine, toy, horn, and pet), two paired with two low-density nonwords and the other two paired with high-density nonwords. This pairing was to equate semantic difficulty across low- and high-density nonwords.
Stories
This study used two stories from Hoover et al. (Reference Hoover, Storkel and Hogan2010) and Storkel et al. (Reference Storkel, Armbrüster and Hogan2006), but more exposures to nonwords were provided to avoid floor effects (i.e., 28 exposures for children and 7 exposures for adults in the past studies, respectively, and 30 exposures in the current study). The two stories of eight target words were presented randomly. The eight target words in a story consisted of four high-density and four low-density words, and they were selected randomly within a level of density (high or low). Stories were pre-recorded by a female native English speaker at a resolution of 16 bits with a sampling rate of 44.1kHz in a soundproof booth. Audibility of the stimuli was verified by having two native English speakers transcribe the nonwords and narrative under quiet listening conditions. All stimuli were transcribed as intended.
Signal-to-noise ratios
The recordings were digitally mixed with broadband white noise using MATLAB (Mathworks, 1992) to produce 0 dB, +6 dB, and + 15 dB SNRs. The 0 dB SNR, one of the common classroom SNRs (e.g., Bess, Reference Bess1985), indicates that the loudness of the speech signal and the noise are the same. This is the high-noise condition for this study. The + 6 dB SNR, one of the common classroom SNRs (e.g., Bess, Reference Bess1985; Finitzo-Hieber & Tillman, Reference Finitzo-Hieber and Tillman1978), refers to the speech signal being 1.5 (20.6) times louder than the noise. This is the moderate-noise condition for this study. The + 15 dB SNR means that the speech signal is 2.8 (21.5) times louder than the noise. This is the low-noise condition for this study. The speech signal was constant at 65 dB SPL as a presentation level and then noise was scaled for each SNR. A half second of silence was digitally added to the intervals between the nonwords to prevent masking the preceding or following stimuli.
Measures of learning
Learning was measured using a picture naming task (Naming) and a referent identification task (Comprehension). In Naming, children were asked to name a nonword that corresponded to a picture of one of the novel object referents on the computer screen. Children's responses were audio- and video-recorded and phonetically transcribed. Responses were scored as correct only when all three phonemes in the target nonword were named correctly in the correct word position. In Comprehension, children were shown eight pictures of non-objects. They heard a nonword presented in the assigned listening condition and were asked to select one of the eight pictures. Responses were scored as correct only when the correct picture was selected. Naming was always followed by Comprehension to prevent any possibility that Comprehension may facilitate the performance on Naming.
Procedure
Prior to each session, the presentation level of the stimulus was checked using the sound level meter as a randomly selected episode was playing. The presentation of the stimuli was controlled by DirectRT software (Jarvis, Reference Jarvis2002).
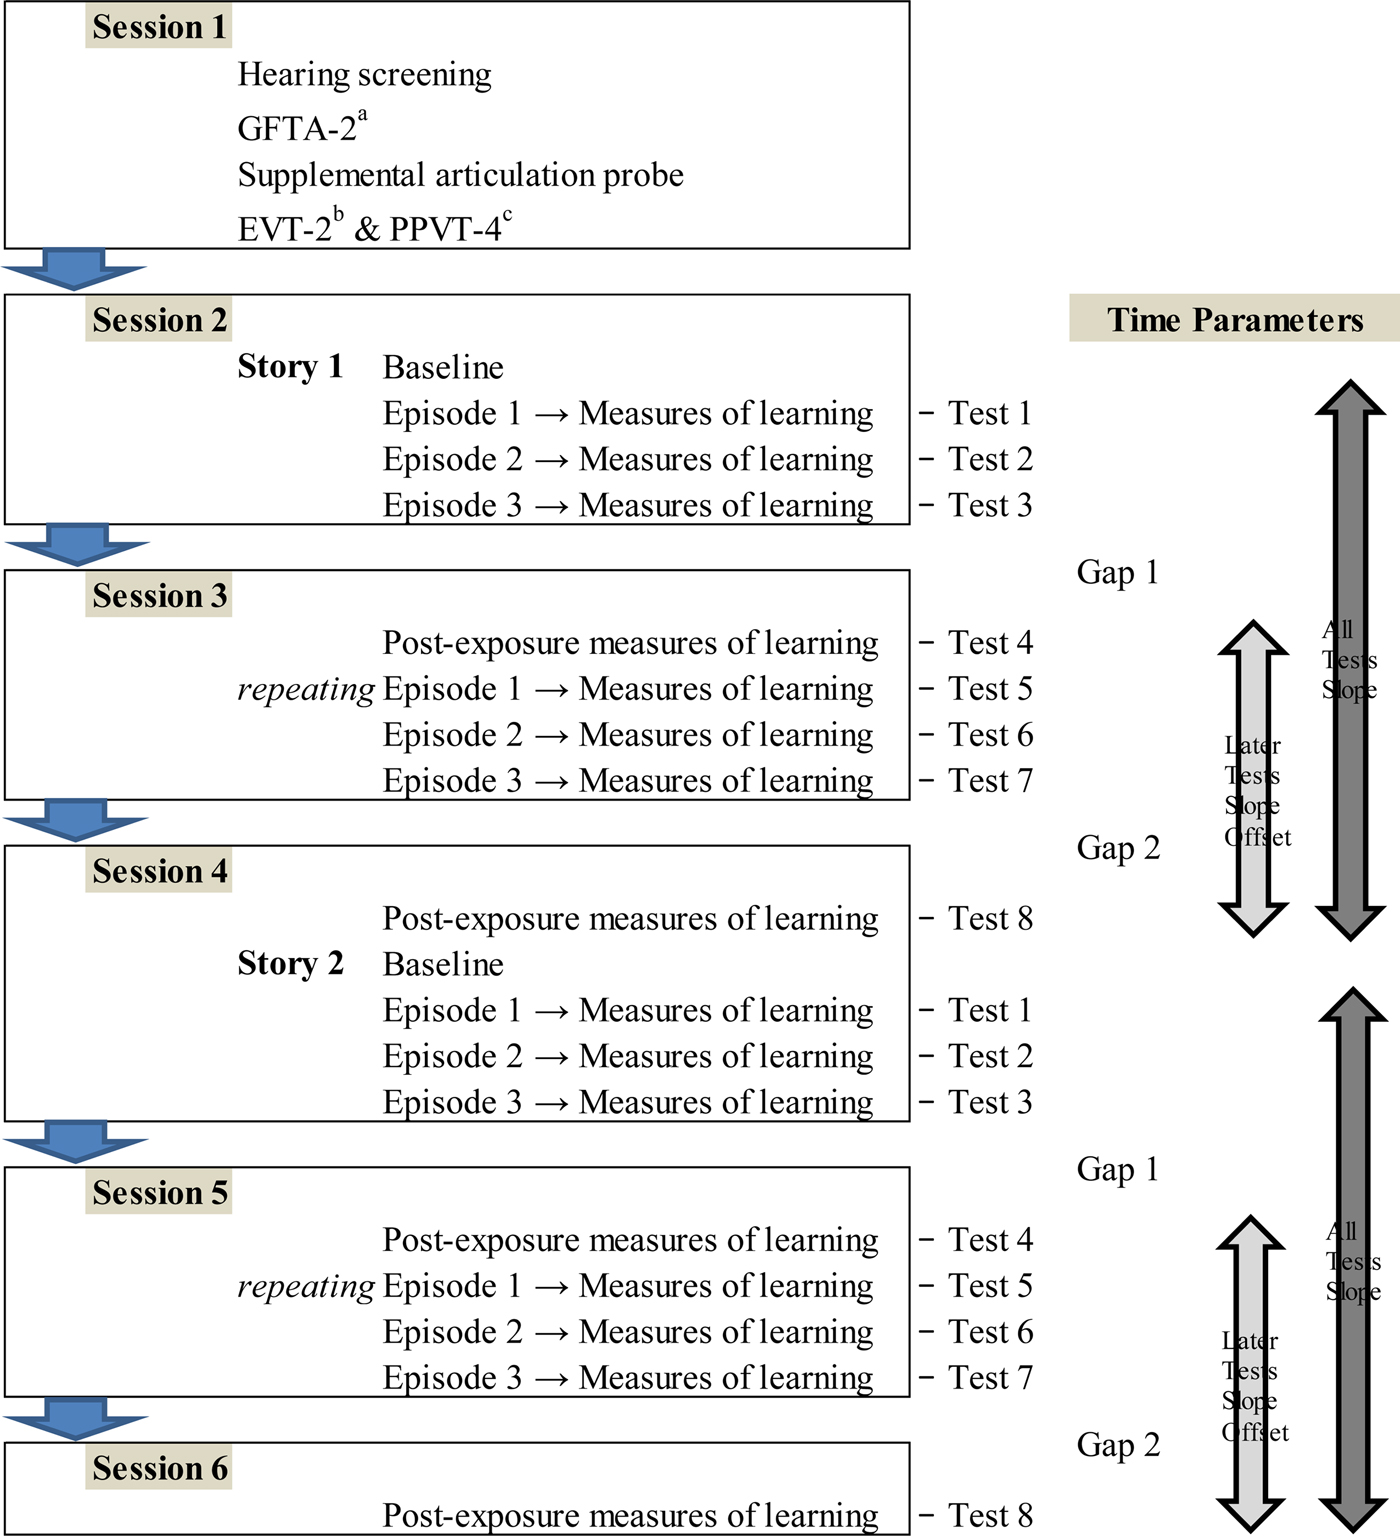
This study required six sessions, as seen in Figure 1. In the first session, screening was conducted on the child's hearing (ASHA, 1997), articulation (Goldman et al., Reference Goldman and Fristoe2000) with a supplemental articulation test for the target consonants in the nonwords, and receptive and expressive vocabulary (Dunn & Dunn, Reference Dunn and Dunn2007; Williams, Reference Williams2007, respectively). In the second session, a baseline was obtained for each nonword of the first story in the assigned listening condition using Naming and Comprehension. Then, three episodes were presented in the assigned listening condition, each of which was followed by measures of learning using the two tasks. In an episode, each of eight nonwords was presented five times, totaling 15 exposures by the end of the third episode. A few days later, the third session began with post-exposure measures of learning for the nonwords from the first story and then repeated the same episodes used in the second session. This repetition yielded 30 exposures to each nonword for the first story. Approximately one week later, the fourth session began with post-exposure measures of learning for the eight nonwords from the first story. Then, the same procedures were followed for the other set of eight nonwords in the second story. As with the nonwords from the first story, each of the nonwords from the second story was exposed 30 times in total.
Flow of experimental procedures and time parameters. The order of the presentation for Story 1 and Story 2 was randomized.

Reliability
Reliability for transcription, scoring, and procedure was computed for 22% of the participants. Mean percentage agreement on transcription was 99% (SD = 0.01%, range 97–100%) for both nonword productions during the word learning protocol and real word productions on the GFTA-2 and supplemental probe. Mean percentage agreement on scoring was 100% (SD = 0%) for scoring the child's production against the target nonword and for coding the child's response as either correct or incorrect. Mean percentage agreement on procedure was 99.91% (SD = 0.43%, range 98–100%) for correct administration and equipment function.
Analysis approach
A logistic multilevel modeling approach was used to analyze a binary dependent variable (i.e., correct vs. incorrect) for repeatedly observed responses to target nonwords utilizing crossed-random intercepts for participants and nonwords. Fixed effects were noise, neighborhood density, task, time/test, vocabulary scores, and possible interactions. As in Storkel, Bontempo, and Pak (Reference Storkel, Bontempo and Pak2014), the repeated time/test structure was represented by four parameters: All Tests Slope, Gap 1, Later Tests Slope Offset, and Gap 2. As seen in Figure 1, All Tests Slope described linear growth of learning across repeated testing (Tests 1–8). Gap 1 represented the first discontinuation from the linear growth that occurred between Tests 3 and 4. Later Tests Slope Offset described linear growth offset from All Tests Slope across Tests 4–8. Gap 2 represented the second discontinuation from the linear growth that occurred between Tests 7 and 8. A total of 25,696 observations were nested in 102 individuals.
Results
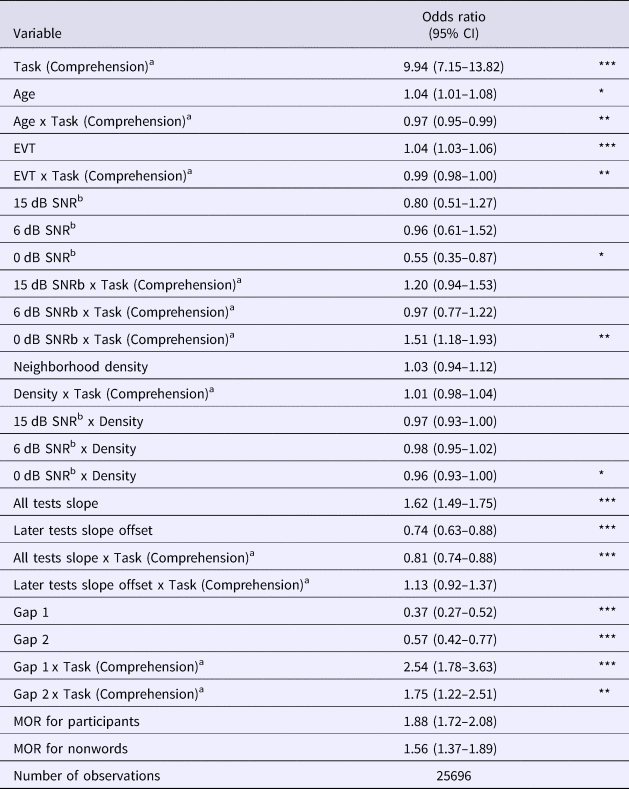
Table 2 presents the final multilevel model with the odds ratios (OR) for fixed effects and the median OR (MOR) for random effects.
Final Multi-level Model

Notes. OR = odds ratio; CI = confidence interval; MOR = median odds ratio.
a A reference for the variable Task is the naming task.
b A reference for the variables 15 dB SNR, 6 dB SNR, and 0 dB SNR is the quiet condition.
* p < .05; ** p < .01; *** p < .001.
Participant and item effects
Random effects of participants and nonwords show significant variance attributable to participants (MOR = 1.88, 95% confidence interval [CI] = 1.72–2.08) and nonwords (MOR = 1.56, 95% CI = 1.37–1.89). It is standard practice to report random effect variances in MOR metric to facilitate comparison to the magnitude of fixed effects in the model (Merlo et al., Reference Merlo, Chaix, Ohlsson, Beckman, Johnell, Hjerpe and Larsen2006). The MOR is interpreted as the median difference in the odds of a correct response between any two randomly selected participants/nonwords sharing the same pattern of fixed-effects. Appreciation of these variances can be obtained from comparison to OR of fixed effects. For example, since OR for age was 1.04, the magnitude of partitioned variance associated with participants and nonwords are respectively comparable to the effect of 16 months (1.0416 = 1.87) and 12 months (1.0412 = 1.60) on Naming.
The effect of task was significant. The odds of a correct response on Comprehension were considerably larger (OR = 9.94, 95% CI = 7.15–13.82) than Naming (OR = 1.0, reference), showing that Comprehension was much easier than Naming. Regarding raw values, percent correct on Comprehension (M = 26.27%, SD = 44.01%) was higher than Naming (M = 6.90%, SD = 25.35%).
The effects of age and age × task were significant. The odds of a correct response were 1.04 (95% CI = 1.01–1.08) times higher for a child 1-month older than another child on Naming. To interpret the impact of the interaction between variables in Table 2, OR for simple effect in the reference should be multiplied by OR for the interaction. For example, OR for the interaction of age × task (1.01) is obtained by multiplying OR for age (1.04) in the reference of task (Naming) and OR for age × Comprehension (0.97). This indicates that the advantage of being 1-month older is positive in both tasks, but greater for Naming than Comprehension.
The effects of EVT and EVT × task were significant. The odds of a correct response were 1.04 (95% CI = 1.03–1.06) times higher for 1-point increase in the EVT on Naming. The interaction of EVT × task (OR = 1.04 [OR for EVT] × 0.99 [OR for EVT × Comprehension] = 1.03) indicates that the advantage of a 1-point increase is positive in both tasks, but a bit greater for Naming than Comprehension. Regarding raw values, mean accuracy of participants with scores at or above the median standard score of 117 on Comprehension (M = 30.51%, SD = 46.05%) and on Naming (M = 9.16%, SD = 28.85%) was higher than that with scores below the median on Comprehension (M = 21.81%, SD = 41.30%) and on Naming (M = 4.54%, SD = 20.81%).
Taken together, the variability of participants was slightly larger than that of nonwords. The comprehension task was easier than the naming task. However, learning was better for the naming task than the comprehension task when children were older and when EVT was higher.
Effects of noise and neighborhood density
Significant effects of noise and noise × task were found only in the high-noise condition compared to the quiet condition. The odds of a correct response on Naming were significantly lower in the high-noise condition (OR = 0.55, 95% CI = 0.35–0.87) compared to the quiet condition (OR = 1.0, reference). The interaction of noise × task (OR = 0.55 [OR for high-noise] × 1.51 [OR for high-noise × Comprehension] = 0.83) indicates that there is still a significant but smaller reduction in learning in the high-noise condition compared to the quiet condition on Comprehension. Regarding raw values, percent correct was 29.68% (SD = 45.69%) on Comprehension and 9.09% (SD = 28.76%) on Naming for the quiet condition, but 24.03% (SD = 42.73%) on Comprehension and 4.81% (SD = 21.40%) on Naming for the high-noise condition.
There was a significant interaction of density × high noise. The odds of a correct response in the high-noise condition were 0.96 (95% CI = 0.93–1.00) times lower for a one-unit increase in density (mean across tasks) compared to the quiet condition, indicating reduced learning as density increases. Despite no effect of neighborhood density for Naming (OR = 1.03, 95% CI = 0.94–1.12) or density × task (1.03 [OR for density] × 1.01 [OR for density × Comprehension = 1.04), these non-significant estimates should be considered for better interpretation of the density × noise interaction to explore our primary research question. Figure 2 illustrates the rising slope of learning with density for the quiet condition, showing a trend of a high-density advantage, and the contrasting flat line for density in high noise removes the high-density advantage seen in the quiet condition. Regarding raw values, percent correct was 20.05% (SD = 40.05%) and 18.68% (SD = 38.98%) on high and low density, respectively, in the quiet condition, whereas percent correct was 14.09% (SD = 34.80%) and 14.76% (SD = 35.48%) on high and low density, respectively, in the high-noise condition.
The mean predicted probability of correct responses for neighborhood density across listening conditions: quiet (clear), +15 dB SNR (low noise), +6 dB SNR (moderate noise), and 0 dB SNR (high noise). The quiet condition served as a reference for the listening conditions.

Taken together, learning was better in the quiet condition than the high-noise condition. The trend of a high-density advantage found in the quiet condition was significantly reduced in the high-noise condition.
Time Effect
All time parameters showed significant effects except for Later Tests Slope Offset × task. The general baseline rate of learning across all tests (OR for All Tests Slope = 1.62, 95% CI = 1.49–1.75) was positive. This slope was offset by parameters for Later Tests Slope Offset, Comprehension, and Later Tests Slope Offset × Comprehension. The slope was flattened by the offset change in learning across later tests (1.62 [OR for All Tests Slope] × 0.74 [OR for Later Tests Slope Offset] = 1.20). The slope was also flattened by the offset change for Comprehension (OR = 1.62 [OR for All Tests Slope] × 0.81 [OR for All Tests Slope × Comprehension] = 1.31). The offset parameter for both Later Tests Slope Offset and Comprehension was not significant but the estimate is in the flatter direction (1.62 [OR for All Tests Slope] × 0.81 [OR for All Tests Slope × Comprehension] × 0.74 [OR for Later Tests Slope Offset] × 1.13 (OR for Later Tests Slope Offset × Comprehension] = 1.10). Figure 3 illustrates that the slope across Tests 4–8 is more gradual than the slope across Tests 1–8, especially on Comprehension,Footnote 1 indicating a reduced learning rate during later training.
Mean proportion correct response across tests by task. The lines are the linear fit lines for each task: The solid/dashed line for Tests 1–8 in each panel illustrates the effect of All Tests Slope; and the solid line for Tests 4–8 in each panel illustrates the effect of Later Tests Slope Offset. The first discontinuation from the linear growth (Gap 1) occured between Test 3 and Test 4. The second discontinuation from the linear growth (Gap 2) occured between Test 7 and Test 8.

The slope across all tests was also offset by parameters for Gap 1, Gap 2, and Gap × Comprehension interaction parameters. As seen in Figure 3, a decrease in word learning occurred during no training on Naming (OR = 1.62 [OR for All Tests Slope] × 0.37, [Or for Gap 1] = 0.60 for Gap 1; OR = 1.62 [OR for All Tests Slope] × 0.57 [OR for Gap 2] = 0.92 for Gap 2), whereas additional learning occurred during no training on Comprehension (OR = 1.62 [OR for All Tests Slope] × 0.37 [OR for Gap 1] × 2.54 [OR for Gap 1 × Comprehension] = 1.52 for Gap 1; OR = 1.62 [OR for All Tests Slope] × 0.57 [OR for Gap 2] × 1.75 [OR for Gap 2 × Comprehension] = 1.62 for Gap 2).
Taken together, learning was steep during initial training and then slowed for later training. Between training episodes, children forgot trained items for the naming but showed memory consolidation for trained items in the comprehension task.
Discussion
This study examined how noise affected the ability to learn novel words in four- and five-year-old preschool children in the production (Naming) and comprehension tasks with a primary interest in the relationship between noise and neighborhood density. Results revealed (i) a significant decrease in learning in the high-noise condition compared to the quiet condition; (ii) no significant effect of density but the trend of a high-density advantage in the quiet condition; (iii) a significant reduction of the high-density advantage in the high-noise condition; and (iv) a greater reduction in learning found in the production task than the comprehension task in the high-noise condition. Additionally, results revealed that, during training, learning occurred over time for both the production and comprehension tasks with learning slowed during later training. During no training, learning was decreased for the production task whereas additional learning occurred for the comprehension task.
What is the relationship between noise and neighborhood density in word leaning by preschool children?
Not surprisingly, the result of the current study on the noise effect indicates that noise may influence the number of words children learn, but past research (Han et al., Reference Han, Storkel, Lee and Cox2016) suggests that this is not true for the number of words adults learn in the context of noise. As noise increases, children tend to learn fewer words than in the quiet condition, indicating children's vulnerability to noise in learning new words. The effect is statistically significant, but small compared to other factors influencing learning.
Although much past research establishes a high-density advantage for children under quiet listening conditions (Storkel & Adlof, Reference Storkel and Adlof2009; Storkel et al., Reference Storkel, Armbrüster and Hogan2006, Reference Storkel, Bontempo, Aschenbrenner, Maekawa and Lee2013; Storkel & Lee, Reference Storkel and Lee2011), the current research suggests that this advantage may not be readily apparent under conditions that resemble typical classrooms. As shown in Figure 2, high-density words have a small learning advantage in the quiet condition, but this advantage is reduced under noise conditions, with the largest reduction in the high-noise condition, as predicted based on the findings of the adult word learning study (Han et al., Reference Han, Storkel, Lee and Cox2016). This interaction between noise and neighborhood density may be explained by the roles of neighborhood density: facilitation and inhibition. Regarding neighborhood facilitation, neighbors may support both the involvement of working memory in the configuration process of word learning and the connection between new representations and existing representations in the engagement process of word learning, leading to the high-density advantage. Regarding neighborhood inhibition, neighbors may compete during word recognition in which low-density words have fewer competitors than high-density words in the triggering process of word learning, leading to the low-density advantage. However, when noise is added, the neighborhood inhibition may be highlighted and limits the neighborhood facilitation, which obscures the high-density advantage. As noise increases, the high-density advantage may be reduced. In contrast, as the listening condition improves, the neighborhood facilitation may be intensified and the high-density advantage emerges. This idea is supported by a spoken word recognition study conducted by Taler et al. (Reference Taler, Aaron, Steinmetz and Pisoni2010) in which neighborhood inhibition was greater in the challenging listening condition than in the favorable listening condition. This result suggests that noise may obscure the high-density advantage that may occur during configuration and engagement. Interestingly, our findings with children are at odds with prior research with adults (Han et al., Reference Han, Storkel, Lee and Cox2016), which demonstrates that adults retain a density advantage under noisy conditions. This suggests a potential developmental progression in the ability to leverage higher density as noise increases.
Does noise influence children's performance on the production and comprehension tasks of word learning?
Unlike the study by Riley and McGregor (Reference Riley and McGregor2012) with school-aged children, and as predicted based on the findings of past recognition research (Elliot, Reference Elliot1979; Finitzo-Hieber & Tillman, Reference Finitzo-Hieber and Tillman1978; Nittrouer & Boothroyd, Reference Nittrouer and Boothroyd1990; Stelmachowicz et al., Reference Stelmachowicz, Hoover, Lewis, Kortekaas and Pittman2000), this study with preschool-aged children found the effect of noise in both tasks in the high-noise condition, with significant but greater reduction in learning on the production task than the comprehension task. The production task involves recall memory in which the child has to search words saved in long-term memory to find the target word that relates to the picture, and to plan to produce the word. Only a produced word with correct information saved in long-term memory can be counted as a target item. In contrast, the comprehension (referent identification) task involves recognition memory in which the child has to compare the auditorily presented word to the given number of words that relate to the pictures, and to decide which picture among the pictures presented corresponds to the heard word. Even vague or partial information of a word saved in long-term memory can be sufficient to select a correct picture. Therefore, the production task is more difficult in nature than the comprehension task, especially for younger children. In Riley and McGregor (Reference Riley and McGregor2012), noise adversely influenced school-aged children's word learning performance on the production task but not on the comprehension task. This is consistent with the findings of Hygge, Boman, and Enmarker (Reference Hygge, Boman and Enmarker2003) on two text-reading tasks: recall question and recognition question. They found that noise adversely influenced young adults’ performance on the recall question task but not on the recognition question (multiple-choice question) task. This suggests developmental differences in the effect of noise on the production and comprehension tasks of word learning.
In addition to these findings that are relevant to our research questions, a significant time effect was found. During training, children were more likely to learn words over time in both the naming and referent identification tasks, but their learning rate slowed during later training. It might be attributed, on the one hand, to the effect of noise over time. However, because we were not able to explore the interaction of noise × time and noise × density × time (discussed further below), it is hard to interpret this reduced learning rate during later training with the effect of noise. On the other hand, given that the children were not approaching ceiling, they might have learned all they could from receptive training (i.e., seeing and hearing the stories). The children might have learned more with different types of training (e.g., expressive training including children's verbalization of the target words, and/or interactive and reciprocal training with the examiner). When training was discontinued, children were more likely to forget newly learned words in the naming task, but continued to improve in the referent identification task. These results suggest that recognition memory may be more sensitive to training than recall memory (Storkel et al., Reference Storkel, Bontempo and Pak2014). However, it is not clear whether forgetting and memory consolidation depend on task, because past studies showed memory consolidation in both the tasks (e.g., Storkel & Lee, Reference Storkel and Lee2011).
Finally, we acknowledge that our results were based on answering our research question within the power constraints. Mostly due to low learning and small effect sizes, we had insufficient power to model more than 2-way interactions. Especially, we could not explore the interaction of noise × density × task to examine how the effect of noise on the high-density advantage differs by task, or the interaction of noise × density × time to examine whether the effect of noise on the high-density advantage changes in a specific process of word learning. We would expect for the interaction of noise × density × time that the low-density advantage occurs in the triggering process whereas noise obscures the high-density advantage in the configuration and engagement processes. This hypothesis needs to be explored. In addition, despite many similar methods to prior research (Hoover et al., Reference Hoover, Storkel and Hogan2010; Storkel, Reference Storkel2004a, Reference Storkel2004b, Reference Storkel2013; Storkel et al., Reference Storkel, Armbrüster and Hogan2006; Storkel & Lee, Reference Storkel and Lee2011), this study showed poorer predictions and larger residuals that may contribute to non-significance in the density effect in the quiet condition.
In conclusion, this study was designed to reflect the real world listening conditions on the effect of neighborhood density in learning words by children. The results revealed that the non-significant advantage of high-density in the quiet condition was significantly reduced in the high-noise condition. This indicates that high noise may influence creating, refining, and connecting new lexical representations with existing lexical representations more adversely than initiating word learning, probably impacting long-term outcomes of word learning. This study will contribute to setting the foundation for future research on the effect of density on word learning in noise with children who are highly vulnerable to noise, including children with hearing loss, foreign language learners, and children with auditory learning problems.
Acknowledgments
This research was supported by NIDCD Grant DC-08095 awarded to Holly L. Storkel, and by the Doctoral Student Research Fund at the University of Kansas awarded to Min Kyung Han.