



INTRODUCTION
Parasite species richness and interaction strength exhibit a range of geographic patterns, which result from a variety of ecological, epidemiological and evolutionary forces (Poulin et al. Reference Poulin, Krasnov, Mouillot and Thieltges2011; Morand, Reference Morand2015). Moreover, host characteristics (e.g. species richness, abundance, density and geographic range) and the specificity of the parasite are thought to shape parasite biogeography (Nunn et al. Reference Nunn, Altizer, Sechrest and Cunningham2005; Torres et al. Reference Torres, Miquel, Casanova, Ribas, Feliu and Morand2006; Krasnov et al. Reference Krasnov, Shenbrot, Khokhlova, Mouillot and Poulin2008; Poulin et al. Reference Poulin, Krasnov, Mouillot and Thieltges2011). For example, it is generally assumed that parasite species richness is high in the tropics, matching the high host diversity there (Poulin, Reference Poulin2004, Reference Poulin2007; but see Torchin et al. Reference Torchin, Muira and Hechinger2015). In a review of biotic interactions over latitudes, Schemske et al. (Reference Schemske, Mittelbach, Cornell, Sobel and Roy2009) found many factors associated with parasitism are negatively correlated with latitude, including parasite species richness, rates of parasitism, infection intensity and genetic variation of the host. Unfortunately, they also concluded that the limited data regarding latitudinal variation of parasites and their interactions did not permit a robust test of general patterns. For marine systems in particular, analyses of parasite diversity are constrained due to the lack of parasite surveys and taxonomic resolution for many tropical parasites (Poulin, Reference Poulin2010).
To begin to fill this gap, we measured and compared parasite richness, including protistan and metazoan parasites, in the tropical waters along the coasts of two ocean basins in Panama. We focused on commonly occurring hosts, examining a group of bivalves generally considered oysters within Ostreidae, Isognomonidae and Pteriidae, for multiple reasons. First, as in many other global regions, oysters are abundant, accessible and diverse along both coasts of Panama. Second, oysters are ecologically important in coastal habitats (Kemp et al. Reference Kemp, Boynton, Adolf, Boesch, Boicourt, Brush, Cornwell, Fisher, Glibert, Hagy, Harding, Houde, Kimmel, Miller, Newell, Roman, Smith and Stevenson2005; Coen et al. Reference Coen, Brumbaugh, Bushek, Grizzle, Luckenbach, Posey, Powers and Tolley2007). Third, compared with other taxonomic groups, these bivalves are relatively well-studied from the perspective of parasites and pathogens, including identification of parasite taxa and knowledge regarding the effects of parasites on individual hosts (Villalba et al. Reference Villalba, Reece, Camino Ordás, Casas and Figueras2004; Burreson and Ford, Reference Burreson and Ford2004; Aguirre-Macedo et al. Reference Aguirre-Macedo, Simá-Álvarez, Román-Magan and Güemez-Ricalde2007). Though few studies have examined parasite richness associated with oysters residing in tropical locations (but see Aguirre-Macedo et al. Reference Aguirre-Macedo, Simá-Álvarez, Román-Magan and Güemez-Ricalde2007; Moss et al. Reference Moss, Xiao, Dungan and Reece2008; Cáceres-Martínez et al. Reference Cáceres-Martínez, Ortega, Vásquez-Yeomans, García, Stokes and Carnegie2012), there is a significant baseline of knowledge and identification methods to draw upon from temperate latitudes. In short, oysters provide a useful model system to examine marine parasite distribution and richness in the tropics.
The Panamanian isthmus is bordered by two oceans with very different abiotic factors and vast differences in the flora and fauna on the two coasts (Jones, Reference Jones1972). The Pacific side has higher tidal amplitude, more variable salinity, more seasonal upwelling and is more greatly impacted by El Niño Southern Oscillation (ENSO) events than the Caribbean side (Glynn, Reference Glynn and Jones1972; Lessios, Reference Lessios2008). These abiotic factors cause differences in the diversity and abundance of macroorganisms, including bivalves, in the two oceans. Older comparisons of molluscan taxa between oceans led researchers to believe that molluscs were more diverse on the Pacific side, which was likely associated with greater sampling intensity there (Olsson, Reference Olsson and Jones1972). More recent surveys of bivalves revealed that richness is generally higher in the Caribbean, but that individual species are usually more abundant on the Pacific side (Smith et al. Reference Smith, Jackson and Fortunato2006; Marko and Moran, Reference Marko and Moran2009). Additionally, the high volume of international shipping associated with the Panama Canal for the last century makes this area a potential ‘hotspot’ for biological invasions (Ruiz et al. Reference Ruiz, Torchin and Grant2009), influencing the diversity and distribution of both hosts and parasites. Thus, the two sides of the isthmus offer very different environments and native communities with opportunities via ship-mediated transfers for marine species, some of which can invade habitats near both entrances of the Panama Canal and use it to disperse across ocean basins.
To begin to resolve broad-scale patterns of biogeography and diversity for oyster parasites within the coastal waters of Panama, we used morphological and molecular data to identify metazoan and protistan parasites associated with ten oyster species collected from multiple locations along the Pacific and Caribbean coasts, including both sides of the Panama Canal and the Bocas del Toro archipelago. In addition to recording all observable metazoan parasites and symbionts, we specifically screened for notable protistan parasites, specifically those in the genus Perkinsus and in the phylum Haplosporidia, which are well-known and cause disease in oyster populations. Our goals were to (1) measure and compare the parasite richness and host association of the protistan and metazoan parasites, (2) characterize parasite species distributions among different locations and regions along both coasts and (3) compare differences in parasite richness and frequency of occurrence between ocean basins. We predicted a high diversity of protistan and metazoan parasite species associated with oysters on both coasts, with greater overlap of species between the Canal regions (Pacific-Canal vs. Caribbean-Canal) than between the two regions along the Caribbean coast (Caribbean-Canal vs Bocas del Toro), due to the potential for ship-mediated parasite dispersal across the Canal.
MATERIALS AND METHODS
Sampling scheme
We collected oysters from a variety of intertidal and subtidal habitats (e.g. mangrove rhizophores, rocks, docks, pilings) at multiple locations for each of three separate regions, which were the Pacific and Caribbean coasts near the Panama Canal and at Bocas del Toro (see supplementary material (ESM) Table 1). Sampling occurred during the Panamanian dry season (December 2011 through March 2012) and in primarily high salinity sites (>20 ppt) based on the assumption that parasite prevalence would be highest under these conditions. Maps showing the sampling locations and proportions of protistan parasites detected were generated using ArcGIS 10·2·2 for Desktop (Esri, Redlands, California). Within each geographic region (i.e. Pacific-Canal, Caribbean-Canal and Bocas del Toro), our aim was to sample three oyster species from three separate locations. We attempted to find locations with sufficient numbers of all three species co-occurring; however, this was not always possible. Within each location, ten oysters of each species were collected from five sites (with sites being ~5−10 m apart), resulting in 50 individuals collected per location, and this was repeated at three locations to yield 150 individuals per region (10 individuals × 5 sites/location × 3 locations = 150 individuals per species per region, where available) for each species. From this pool, ~30 individuals were screened per location, resulting in ~90 individuals screened for protistan parasites per region for each oyster species. To determine the presence of metazoan parasites, a maximum of six oysters of each species from each site was collected (6 individuals × 5 sites × 3 locations = 90 individuals per species per region) following the same sampling stratification as the collection for protistan parasites.
Sampling regions and locations, including the total abundance (in parentheses) of individual parasites or symbionts collected per species per location and the prevalence (as a percentage) of each metazoan parasite or symbiont associated with each bivalve species within each location

Prevalence values greater than zero are shown in bold. Confidence intervals (95%) are included for prevalence calculations for the three identified metazoans. Note that as we did not genetically confirm the identities of oysters screened for metazoan infections, we only list Crassostrea sp. in the two sites where both Crassostrea species were found.
Upon collection, oysters were placed in coolers on ice and kept at ~4 °C in the laboratory for no more than 72 h. The oysters were tentatively identified in the field based on morphology. The majority of shells were thoroughly cleaned, dried, labelled with unique identification numbers and retained as vouchers.
Microscopy screening for Metazoan parasites
Oysters were shucked and immediately dissected. More specifically, major bivalve tissues and organs were mounted on large glass slides, squashed and then visually screened for metazoan parasites at 10−40× magnification using a dissecting microscope. The identity and number of metazoan parasites and symbionts was recorded. Vouchers of all metazoans found were preserved in 95% ethanol for potential future use. When possible, photos of parasites were taken during dissections for identification. Due to the low number of samples processed, we calculated confidence intervals for the prevalence estimates obtained.
Bivalve species determination
The methods used to determine the species identities of the oysters are described in Pagenkopp Lohan et al. (Reference Pagenkopp Lohan, Hill-Spanik, Torchin, Strong, Fleischer and Ruiz2015). Briefly, we amplified and sequenced a fragment of the mitochondrial cytochrome oxidase I (COI) gene using the primers jgLCO1490/jgHCO2198 from Geller et al. (Reference Geller, Meyer, Parker and Hawk2013). Final host identification was determined using Bayesian and Maximum Likelihood (ML) phylogenetic analyses combined with morphological criteria. Due to the large number of oysters in this study, we only molecularly confirmed a subset (n = 5–10 individuals per species per location) of the oysters sampled. We assumed all remaining oysters that were morphologically similar or only found in a single sampling location were the same species. The exception was for the Crassostrea species in the Caribbean, as it was impossible to use morphological and/or ecological criteria to separate Crassostrea virginica from Crassostrea rhizophorae.
We created a restriction enzyme digest that could distinguish C. virginica from C. rhizophorae. After amplifying the COI fragment mentioned above, we digested 13·2 µL of the polymerase chain reaction (PCR) product with 6 U of restriction enzyme SalI-HF (New England Biolabs, Ipswich, MA), and 1 × NE buffer (New England Biolabs) in a total volume of 15 µL for 30 min at 37 °C, then 20 min at 65 °C. An aliquot of the digested product (8 µL) was electrophoresed on an agarose gel (4% w/v) stained with GelRed (Phenix Research, Candler, NC) and visualized under ultraviolet (UV) light. The PCR product from C. virginica did not have the SalI-HF restriction site and remained undigested, whereas the PCR product from C. rhizophorae was cleaved into two fragments (~350 and 300 bp each). To confirm the accuracy of the digestion, any samples that appeared undigested (i.e. were identified as C. virginica) were directly cycle-sequenced (see below) for confirmation.
Metazoan parasites: DNA extraction, PCR amplification and sequencing
To molecularly determine the species identities of a subset of the pea crabs collected from the two coasts, we sampled 1–2 walking legs or half an individual crab, depending on size. Following an overnight digestion with proteinase K, we extracted genomic DNA using a DNEasy Blood and Tissue kit (Qiagen, Valencia, CA) following the manufacturer's protocol. All extractions completed within the same day included a blank extraction, which served as a negative extraction control for PCR. We used the same primer set, jgLCO1490/jgHCO2198 from Geller et al. (Reference Geller, Meyer, Parker and Hawk2013), and amplification protocols as for the oysters (see Pagenkopp Lohan et al. Reference Pagenkopp Lohan, Hill-Spanik, Torchin, Strong, Fleischer and Ruiz2015). We directly cycle-sequenced all amplified fragments (see below).
Protistan parasites: DNA extraction, PCR amplification and sequencing
To screen for the presence of protistan parasites, we sampled pieces of gill, mantle and digestive gland from each individual and preserved them in 95% ethanol. Following an overnight digestion with proteinase K, we extracted genomic DNA from all three tissues sampled, which were pooled into a single extraction, to increase the likelihood of parasite detection using a Qiagen Biosprint Kit (Qiagen) following the manufacturer's protocols for animal tissues. All extractions completed within the same day included a blank extraction, which served as a negative extraction control for PCR.
We used two molecular assays to screen for protistan parasites. First, we used the primers PerkITS85/PerkITS750 (Casas et al. Reference Casas, Villalba and Reece2002), a genus-specific primer set that amplifies ~700 bp fragment of the first internal transcribed spacer region (ITS1) of the ribosomal gene complex (rDNA) of parasites within the genus Perkinsus. PCR reagents consisted of 1× GeneAmp 10× PCR Gold Buffer (150 mm Tris-HCl, pH 8·0; 500 mm KCl; Applied Biosystems, Carlsbad, CA), 1·5 mm MgCl2, 0·2 mm each nucleotide, 0·5 µ m each primer, 0·2 mg mL−1 bovine serum albumin (BSA; New England Biolabs), and 0·025 units µL−1 of AmpliTaq Gold with water to a final volume of 20 µL. Thermocycling was carried out using a Peltier Thermo Cycler DNA Engine Tetrad 2 (Bio-Rad, Hercules, CA) with an initial denaturation of 94 °C for 10 min, 40 cycles of 94 °C for 30 s, 55 °C for 1 min, 72 °C for 1 min and a final elongation of 72 °C for 5 min. Second, we used the generic primer set HAPF1/HAPR3 (Renault et al. Reference Renault, Stokes, Chollet, Cochennec, Berthe, Gerard and Burreson2000) to amplify a ~350 bp fragment of the ribosomal small subunit RNA (SSU rRNA) gene of haplosporidians. PCR reagents consisted of 1× GeneAmp 10× PCR Gold Buffer (150 mm Tris-HCl, pH 8·0; 500 mm KCl; Applied Biosystems), 1·5 mm MgCl2, 0·2 mm each nucleotide, 0·5 µ m each primer, 0·4 mg mL−1 BSA (New England Biolabs), and 0·03 units µL−1 of AmpliTaq Gold with water to a final volume of 20 µL. Thermocycling was carried out using a Peltier Thermo Cycler DNA Engine Tetrad 2 (Bio-Rad) with an initial denaturation of 94 °C for 10 min, 10 cycles of 94 °C for 30 s, 54 °C for 30 s with a decrease of 1 °C per cycle, 72 °C for 1 min, then 35 cycles of 94 °C for 30 s, 44 °C for 30 s, 72 °C for 1 min, and a final elongation of 72 °C for 5 min. For each screening assay, an aliquot of PCR product (5 µL) was electrophoresed on an agarose gel (2% w/v) stained with GelRed (Phenix Research) and visualized under UV light. All amplified fragments from oysters, pea crabs and parasites were bidirectionally cycle-sequenced using the Big Dye Terminator Cycle Sequencing Kit v3·1 (Applied Biosystems, Inc.) and the amplicons were sequenced on an ABI 3130 Sequencer (Applied Biosystems, Inc.).
Phylogenetic analyses
Sequences were edited using Sequencher 5·1 (Gene Codes Corporation, Ann Arbor, MI). Only unique sequences, defined as those that differed by either a single base pair or gap, were used in the phylogenetic analyses. Identical sequences and sequences that only differed due to ambiguities were concatenated into contigs with other identical sequences or, in the case of ambiguities, either the next closest sequence or the contig containing the largest number of sequences (if more than one sequence or contig was a potential match). Phylogenetic analyses were then performed using the consensus sequence from each of the unique contigs.
A subset of sequences for all Perkinsus spp., haplosporidian species or clades, and pea crabs from published sources were obtained from GenBank and used to generate phylogenetic trees to determine the parasite species detected in Panama. Sequences within each taxa (Perkinsus spp., haplosporidians and pea crabs) were aligned in Geneious 7·1·8 (Biomatters, Ltd., San Francisco, CA) with the MAFFT (Katoh et al. Reference Katoh, Misawa, Kuma and Miyata2002, Katoh and Toh, Reference Katoh and Toh2008) plug-in, using either the default parameters or the E-INS-I algorithm, then manually adjusted if needed. Terminal gaps were removed. For the haplosporidian alignment, sequences that were extremely different from all the others were removed from the alignment and the sequences were re-aligned. The alignment for the pea crab dataset was 505 bp. The alignment for the Perkinsus dataset was 632 bp. The alignment for the haplosporidian dataset was 308 bp. JModeltest 2·1·4 (Darriba et al. Reference Darriba, Taboada, Doallo and Posada2012) was used to determine the best substitution models for each alignment based on Akaike Information Criterion corrected values using the appropriate number of available substitution models for Bayesian and ML analyses. Phylogenetic trees were generated for all three alignments in Geneious 7·1·8 using the suggested substitution models implemented in MrBayes 2·0·6 (Ronquist and Huelsenbeck, Reference Ronquist and Huelsenbeck2003) with the default parameters and PhyML for the haplosporidian and Perkinsus alignments (Guindon et al. Reference Guindon, Dufayard, Lefort, Anisimova, Hordijk and Gascuel2010) using the NNI topology search option with 1000 bootstrap replicates. As the sequences used in these analyses represent only a portion of a single gene, including a hypervariable region of the SSU rRNA gene, we did not use these data to infer evolutionary relationships between clades, but solely to determine the clades that included sequences from this study for parasite identification. Additionally, confidence intervals for the frequency estimates for both protistan taxa were calculated.
RESULTS
Metazoan parasites and symbionts
We microscopically screened 737 oysters and identified multiple metazoan taxa including pea crabs and turbellarians (Stylochus spp. and Urostoma cyrinae) (Table 1). While we found a number of cysts, none were morphologically identified at the time of sampling, though a few were later identified from photos as the metacestode stage of Tylocephalum sp. Pea crabs were the only metazoan parasite that occurred on both coasts (Table 1). The phylogenetic analyses revealed two distinct clades, indicating two species of pea crabs occurring on opposite sides of the isthmus (Fig. 1, GenBank Accession KU172681–KU172692). Comparison with unpublished sequence data (University of Louisiana Lafayette Zoological (ULLZ) Collection catalog numbers 9601 and 13298; Emma Palacios Theil and Darryl L. Felder, in prep.) identified these species as Austinotheres angelicus on the Pacific coast and Zaops ostreum on the Caribbean coast. Austinotheres angelicus infected only one species (S. palmula), while Z. ostreum infected at least three species (C. rhizophorae, Saccostrea sp., Crassostrea sp.).
Phylogram of pea crab COI sequences from this study (in bold) and GenBank sequences. The GTR + I + G substitution model was used for the Bayesian analysis and posterior probabilities are shown. See text for additional details.

There were slight variations in parasite richness between regions and locations. Within regions, Bocas del Toro had three species, while both the Caribbean-Canal and Pacific-Canal had two species. Within the locations the highest parasite richness was only three, observed at Punta Caracol. None of these observations account for unidentified cysts that may represent multiple species.
Metazoan parasites also showed variation in distribution among hosts and infection intensity. The micropredator Stylochus spp. was only observed in oysters on the Pacific coast and the heaviest infestations were always observed in Striostrea prismatica (Table 1). The number of worms per individual ranged from 0 to 12 worms at Bique Intertidal, 0–13 at Veracruz and 0–5 at Punta Culebra. The parasite Urastoma cyprinae was only detected in bivalves from Bocas del Toro and the heaviest infections were observed in C. rhizophorae. The infection intensities in a single host ranged from 0 to 17 at Punta Caracol, from 0 to 1 at STRI Dock and Casa Blanca/Verde.
Protistan parasites
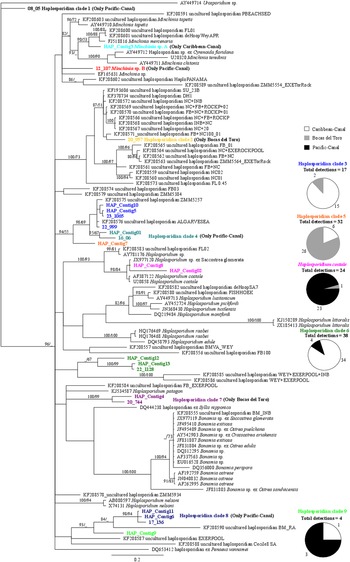
We used genetic methods to screen 752 oysters for protistan parasites. We detected at least 16 different species of protistan parasites, all of which represent new host records for Panama (GenBank Accession KU172633 – KU172680). As we did not confirm infection status for these hosts, which require histological examination of the parasites in host tissue (Burreson, Reference Burreson2008), we report the frequency (or percentage) of detections (i.e. number of positive individuals). Based on the phylogenetic analyses using ITS1 sequence data, four species of Perkinsus were detected, including Perkinsus marinus, Perkinsus chesapeaki, Perkinsus olseni and Perkinsus beihaiensis (Fig. 2). Based on the phylogenetic analyses comparing the haplosporidian sequences from this study to those from previously published studies, two additional genera, Haplosporidium and Minchinia, were detected. Unfortunately, the majority of haplosporidian sequences could not be assigned to a particular genus due to the short length of the amplified fragment and the large number of unidentified haplosporidians in the literature (Fig. 3). Therefore, we conservatively report finding nine haplosporidian clades (possibly representing individual species), two species of Minchinia, and Haplosporidium costale. In some instances, clades are represented by a single sequence (e.g. Clade 1, Minchinia sp. B) while other clades consist of multiple contigs each containing multiple identical sequences from different locations throughout Panama (ESM Table 2). Clade 6 was the most frequently detected (n = 37), followed by Clade 5 (n = 32), then H. costale (n = 24). These three clades were also the most geographically widespread (ESM Table 2).
Phylogram for Perkinsus spp. constructed using ITS1 sequences generated in this study (in bold) and GenBank sequences. The GTR + G substitution model for the Bayesian analysis and TPM3uf + G model for the Maximum Likelihood analysis produced highly similar topologies. Bootstrap values (>70) followed by posterior probabilities (>90) are included at the nodes of the topology produced by Maximum Likelihood. See text for additional details.

Phylogram for haplosporidians constructed using SSU sequences generated in this study (in bold) and GenBank sequences. The HKY + G substitution model for the Bayesian analysis and K80 + G model for the Maximum Likelihood analysis produced highly similar topologies. Posterior probabilities (>80) followed by bootstrap values (>60) are included at the nodes of the Bayesian topology. See text for additional details.
Total number of oyster species collected and processed for protistan parasites, with the percentage and total number of detections (in parentheses) of each Perkinsus species (A), and multiple genera (i.e. the number of individuals that were positive for at least one Perkinsus species and one haplosporidian), and haplosporidians (B), which is calculated as the per cent contribution of each parasite species per host to the total number of parasite detections per parasite species (column)

Prevalence values greater than zero are shown in bold.
Within the three regions of Panama, the richness of haplosporidians detected was higher than for the Perkinsus species; however, Perkinsus species were more frequently detected than haplosporidians (Fig. 4; ESM Tables S3 and S4). Comparing Perkinsus richness among regions, three species were detected in each of the three regions, though the species composition within regions was different (Fig. 2). For the haplosporidians, seven species were detected in the Pacific-Canal, while five species were detected in each of the other two regions (Fig. 3).
Map of locations sampled in three regions of Panama including (A) the Caribbean-Canal, (B) Bocas del Toro and (C) the Pacific-Canal. Each colour in the pie charts represents a presumptive parasite species detected in each location. The per cent shading of the pie graphs indicates the proportion of each parasite species or clade detected in each location. Samples sizes are in ESM Tables S3 and S4.

Overall, detection frequencies for Perkinsus species within regions were 3-fold higher along the Caribbean coast compared with the Pacific coast, ranging from 55·6% at Bocas del Toro to 45·1% at Caribbean-Canal, then decreasing to 17·5% at Pacific-Canal (ESM Table S3). On the other hand, detections for the haplosporidians were higher at the Canal regions compared with Bocas del Toro, with overall detection frequencies among all oysters screened ranging from only 9·7% at Bocas del Toro, to 27·4% at Caribbean-Canal and 22·6% at Pacific-Canal.
Examining species richness and detection frequency across locations, the richness of protistan parasites (combining Perkinsus spp. and haplosporidians) was highest at Bique Intertidal, where seven parasite species or clades were detected (Fig. 4). STRI Dock, the site with the highest diversity of potential hosts sampled, had the second highest richness of protistan parasites, with six species or clades detected. Oysters from Rio Alejandro and the STRI Dock had the highest detection frequencies. At Rio Alejandro, 39·4 and 67·0% of oysters screened were positive for haplosporidians or Perkinsus spp., respectively, and at STRI Dock 16·0 and 68·0% of oysters screened were positive for haplosporidians or Perkinsus spp., respectively (Fig. 4; ESM Tables S3 and S4).
Although less diverse, Perkinsus species tend to be more geographically widespread and more frequently detected than haplosporidians. Perkinsus spp. were detected in 43·5% (n = 327) of oysters screened, while haplosporidians were only detected in 18·1% (n = 136) (Fig. 3; ESM Table S4). Among all the protistan parasites, P. beiahaiensis was the species most frequently detected (27·5%, n = 207), followed by P. olseni (12·8%, n = 96), then haplosporidian Clade 6 (5·1%, n = 38) (Figs. 2 and 4). A number of haplosporidian clades were only detected a single time including Minchinia sp. B, Clade 1, and Clade 2 (Figs 3 and 4).
Parasite species appeared unevenly detected among host species. Examining the detection frequency by host association, P. beihaiensis was most frequently detected from Isognomon sp. (36·2%, n = 75) and C. rhizophorae (35·3%, n = 73) (Table 2A). Perkinsus olseni was most frequently detected from Isognomon sp. (35·4%, n = 34) and Isognomon alatus (27·1%, n = 26) (Table 2A). Perkinsus marinus was most frequently detected from C. rhizophorae (40·0%, n = 6) and P. chesapeaki was most frequently detected from the Caribbean Saccostrea sp. (77·8%, n = 7) (Table 2A). When examining detection per host species, Perkinsus spp. had extremely high detection frequencies from I. alatus (93·5%), Pinctada imbricata (80·6%) and Isognomon sp. (67·7%). Perkinsus spp. detections were lowest from S. prismatica (12·7%) and Crassostrea columbiensis (16·4%) (Table 2A).
The detection frequencies of haplosporidians were also variable among hosts. The majority of haplosporidian detections were from I. alatus (45·2% of all individuals from this species, n = 14), Saccostrea palmula (37·7%, n = 23), Saccostrea sp. (22·4%, n = 31) and Isognomon sp. (21·1%, n = 34) (Table 2B). Of the two most frequently detected clades, Clade 6 was most frequently detected from the Caribbean Saccostrea sp. (65·8%, n = 25) and C. rhizophorae (15·8%, n = 6) (Table 2B). Clade 5 was most frequently detected from Isognomon sp. (53·1%, n = 17) and I. alatus (43·8%, n = 14) (Table 2B). Two haplosporidian clades were detected multiple times but only from a single oyster species, including Minchinia sp. A., which was only detected from Isognomon sp., and Clade 8, which was only detected from S. prismatica (Table 2B).
As the same individual hosts were screened for both protistan taxa, we were able to determine instances where both protistan taxa (i.e. at least one Perkinsus spp. and one haplosporidian clade) were detected. Overall, we detected both protistan taxa from 9·3% (n = 70) of the oysters screened (Table 2A). The majority of multiple detections were observed along the Caribbean coast, with 15·5% in Caribbean-Canal, 8·6% in Bocas del Toro and only 2·8% in the Pacific-Canal. Within locations, the highest instances of multiple detections occurred at Rio Alejandro (22·3%) and Punta Caracol (11·3%) (Table 2A). When examining host associations, the highest instances of multiple detections occurred in Isognomon sp. (38·6%) and Saccostrea sp. (24·3%) (Table 2A).
DISCUSSION
We found several parasitic taxa, including a number of new species records, in Panamanian waters. We found three metazoan parasites and one micropredator, including two different pea crab species separated by the Panamanian isthmus with each capable of infecting multiple hosts. Additionally, molecular screening for protistan parasites revealed four Perkinsus species, making this study the first record of four co-occurring Perkinsus species, which are all new records for Panamanian waters. Three of the four species were observed in two of three regions, with the highest detection frequencies (45·1–55·6%) occurring in Caribbean regions. Finally, we found at least 12 genetically distinct haplosporidians, which likely represent 12 separate species. The majority of haplosporidians appear novel and all are new records for Panamanian waters. Seven of the 12 haplosporidian clades were isolated to a single region, with detections of haplosporidians highest (>20% detection) in the Canal regions.
Importantly, this study documents occurrence and association with particular host species but does not assess the nature of these associations, including whether the protistan parasite taxa are infecting the various hosts or are incidental associations. We currently lack knowledge about the ecology and effects of these parasites in Panama. Further research is needed to determine which bivalve species are hosts, how competent each host is for the parasite in question, the full life cycle of each parasite, effects on these and other bivalves and the dispersal potential of the transmissive stages.
Parasite richness
Our results support the prediction that many previously undetected parasites are present in Panamanian waters. Overall, our analysis revealed relatively high protistan parasite richness in tropical oysters from both Panamanian coasts compared with available data in temperate locations (Villalba et al. Reference Villalba, Reece, Camino Ordás, Casas and Figueras2004; Burreson and Ford, Reference Burreson and Ford2004; Moss et al. Reference Moss, Xiao, Dungan and Reece2008; Arzul and Carnegie, Reference Arzul and Carnegie2015). Previously, only three of the seven known Perkinsus species (P. marinus, P. beihaiensis, P. olseni) had been detected in tropical waters, with P. beihaiensis being the only one exclusively found in tropical waters (Villalba et al. Reference Villalba, Reece, Camino Ordás, Casas and Figueras2004; Moss et al. Reference Moss, Xiao, Dungan and Reece2008). Our findings support previous suggestions that the absence of records for Perkinsus in tropical waters is likely due to sampling bias, as the majority of studies have been in temperate regions, rather than due to a lack of occurrence (Villalba et al. Reference Villalba, Reece, Camino Ordás, Casas and Figueras2004; Moss et al. Reference Moss, Xiao, Dungan and Reece2008); however, these differences may also be due to methodological differences between studies conducted in temperate and tropical regions. Finally, we note that our analysis provides a minimum estimate of tropical parasite diversity. The relatively small sample sizes of hosts that were screened for metazoan parasites, which had low prevalence values, could lead to an underestimation of the prevalence and richness of metazoan parasites in these waters.
Unfortunately, the level of taxonomic resolution currently available to determine Perkinsus species does not exist for all haplosporidians. While there are >30 described species of haplosporidians, many have only been observed a single time and location (Burreson and Ford, Reference Burreson and Ford2004; Arzul and Carnegie, Reference Arzul and Carnegie2015). Recent work demonstrated a high level of previously unknown diversity within the haplosporidians, comprised of a number of clades that likely represent novel species (Hartikainen et al. Reference Hartikainen, Ashford, Berney, Okamura, Feist, Baker-Austin, Stentiford and Bass2014). Additionally, our approach likely underestimated the haplosporidian species, as it is possible that multiple species were lumped into a single clade due to the small gene fragment used. Thus, we consider our results to be a conservative estimate of haplosporidian richness, which still demonstrated a relatively high richness in Panamanian waters compared with temperate locations (Burreson and Ford, Reference Burreson and Ford2004; Arzul and Carnegie, Reference Arzul and Carnegie2015).
Regional comparisons of richness
While we expected to find substantial parasite species overlap between the Canal sites, due to the high degree of shipping traffic through the Canal and possible homogenization of parasite assemblages on Atlantic and Pacific sides, this was not the observed pattern. Instead, the patterns differed greatly depending on the organisms in question, with some parasites isolated to one ocean (e.g. pea crabs, U. cyprinae), one was spread across all regions (P. beihaiensis), and still others with more disjunct patterns between locations and regions (P. chesapeaki). When examining parasites across regions, more regional overlap was observed for protistan parasites compared with metazoan parasites. For example, only one metazoan (Z. ostreum) was shared across regions, while four protistan parasites occurred in both the Pacific-Canal and Caribbean-Canal regions (Fig. 4). Four protistan species were found between both Caribbean regions, two were shared between the Pacific-Canal and Caribbean, and seven were only detected in a single region. These results likely indicate a complex combination of factors influencing the biogeographic patterns, including the anthropogenic spread of some protistan parasites, which are able to survive and likely establish in each region and either a lack of spread or inability to survive in the different regions for other species.
There are many potential factors that could contribute to the establishment of parasites in the different regions. First, host density and diversity are positively correlated with overall parasite species richness (Poulin, Reference Poulin2004; Lindenfors et al. Reference Lindenfors, Nunn, Jones, Cunningham, Sechrest and Gittleman2007), so the availability of competent hosts could influence parasite distributions. Though we do not know of any published surveys comparing the distribution and abundance of oysters in the families Ostreidae, Isognomonidae, or Pteriidae in Panamanian waters, our sampling efforts, which were directed towards the most abundant species on both coasts, recorded ten species, including two new records (Saccostrea sp. and Isognomon sp.; Pagenkopp Lohan et al. Reference Pagenkopp Lohan, Hill-Spanik, Torchin, Strong, Fleischer and Ruiz2015). Higher host richness was observed on the Caribbean side, but the density of species within locations was generally higher on the Pacific side (Pagenkopp Lohan and Hill-Spanik, personal observation). Additional sampling to determine the density and diversity of potential hosts and confirmation of infection for each host is required to assess this hypothesis.
Second, host specificity is an important factor in determining parasite distributions. Previous research has shown that specialist species are more common in tropical latitudes (Krasnov et al. Reference Krasnov, Shenbrot, Khokhlova, Mouillot and Poulin2008; Poulin et al. Reference Poulin, Krasnov, Mouillot and Thieltges2011). Additionally, parasites with low host specificity are more likely to host-switch (Holt et al. Reference Holt, Dobson, Begon, Bowers and Schauber2003), be successful invaders (Taraschewski, Reference Taraschewski2006) and be more geographically widespread (Krasnov et al. Reference Krasnov, Poulin, Shenbrot, Mouillot and Khokhlova2005). Thus, we may expect higher species richness in the tropics due to a high degree of parasite specialization accompanying high host diversity. Alternatively, given the shipping volume into the Panama Canal, we may expect a high diversity of generalist parasites as, after anthropogenic activities concentrated them in that area, they would be more apt to find a competent host in order to establish and survive.
For the metazoans, all three parasite species are known host generalists. Urastoma cyprinae is known to infect the largest number of hosts in at least five countries (Fleming et al. Reference Fleming, Michael, Bacon, Schockaert and Ball1981; Goggin and Cannon, Reference Goggin and Cannon1989; Murina and Solonchenko, Reference Murina, Solonchenko, Schockaert and Ball1991; Cáceres-Martínez et al. Reference Cáceres-Martínez, Vásquez-Yeomans and Sluys1998; Canestri Trotti et al. Reference Canestri Trotti, Baccarani, Gianetto, Giuffrida and Paesanti1998; Aguirre-Macedo et al. Reference Aguirre-Macedo, Simá-Álvarez, Román-Magan and Güemez-Ricalde2007), while the two pea crabs species are comparatively more host specific and geographically isolated (Campos, Reference Campos2002; Manning, Reference Manning1993). These broader observations match the results of this study, with U. cyprinae infecting more hosts than the two pea crab species.
Based on the current literature, Perkinsus species appear to be less host specific and more widespread in general. Including the results from this study, P. olseni is currently the least host specific of the Perkinsus species, as it has been detected in 17 countries from 27 host species representing five Orders and six Families (Villalba et al. Reference Villalba, Reece, Camino Ordás, Casas and Figueras2004). Including this study, P. marinus has been detected in four countries from 16 host species representing three Orders and five Families (Villalba et al. Reference Villalba, Reece, Camino Ordás, Casas and Figueras2004; Reece et al. Reference Reece, Dungan and Burreson2008). Including this study, P. chesapeaki has been detected in five countries from 14 host species representing four Orders and eight Families (Villalba et al. Reference Villalba, Reece, Camino Ordás, Casas and Figueras2004; Dang et al. Reference Dang, Dungan, Scott and Reece2015). Finally, including the results of this study, P. beihaiensis has been detected in four countries from 13 species, over half of which are from this study alone, representing three Orders and three Families (Moss et al. Reference Moss, Xiao, Dungan and Reece2008; da Silva et al. Reference da Silva, Scardua, Vianna, Mendonca, Vieira, Dungan, Scott and Reece2014). While we did not confirm infection status of the oysters, we expected P. olseni to be detected from the most host species, based on the low specificity and global distribution from previous studies. To the contrary, we found that P. beihaiensis was detected from the greatest number of hosts.
Unfortunately, determining any information about the host specificity of the haplosporidians is presently impossible, as most could not be identified to species level. The only species we could identify, H. costale, has been previously detected in three countries from five species, all from the family Ostreidae (Wood and Andrews, Reference Wood and Andrews1962; Wang et al. Reference Wang, Lu, Liang and Wang2010). Our data add another three potential ostreid hosts. With the extremely limited information about hosts and geographic range for these species, it appears that many are host specialists and geographically isolated (Burreson and Ford, Reference Burreson and Ford2004; Arzul and Carnegie, Reference Arzul and Carnegie2015).
The difference in host specificity between Perkinsus and haplosporidian species appears to be an important factor determining their diversity and distributions. The lack of specificity among the Perkinsus species may be the reason that these species were the most geographically widespread and most frequently detected throughout Panamanian waters. The high specificity of the haplosporidians may explain why they were more diverse, but less widespread and detected at lower frequencies.
In conclusion, though mass mortalities are the most conspicuous impact of parasites, they can have additional community/ecosystem wide impacts that are no less profound, such as changing species compositions and interactions (e.g. competition, predation) (Prenter et al. Reference Prenter, MacNeil, Dick and Dunn2004). The high parasite diversity found in Panamanian waters, which includes many new records for these waters, emphasizes our lack of knowledge regarding the diversity, abundance and effects of parasites in tropical waters. Characterizing the diversity and distribution of host generalist parasites, in particular, around major shipping corridors and hubs such as the Panama Canal is crucial, given the potential for these pathogens to be globally dispersed through shipping. Additionally, the variation observed in parasite distributions suggests other mechanisms are influencing parasite dispersal and establishment. While anthropogenic dispersal is occurring, multiple factors (e.g. host specificity, host distribution) are contributing to the observed biogeographic patterns and heterogeneity of parasite assemblages between regions.
ACKNOWLEDGEMENTS
We thank Gabriel Jacome and Plinio Gondola at the Smithsonian Bocas del Toro Marine Station for assistance and discussions on local bivalve species. We thank Drs Ryan Carnegie and Kimberly Reece for contributing positive control material for screening for the protistan parasites. Dr Carmen Schlöder assisted with field collections and obtaining permits. Dr Mark Minton assisted with the creation of maps in ArcGIS. We thank Emma Palacios Theil for sharing her data and identifying the pea crab species. We thank Drs David Bass and Kimberly Reece for reviewing the phylogenetic analyses for the haplosporidians and Perkinsus species, respectively. Nancy Rotzel McInerney provided laboratory logistical support at CCEG.
FINANCIAL SUPPORT
This project was supported with Smithsonian Institution Grand Challenges Award from the Consortium for Understanding and Sustaining a Biodiverse Planet and Hunterdon funds to GMR. A Smithsonian Institution MarineGEO Postdoctoral Fellowship funded KM Pagenkopp Lohan. Funding for E. Palacios Theil and D. Felder was from NSF/BS&I DEB-0315995, NSF AToL EF-0531603, and NSF/RAPID DEB 1045690. This is contribution number 7 from the Smithsonian's Tennenbaum Marine Observatories Network.
SUPPLEMENTARY MATERIAL
To view supplementary material for this article, please visit http://dx.doi.org/10.1017/S0031182015001900



