Introduction
The use of positron emission tomography computed tomography (PET-CT) as a non-invasive diagnostic scanning technique has the advantage of combining functional imaging with anatomical localisation. Although it has higher sensitivity, specificity and accuracy than CT, PET or magnetic resonance imaging alone, false negative and false positive results still continue to be the major problem for detecting and staging nodal metastases in head and neck carcinoma. A variety of factors may influence the PET-CT fluorodeoxyglucose (FDG) standardised uptake value of the target tissue, including necrosis, infection, radiotherapy and recent surgical intervention. Thus, false positive and false negative results may arise. The standardised uptake value is a semi-quantitative measurement of tumour uptake of FDG, derived by measuring the ratio of tumour radioactivity to expected target tissue baseline radioactivity. Relatively higher concentrations of FDG are expected to accumulate in malignant tumours, compared with normal tissues, due to increased metabolic activity. The standardised uptake value threshold suggestive of malignancy is 2.5.
The specificity, sensitivity and overall accuracy of PET-CT for the detection of primary and metastatic disease have been widely studied. However, little attention has been paid to the impact of clinicopathological factors on PET-CT FDG standardised uptake values in head and neck tumours. It is well-known that poor prognosis is related to factors such as higher tumour stage, poor differentiation, and perineural and extracapsular spread in metastatic nodes. Similarly, a higher standardised uptake value has been shown to be a poor prognostic factor for head and neck cancer.Reference Torizuka, Tanizaki, Kanno, Futatsubashi, Naitou and Ueda1–Reference Allal, Dulguerov, Allaoua, Haenggeli, El-Ghazi el and Lehmann4 However, there has not been adequate investigation of the pathological and biological mechanisms underlying the close correlation between the standardised uptake value of the target tissue and the clinicopathological factors linked to poor prognosis. Therefore, the present study aimed to evaluate whether the PET-CT FDG standardised uptake value correlated with clinicopathological features of head and neck tumours, given that both factors are known to be associated with the survival of head and neck cancer patients.
Materials and methods
The study received approval from the Ohio State University Institutional Review Board.
Subsequently, we identified 243 previously untreated head and neck cancer patients who had undergone PET-CT evaluation and diagnostic or therapeutic neck dissection, and who had received a diagnosis of oral cavity carcinoma, laryngopharyngeal carcinoma or carcinoma of unknown primary between 1 January 2005 and 12 December 2007 at the otolaryngology-head and neck surgery department of the Arthur G James Cancer Hospital and Richard J Solove Research Institute of the Ohio State University Medical Center. All 243 identified patients were included in the study. Electronic medical records for each of these patients, including detailed clinical, pathological and operative reports, were retrospectively reviewed and analysed. Patients with nasopharyngeal primaries were excluded from the study.
All patients with primary site carcinoma, except those with carcinoma of an unknown primary, were treated with surgical resection followed by unilateral or bilateral neck dissection, performed by three senior surgeons. All histopathological examinations were performed by three senior pathologists. Histopathological analysis included: tumour stage, grade, size and depth of infiltration; size of the largest lymph node; number of positive lymph nodes; extracapsular spread; and lymphatic and perineural invasion. We assessed the correlation between the PET-CT FDG standardised uptake value and the above-mentioned clinicopathological factors. The effect of primary tumour location on standardised uptake value was also examined, excluding patients with carcinoma of unknown primary.
Statistical analysis
The R statistical analysis package was used for statistical analysis. The Student t-test and one-way analysis of variance tests were used to calculate statistical significances for single dependent variables. A general linear model was used to test linear combinations of multiple dependent variables. Any p value of less than 0.05 was accepted as significant at the 95 per cent confidence level.
Results
Eighty-nine of the 243 patients (36.6 per cent) had primary carcinoma of the oral cavity; others had primary carcinoma of the oropharynx (33.7 per cent), larynx (18.5 per cent) or hypopharynx (3.7 per cent), while 7.4 per cent had an unknown primary (Figure 1). After excluding the 18 patients with carcinoma of unknown primary, the distribution of pathological tumour (T) stage was: 36 patients with T1 carcinoma (16 per cent); 78 with T2 (35 per cent), 59 with T3 (26 per cent) and 52 with T4 (23 per cent).
Bar chart showing distribution of primary sites. CUP = cancer of unknown primary

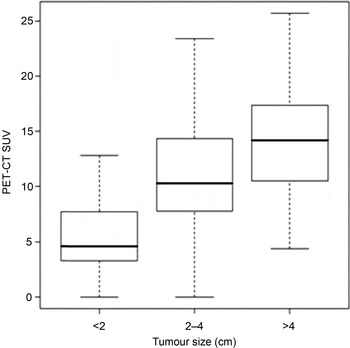
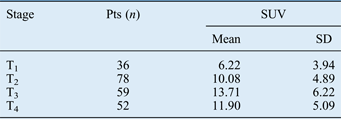
The patients' pathological T stage and corresponding mean standardised uptake value distributions are indicated in Figure 2. Tumour stage was found to have a significant association with standardised uptake value (p < 0.0001). The mean standardised uptake value of T1 tumours was significantly lower than that of T2, T3 and T4 tumours (p < 0.001). The mean standardised uptake value of T2 tumours was also significantly lower than that of T3 and T4 tumours (p < 0.003) (Table I).
Box plot showing primary tumour positron emission tomography computed tomography standardised uptake values (PET-CT SUV) according to tumour size, indicating pathological tumour stage (p < 0.0001). (Note that tumour (T) stage depends solely on tumour size: sizes of <2, 2–4 and >4 cm exactly define T1, T2 and T3–4, respectively). Boxes represent first and third quartiles and medians; whiskers represent 95 per cent confidence intervals.

Standardised uptake value by pathological tumour stage
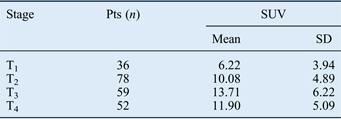
Pts = patients; SUV = standardised uptake value; SD = standard deviation; T = tumour stage
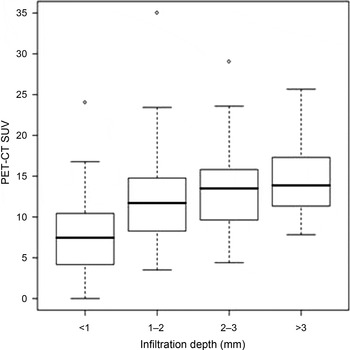
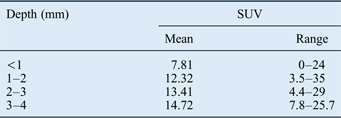
The depth of infiltration of the primary tumour was also significantly associated with the standardised uptake value (Figure 3). Table II shows the distribution of mean standardised uptake values according to depth of tumour infiltration. Tumours with an infiltration depth of 1 mm or less had a significantly smaller mean standardised uptake value than more deeply infiltrating tumours (p < 0.0001).
Box plot showing primary tumour positron emission tomography computed tomography standardised uptake values (PET-CT SUV) according to depth of tumour infiltration (p < 0.0001). Boxes represent first and third quartiles and medians; whiskers represent 95 per cent confidence intervals; higher plot points represent outliers.

Standardised uptake value by tumour infiltration depth
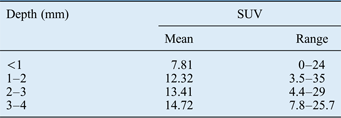
SUV = standardised uptake value
In addition, we observed a significant positive correlation between the standardised uptake value and the size of the largest metastatic lymph node (Figure 4), the presence or absence of lymph node metastases (Figure 5), and the presence or absence of extracapsular spread (Figure 6) (p < 0.0001). The presence of perineural invasion (p = 0.013) and lymphatic invasion (p = 0.0093) were also associated with higher standardised uptake values, compared with tumours lacking these features. Standardised uptake value was not affected by tumour grade.
Box plot showing nodal positron emission tomography computed tomography standardised uptake values (PET-CT SUV) according to the size of the largest lymph node (p < 0.0001). Boxes, whiskers and plot points as per Figure 3 legend. N = node stage

Box plot showing nodal positron emission tomography computed tomography standardised uptake values (PET-CT SUV) according to the presence or absence of lymph node metastases (p < 0.0001). Boxes, whiskers and plot points as per Figure 3 legend. N = node stage

Box plot showing nodal positron emission tomography computed tomography standardised uptake values (PET-CT SUV) according to the presence or absence of extracapsular spread (p < 0.0001). Boxes, whiskers and plot points as per Figure 3 legend.

The combined effect of all of the above factors on standardised uptake value was tested using a general linear model. Tumour size (p < 0.0001) and lymphatic invasion (p = 0.004) had the most significant effects.
Discussion
Malignant tumours are characterised by increased glucose metabolism when compared with healthy cells.Reference Warburg5 The PET-CT fluorodeoxyglucose (FDG) standardised uptake value clinically predicts the prognosis of patients with various primary tumours, including head and neck tumours.Reference Kato, Kuwano, Nakajima, Miyazaki, Yoshikawa and Ojima6–Reference Vansteenkiste, Stroobants, Dupont, De Leyn, Verbeken and Deneffe9 This association of increased standardised uptake value with poor prognosis may be due to cellular and clinicomorphological features of the tumour. Fluorodeoxyglucose uptake has been shown to correlate with cell viability and proliferative activity.Reference Haberkorn, Strauss, Reisser, Haag, Dimitrakopoulou and Ziegler10, Reference Minn, Clavo, Grenman and Wahl11 Fluorodeoxyglucose uptake is greater in fast-growing tumours than slow-growing ones.Reference Kubota12
In the present study, tumour size and depth of invasion correlated with PET-CT FDG standardised uptake value. As tumour size and invasion depth are the components determining T stage, we would expect T stage to correlate with standardised uptake value. As expected, in the current study head and neck cancers of more advanced T stage demonstrated higher standardised uptake values. This is consistent with previous reports that primary tumour size and invasion depth correlate with standardised uptake value in oesophagealReference Feng, Li, Kong, Shi, Yang and Yu13 and oral cavity carcinoma.Reference Liao, Wang, Chang, Lin, Ng and Huang14 Thus, our own and previous authors' findings demonstrate that the PET-CT FDG standardised uptake value of tumours closely correlates with both tumour size and depth of invasion. Tumours with higher standardised uptake values have greater tumour mass and invasiveness.
The present study also found that standardised uptake value was significantly associated with tumour lymphatic invasion. This may be related to the above-mentioned tendency of tumours with more aggressive biological characteristics to display higher standardised uptake values. Higashi et al. Reference Higashi, Ito, Hiramatsu, Ishikawa, Sakuma and Matsunari15 reported that the incidence of lymphatic invasion and lymph node metastasis in non-small cell lung cancer was significantly associated with Reference Celen, Zincirkeser and Dirier18F-FDG uptake; they concluded that Reference Celen, Zincirkeser and Dirier18F-FDG uptake by the primary tumour was a strong predictor of lymphatic vessel invasion and lymph node metastasis.
The number of metastatic nodes was found to correlate well with the primary tumour PET-CT FDG standardised uptake value in the current study. This relationship has also been demonstrated by several studies investigating primary sites other than the head and neck, including lungReference Nambu, Kato, Sato, Okuwaki, Nishikawa and Saito16, Reference Maeda, Isowa, Onuma, Miura, Harada and Touge17 cervixReference Celen, Zincirkeser and Dirier18 and oesophagus.Reference Feng, Li, Kong, Shi, Yang and Yu13 It is already very well-known that tumours with more advanced T stages are more prone to develop lymphatic metastases. This, indirectly, refers to poor prognosis. However, in the present study the mean standardised uptake value did not differ significantly in patients with the same T stage but different nodal status.
• This study assessed positron emission tomography computed tomography fluorodeoxyglucose standardised uptake values in head and neck cancer patients
• Increased values correlated with tumour stage, infiltration depth, perineural and lymphatic invasion, lymph node size, node positivity and extracapsular spread
We did not find any correlation between histological tumour grade and standardised uptake value. Histological grade could be expected to correlate with standardised uptake value, since poorly differentiated tumours are predisposed to increased FDG uptake. Similar to the present study, Suzuki et al. Reference Suzuki, Nishioka, Homma, Tsuchiya, Yasuda and Aoyama19 reported that neither histological grading nor mitotic or apoptotic status correlated with standardised uptake value in patients with head and neck carcinoma. Feng et al. Reference Feng, Li, Kong, Shi, Yang and Yu13 reported that poorly differentiated tumours exhibited higher standardised uptake values than well differentiated tumours in patients with oesophageal carcinoma. However, this study had a relatively small sample size compared with the present study. Kidd et al. Reference Kidd, Spencer, Huettner, Siegel, Dehdashti and Rader20 reported that cervical tumour FDG uptake varied with tumour histology and differentiation: squamous cell tumours demonstrated significantly higher standardised uptake values than non-squamous cell tumours, and poorly differentiated tumours also had higher standardised uptake values.