Nanoscale characterization of complex properties in energy materials and devices
Many strategies for energy generation, storage, and efficiency exploit complex properties of materials. Ionic transport and electrochemical reactions dictate the behavior of many electrochemical devices, including solid oxide and polymer electrolyte fuel cellsReference O’Hayre, Cha, Colella and Prinz1 and Li-ion batteries.Reference Nazri and Pistoia2 Ionic phenomena are equally important in other functional materials and devices, including electroresistive and memristive electronic devices,Reference Sawa3, Reference Strukov, Snider, Stewart and Williams4 molecular electronic devices,Reference Joachim, Gimzewski and Aviram5 piezoresistance,Reference He and Yang6 and ferroelectric resistive switching.Reference Nonnenmann, Gallo and Spanier7 An important class of these complex properties is based on polarization, represented by the dielectric constant, κ. Dielectric polarization is inherent in the interaction of light with solids, the motion of ions in ionic materials, electrical charges trapped at interfaces, and dipoles in organic compounds and biomolecules. Progress in these applications requires probing complex properties at the nanoscale, establishing the origins of physical behavior, and linking a macroscopic device or material functionality with advanced theoretical studies. Scanning probe microscopy (SPM) has become one of the primary tools to interrogate the local properties of a variety of materials at the nanoscale. Recently, the extension of SPM to probe local ionic and electronic transport, dielectric, optical, ferroelectric, and magnetic properties have made the technique a more powerful platform to examine the complex behavior of functional surfaces and interfaces at the nanoscale. A number of these SPM techniques are discussed in this issue. This article focuses on the acquisition of nanoscale impedance information using an atomic force microscope (AFM). AFM-based impedance spectroscopy provides localized impedance information for electrical, electrochemical, and dielectric phenomena at the nanoscale by utilizing the conductive AFM tip as a moving electrode to detect current response as a function of time and frequency under controlled environments. In this article, we summarize the principles of AFM-based impedance measurement and review recent examples applying this technique to a variety of functional materials systems, including fuel cells, Li-ion batteries, photoactive biomembranes, polymeric coatings, and semiconducting oxides.
Fundamental principles of impedance
Impedance (Z) is a measure of a system’s ability to impede the flow of electrical current, providing an extension of electrical resistance to time or frequency dependent phenomena. Impedance is defined as the ratio between an applied sinusoidal voltage perturbation, V(t) = V 0ei ωt, and a system’s resultant current response, I(t) = I 0ei ωt, where V(t) and I(t) are the potential and current at time t, V 0 and I 0 are the amplitudes of the voltage and current signals, and ω is the radial frequency. Laplace transformations of V and I from the time domain to the frequency domain,  and
 , yield Z as a function of frequency ω:

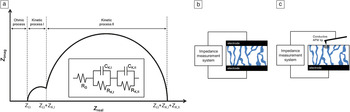
By measuring a system’s impedance over a range of frequencies, an impedance spectrum can be constructed. The frequency-resolved modulus (Z 0, the amplitude of impedance) and phase (φ, the angular lag between applied voltage and resulting current) obtained from an impedance spectroscopy measurement allows characteristic relaxation times of a system to be identified. These relaxation times can be associated with various physicochemical processes, including ionic transport, charge transfer, and diffusion.Reference O’Hayre, Lee, Prinz, Kalinin, Kalinin and Gruverman8, Reference Shao, Kalinin and Bonnell9Figure 1a schematically illustrates a typical impedance spectrum (presented in the Nyquist format), which shows several characteristic semicircular arcs, each of which can often be related to distinct physical phenomena within the material or system being studied.
Atomic force microscopy (AFM)-based impedance measurements. (a) Schematic example of a typical impedance spectrum. This impedance spectrum shows two distinct semicircular arcs, each of which can often be correlated to specific physical phenomena (such as an electrochemical reaction) or microstructural features (such as interfaces or grain boundaries) in the material. The inset shows the equivalent circuit of the impedance spectrum. Comparison of a (b) two-electrode impedance measurement and (c) AFM-based impedance measurement. Impedance is measured between a local probe (the AFM tip) and a bulk electrode. A significant spreading resistance at the AFM tip-sample contact point ensures local characterization, as shown by the hemispherical lines. Z imag and Z real are the imaginary and real components, respectively, of the impedance of a system. Z Ω, Z K,I, and Z K,II are the impedances associated with the ohmic process, kinetic process I, and kinetic process II, respectively. RΩ, RK,I, RK,II, CΩ, CK,I, and CK,II are the resistors and capacitors associated with the ohmic process, kinetic process I, and kinetic process II in the equivalent circuit, respectively.

In typical impedance measurements, a sinusoidal voltage perturbation is applied across a sample of interest through two contacting electrodes, and the resulting sinusoidal current response is measured (Figure 1b). Because conventional measurements utilize bulk electrodes, the technique produces bulk, or system-averaged, results. As this article will illustrate, due to the rapid development of scanned-probe techniques, it is now possible to combine the capabilities of AFM with impedance measurement to acquire spatially resolved impedance measurements (Figure 1c).
Localized impedance measurements
In a manner entirely analogous to macroscopic impedance measurements, AFM-based impedance measurements can be performed in two ways. The AFM tip can be used as a microscopic analog of a macroscopic current probe. This approach is referred to as a contact AFM impedance measurement (or nanoimpedance microscopy).Reference O’Hayre, Lee and Prinz10 In this case, a conventional force detection mechanism is used to trace surface topography, and current detection is used for the impedance measurements. Alternatively, the AFM tip can be employed as a moving voltage probe using electrostatic force detection in a non-contact mode (scanning impedance spectroscopy).Reference Kalinin and Bonnell11, Reference Shao and Bonnell12 In this case, the contribution of the tip-surface contact resistance to impedance measurements is minimized. In both cases, the properties can be represented as point spectra or as images because nanoimpedance microscopy is capable of mapping impedance in two dimensions with sub-100 nm resolution. This impressive capability comes with some challenges: speed limitations in acquiring spectra at each pixel and uncertainties in tip-sample contact area.Reference O’Hayre, Lee and Prinz10, Reference O’Hayre, Feng, Nix and Prinz13 Nevertheless, in important cases, results can be interpreted to yield meaningful, semi-quantitative information.
Application examples to energy-related materials and devices
Fuel cells
O’Hayre et al.Reference O’Hayre, Lee and Prinz10, Reference O’Hayre, Feng, Nix and Prinz13 applied AFM impedance imaging to a Nafion membrane to distinguish hydrophobic versus ionically active domains with a spatial resolution <100 nm. Nafion is a widely used polymeric fuel cell electrolyte; its macroscopic conduction properties depend crucially on the nanoscale distribution of hydrophilic ion-conducting channels within a hydrophobic matrix. Applying a dc bias to the platinum-coated AFM tip causes a Faradaic charge transfer reaction to occur, with protons from the membrane combining with oxygen from the air to produce water. Essentially, the Pt-coated AFM tip, in contact with the electrolyte membrane, becomes a tiny and moveable fuel cell cathode. Translation of the AFM tip across the surface of the electrolyte membrane permits spatially resolved electrochemical impedance images to be acquired by probing the Faradaic charge transfer reaction.
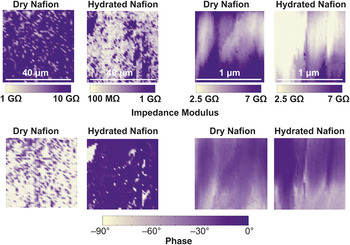
Figure 2 shows sets of fixed-frequency AFM impedance images of a Nafion electrolyte membrane.Reference O’Hayre, Lee and Prinz10 The images compare the impedance response from a dry membrane versus the same area of the same membrane when hydrated. The hydration level of the Nafion electrolyte significantly influences its solvated proton (H3O+·nH2O) concentration and conductivity. This is readily apparent from the AFM impedance images, which show a dramatic change in the impedance response. Furthermore, the Nafion impedance images in Figure 2 identify hydrophilic (brighter contrast) and hydrophobic (darker contrast) regions of several hundred nanometers. These results show an overall decrease in impedance and an expansion of the low-impedance domains with increasing hydration, consistent with current knowledge on the behavior of Nafion.
Impedance modulus (top row) and impedance phase (bottom row) images of a Nafion electrolyte membrane. The image sets on the left compare the impedance response under dry (0% relative humidity) versus ambient (30% relative humidity) conditions for a 40 × 40 μm2 area of the Nafion membrane. The image sets on the right compare the impedance response under dry versus ambient humidity conditions for a 1 × 1 μm2 area of the Nafion membrane. Images were acquired at 1 Hz with a 30 mV excitation signal and 0.4 V cathodic bias. The hydration level of the Nafion electrolyte significantly influences its H3O+ concentration and ionic conductivity, as is readily apparent from the impedance images. The distortion apparent in the 1 μm2 images, likely due to drift and tip-water meniscus formation, underscores the limitations of the technique. Reprinted with permission from Reference Reference O’Hayre, Lee and Prinz10. ©2004, American Institute of Physics.

As the technique has matured, several other groups have applied it to investigate the proton conductivity of Nafion membranes at even higher spatial resolution using ac impedance as well as dc current mapping.Reference Bussian, O’Dea, Metiu and Buratto14–Reference Kwon, Wu and Zhu20 Bussian et al.Reference Bussian, O’Dea, Metiu and Buratto14 reported that a large fraction of conducting channels in a typical Nafion membrane are inactive due to limited connectivity of hydrophilic domains and catalyst accessibility. Aleksandrova et al.Reference Aleksandrova, Hiesgen, Friedrich and Roduner15 found that a large fraction of the channel ports conducted the same number of protons per unit of time, suggesting the existence of an optimum pore size and structure for efficient connectivity of the ion channel network. In follow-up work,Reference Aleksandrova, Hink, Hiesgen and Roduner16 they investigated the connectivity of the hydrophilic paths and their dynamic behavior using time-resolved conductivity mapping. Xie et al.Reference Xie, Kwon, Zhu, Nguyen and Lin17 and Kang et al.Reference Kang, Kwon, Xie and Zhu18 found that the local ionic conduction distribution followed a Gaussian function, with both the peak and half width increasing exponentially with relative humidity. Kwon et al.Reference Kwon, Kang, Wu and Zhu19, Reference Kwon, Wu and Zhu20 reported significant microscopic changes in the ionic channel networks during aging studies, suggesting reorientation of ionic channels near the membrane surface. He et al.Reference He, Kusoglu, Lucas, Clark, Weber and Kostecki21 found a correlation between the fractional conducting area and the observed interfacial mass transport resistance, an important link to help understand transport properties in the membrane for water management and fuel cell performance.
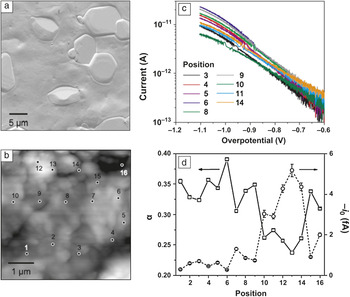
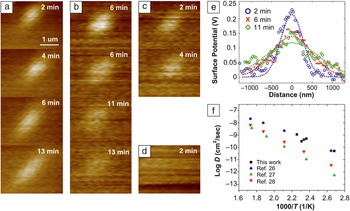
Insights into and applications of AFM impedance spectroscopy can be further enhanced by extending measurements to controlled environments, especially at elevated temperatures. Vels Hansen et al.Reference Vels Hansen, Jacobsen, Nørgaard, Ohmer and Mogensena22 and Wu et al.Reference Wu, Vels Hansen, Jacobsen and Mogensen23 obtained topography images, conductivity images, and impedance spectra on Au microelectrodes deposited on yttria-stabilized zirconia (YSZ) from room temperature to 650°C. Louie et al.Reference Louie, Hightower and Haile24 carried out a quantitative analysis of oxygen reduction kinetics at nanoscale Pt/CsHSO4 interfaces at 150°C in humidified air using AFM-based impedance and cyclic voltammetry. Using this approach, oxygen reduction at Pt/CsHSO4 interfaces was investigated without spatial averaging effects, allowing for the separation of multiple processes that would be convoluted in conventional macroscale measurements (Figure 3). The current-voltage characteristics of the Pt/CsHSO4 interface measured at various points across the electrolyte surface revealed a variation of the oxygen reduction kinetics with position. Exchange coefficients for charge transfer ranging from 0.1 to 0.6 and exchange currents spanning five orders of magnitude were extracted. A substantial variation of these parameters with position reveals the nanoscale heterogeneity on the surface and its impact on the electrochemical reaction rates in the Pt/CsHSO4 system. Furthermore, the clear correlation across independent sets of measurements substantiates the suitability of conducting AFM approaches for comprehensive study of electrochemical reactions at electrolyte-electrode interfaces. Lee et al.Reference Lee, Lee, Kim and Prinz25 have employed AFM-based impedance to study oxygen reduction and oxidation kinetics as a function of temperature and time (Figure 4). Highly localized charge transfer reactions at the tip/sample interface provided the ability to perturb the local ionic distribution. The resulting dynamic behavior was investigated in situ by time-resolved measurements with spatial selectivity to explore the charge transfer rate, or diffusivity, on solid oxide surfaces, which is a key factor determining the performance of electrochemical devices. From the relaxation of bias-induced surface charges (oxide ion vacancies), the diffusivity and activation energy were acquired for diffusion on the electrolyte surface, which is not accessible with other techniques. The previous examples demonstrate how AFM-based impedance enables comprehensive and semi-quantitative studies of electrochemical reactions at nanoscale interfaces.
Localized ac impedance spectroscopy for oxygen reduction kinetics in the Pt/CsHSO4 system. (a) Scanning electron micrograph of a typical CsHSO4 surface acquired after electrochemical testing. (b) Topography scan of the polycrystalline CsHSO4 surface collected at ∼150°C in humidified air (∼0.03 atm H2O). Labels denote nominal positions at which electrochemical measurements were acquired. (c) Semilog plot of cyclic voltammograms (cathodic branch) for Pt/CsHSO4 at select points across the surface shown in (b). Data were acquired with a 25 mV/s scan rate at ∼150°C in humidified air with ∼0.03 atm H2O. (d) Exchange coefficient, α, and exchange current, i 0, plotted as functions of position. Parameters were extracted from fitting the linear regime of each curve in (a) to the Tafel equation. In some instances, the error bars for α are smaller than the data markers. Substantial spatial variations in oxygen reduction kinetics, represented by the exchange coefficient, α, and exchange current, i 0, show the impact of nanoscale surface features of the polycrystalline electrolyte on the electrochemical reaction rates in the Pt/CsHSO4 system. Reprinted with permission from Reference Reference Louie, Hightower and Haile24. ©2010, American Chemical Society.

Sequential surface potential maps after a positive bias application (+3 V) in air at (a) 100°C, (b) 150°C, (c) 170°C, and (d) 200°C. The dissipation rate of the features increases with the temperature. Below 100°C, the features remain almost intact, even after 20 min. (e) Profiles across the peak surface potential and Gaussian fittings for 150°C show lateral spreading. (f) Arrhenius plot of log D versus 1000/T, where D is the diffusivity and T is the temperature. Time-resolved measurements at elevated temperatures with spatial information provide a method of exploring the charge transfer rate, or diffusivity, on solid oxide surfaces. Data from References Reference Huang, Gür, Saito and Prinz26–Reference Wang, Kobayashi, Dokiya and Hashimoto28 were replotted for comparisons after conversion into diffusivity. Reprinted with permission from Reference Reference Lee, Lee, Kim and Prinz25. ©2009, IOP Publishing Ltd.

Li-ion batteries
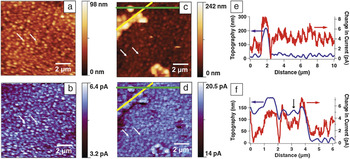
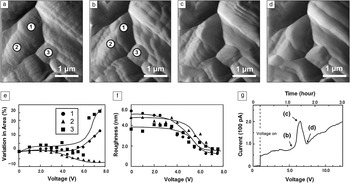
A conductive AFM tip shows great promise as a microelectrode for the realization and study of submicron-sized batteries. Vullum et al.Reference Vullum and Teeters29, Reference Vullum, Teeters, Nytén and Thomas30 used conductive AFM to demonstrate the potential of V2O5 gel immobilized in a porous (∼200 nm pores size) anodic alumina membrane as a novel cathode material with enhanced capacity. Conductive AFM tips have also been used as in situ microelectrodes to observe the dynamic behavior of Li+ ions during charge/discharge operations as well as to monitor the changes in surface morphology. Several groupsReference Bayet, Huet, Keddam, Ogle and Takenouti31–Reference Layson, Gadad and Teeters33 have applied AFM impedance techniques to investigate the local ionic conductivity in polymer electrolyte films consisting of Li triflate dissolved in poly(ethylene) oxide films (Figure 5). By extracting impedance measurements at the nanoscale, regions of high and low ionic conductivity could be clearly differentiated. Kushima et al.Reference Kushida and Kuriyama34 reported that a thin-film Al battery electrode expanded by ∼30 nm during the charging operation, and its surface showed cyclic changes from scaly to wrinkled structures during charge/discharge operations. This cyclic expansion/contraction behavior, attributed to the reversible intercalation of Li+, was also observed in TiO2 thin-film electrodes,Reference Zhu, Feng, Lu and Zeng35 suggesting that the local cyclic voltage can be used for modeling the charge/discharge processes in Li-ion batteries. Kostecki et al.Reference Kostecki, Kong, Matsuo and McLarnon36 showed inhomogeneous conductivity within versus between grains in Li2Mn4O9 spinel and used insights gained from these localized measurements to propose a degradation mechanism in this system involving the irreversible extraction of Li ions and the formation of a MnO2 phase. A similar approach was applied to study the evolution of surface conductivity in LiMn2O4 spinel during thermal aging,Reference Matsuo, Kostecki and McLarnon37 confirming the proposed degradation mechanism. More recently, Lipson et al.Reference Lipson, Ginder and Hersam38 demonstrated correlations between topography and electrochemical activity, revealing a number of factors that lead to spatial inhomogeneities, including thickness of the active battery material and barriers to lithiation, such as the solid electrolyte interface (SEI) (Figure 6). Figure 6e–f shows extracted profiles along the green and yellow lines, respectively. Figure 6c–d demonstrates a current drop around the topographically protruding feature. This reduction in current suggests an SEI that creates a barrier to the ionic current, slowing the lithium insertion at these regions while inducing lithium ions to enter the protruding regions at a higher rate. In addition, the extracted profile in Figure 6f along the yellow line in Figure 6d shows that topographically protruding features do not necessarily correlate with the current increase. The feature indicated by the black arrow has a similar height to the other protruding features, but the current is similar to the background, suggesting that the film growth can eventually block the tin electrode underneath, and the electrolyte loses access to the electrode. This measurement provided a nanoscale picture of catalytic decomposition of the electrolyte where an SEI is observed to form around electrode regions that rapidly grow during lithiation. Kuriyama et al.Reference Kuriyama, Onoue, Yuasa and Kushida39 reported the dynamic change of the surface morphology of LiMn2O4 spinel under negative potential by AFM (Figure 7). The Li+ ions were extracted from the tetrahedral sites by the tip voltage, resulting in current increase and topographical changes ascribed to a relaxation of the Jahn–Teller phase transition, which is induced by the repulsive interaction between the Mn-eg and O-2p electrons in the Li accumulated layer.Reference Thackeray, David, Bruce and Goodenough40
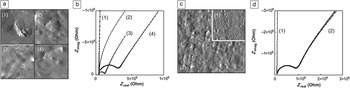
Nanoscale ac impedance measurements using atomic force microscopy (AFM) on polymer electrolyte films. (a) AFM images of polymer electrolyte films consisting of Li triflate dissolved in poly(ethylene) oxide (PEO) films at four different locations on the sample. (b) Corresponding impedance data for the images shown in (a). Z real and Z imag are the real and imaginary components, respectively. (c) AFM image of a PEO coated polycarbonate membrane. The inset in the upper right corner is an image of the uncoated membrane. (d) Corresponding impedance data for images shown in (c). The plots in (d) labeled as (2) consist of data for four overlapping points probed within the area of image (c). Localized ac impedance measurements demonstrate the heterogeneity in conductivity, which may be attributed to the degree of crystallinity and inhomogeneous distribution of the conducting salt during film growth. The scan area for all images in (a) are 3.8 × 3.8 μm2. Image (c) is 6.8 × 6.8 μm2. The inset in (c) is to scale. Reprinted with permission from Reference Reference Layson, Gadad and Teeters33. ©2003, Elsevier.

Nanoscale ion conductance measurements on a tin thin film on a copper thin film on glass. (a,c) topography and (b,d) dc current images of a 60-nm-thick tin thin film deposited on a 60-nm-thick copper thin film on glass (a,b) before lithiation and (c,d) after 24 μAhcm2 lithiation. Extracted profiles averaged over 8 pixels wide from (c) and (d) for the (e) green line and (f) yellow line. Extracted profile from the yellow lines demonstrates a current drop around the topographically protruding feature, which suggests a solid electrolyte interface (SEI) that creates a barrier to ionic current slowing the lithium insertion at these regions, while inducing lithium ions to enter the protruding regions at a higher rate. In addition, the extracted profile along the yellow line shows that topographically protruding features do not necessarily correlate with the current increase. The feature indicated by the black arrow has a similar height to the other protruding features, but the current is similar to the background, suggesting that the film growth can eventually block the tin electrode underneath, and the electrolyte loses the access to the electrode. This measurement provided a nanoscale picture of catalytic decomposition of the electrolyte where an SEI is observed to form around electrode regions that rapidly grow during lithiation. The two white arrows in (a–d) indicate the same features on the film to verify the same scan area. Reprinted with permission from Reference Reference Lipson, Ginder and Hersam38. ©2011, Wiley-VCH.

Atomic force microscopy (AFM) images on the LiMn2O4 surface taken at the bias voltage of (a) 0 V, (b) 5.5 V, (c) 6.5 V, and (d) 7.5 V. (e) Variation in area of the grains 1, 2, and 3. (f) Root-mean-squared roughness (rms) of the grains 1, 2, and 3. (g) Bias voltage dependence of the tip current measured at each point that the AFM tip passed through while scanning the 3.5 × 3.5 μm2 area on the spinel LiMn2O4 surface. The labels correspond to (b–d). The changes in morphology and current are induced by the extraction of Li+ ions from the tetrahedral sites by the tip voltage. This behavior can be ascribed to a relaxation of the Jahn–Teller phase transition. Reprinted with permission from Reference Reference Kuriyama, Onoue, Yuasa and Kushida39. ©2007, Elsevier.

Bio-based energy systems and dielectric polarization
Bio-inspired solutions for energy harvesting are under active development, underscored by a decade of research into molecular electronics, including light-activated electron pumps, solar cells, chemical sensors, and optoelectronics.Reference Davis, Morgan, Wrathmell, Axford, Zhao and Wang41 For implementation of such devices, local properties, especially at electrode interfaces, must be better understood. Here again impedance is valuable, as it accesses the real and imaginary components of the complex properties: capacitance and dielectric function as well as electronic resistance. For the case of organic compounds and biomolecules, this leads to information about molecular polarization.Reference Kathan-Galipeau, Nanayakkara, O’Brian, Nikiforov, Discher and Bonnell42 Several challenges arise in probing spatially localized molecular polarization. For the single monolayer studies that would forward fundamental understanding, signals are extremely small, in the aF range, and instrument capacitance becomes dominant. Contact to the molecular system must be carefully controlled to avoid damage.
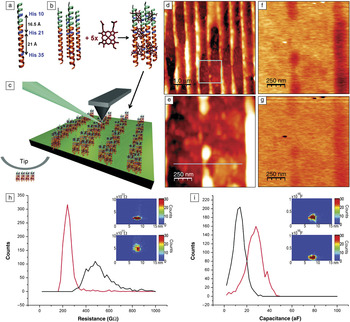
Kathan-Galipeau et al.Reference Kathan-Galipeau, Nanayakkara, O’Brian, Nikiforov, Discher and Bonnell42 overcame these challenges by combining torsional stabilization for force control with a stray capacitance compensation strategy, similar to that proposed by Pingree and Hersam.Reference Pingree and Hersam43 Sensitivity can be improved by five orders of magnitude with effective compensation strategies. When combined with optical excitation, this allowed photocurrent measurements and quantitative analysis of the excited state polarizability of a single molecular layer. Measurements were made on engineered optically active proteins patterned on electrode substrates during optical excitation. Synthetic proteins are designed such that the helices assemble on the substrate due to amphiphilic interactions. The patterned proteins are oriented perpendicular to the underlying substrate. The impedance of single molecular layers is then measured. Figure 8 compares properties in the presence and absence of light, probing both the real and imaginary components of the impedance. The differences in capacitance, and therefore dielectric function, were related to molecular orbital occupation and excited state carrier delocalization. These are critical components of the mechanistic basis of energy harvesting by light absorption in molecular materials.
Experimental configuration for characterizing properties of optically active synthetic proteins. (a–b) a-helices assemble on the substrate due to amphiphilic interactions. Blue indicates hydrophilic domains; orange indicates hydrophobic domains. His refers to histadine positions on the helix. (c) Idealized protein-electrode junction device configuration. The substrate is highly oriented pyroclinic graphite. The patterned proteins are oriented perpendicular to the underlying substrate. A 425 nm LED (blue) is directed at the tip-sample junction. Atomic force microscopy images of proteins patterned on an electrode: (d) topography, (e) zoomed in area of box in (d), (f) x-component of impedance of area in (e), and (g) y-component of impedance in (e). For (f) and (g), the z-range = 125 mV; for (d), the height z-range = 90 nm; and for (e), the height z-range = 40 nm; for (d) and (e), 70 kHz, 0.5 V applied signal. Effect of optical illumination on the resistance (h) and capacitance (i) of a protein monolayer illustrated as 2D and 3D histograms of the properties. The top 3D histograms in the insets are with illumination, the bottom without illumination. Red curves in the 2D histograms are with illumination, black curves are without exposure; λ = 425 nm. The difference in the capacitance can be quantitatively related to the polarization volume, therefore, this result determines the difference in ground state and excited state polarizations on a single molecular layer. The protein retains its functionality when under ambient conditions and attached to an electrode. Reprinted with permission from Reference Reference Kathan-Galipeau, Nanayakkara, O’Brian, Nikiforov, Discher and Bonnell42. ©2011, American Chemical Society.

In related work, Fumagalli et al.Reference Fumagalli, Ferrari, Sampietro and Gomila44 demonstrated low-frequency dielectric constant imaging of single layer supported biomembranes (purple membrane) at the nanoscale. Dielectric constant images were quantitatively reconstructed by combining the thickness and local capacitance obtained by a sub-attofarad low-frequency capacitance detector. They successfully decoupled the geometric parameters, such as the tip radius, scan height, and film thickness from the measured dielectric constant values, yielding an intrinsic property of the membrane with good reproducibility.
Impedance beyond energy-related materials
To be complete, we note that AFM-based impedance measurements have also contributed to the understanding of properties in a wide range of materials and are not limited to energy systems. The application domains include intergranular corrosion of austenitic stainless steels,Reference Arutunow, Darowicki and Zielinski45 localized corrosion onset in thin films and coatings,Reference Darowicki, Szocinski and Zielinski46 electrochemical nanopatterning,Reference Lee, O’Hayre, Prinz and Gur47–Reference Kruempelmann, Balabajew, Gellert and Roling50 static and dynamic transport at grain boundaries in semiconducting oxides,Reference O’Hayre, Lee and Prinz10, Reference Shao, Kalinin and Bonnell51–Reference Lee and Hwang57 and electronic transport in individual semiconductor devices,Reference Darowicki and Zielinski58, Reference Kalinin, Shin, Jesse, Geohegan, Baddorf, Lilach, Moskovits and Kolmakov59 among others. For example, ion transport in solid and liquid electrolytes is an important application domain where electrochemical impedance spectroscopy can make a significant contribution. Lee et al.Reference Lee, O’Hayre, Prinz and Gur47 carried out the nanoscale current-pulsing and impedance measurements on the solid-state ionic conductor, RbAg4I5, for electrochemical nanopatterning of Ag. Application of negative voltage pulses on an AFM tip relative to a counter electrode on RbAg4I5 samples created nanometer-sized Ag particles on the ion conductor around the probe. The patterned Ag particles were 0.5–70 nm high and 20–700 nm in diameter. The observed kinetic behavior via localized impedance measurements showed the close agreement with the Butler–Volmer equation, which states that the current produced by an electrochemical reaction increases exponentially with activation overpotential.Reference O’Hayre, Cha, Colella and Prinz1 Thus, the formation of Ag particles was limited by the electrochemical reaction kinetics rather than diffusion processes inside the ionic conductor. This metal patterning using electrochemical reactions on a solid-state ionic conductor was demonstrated for the first time in the literature, which has potential in many nanopatterning and manufacturing applications because of its advantages, including single-step, high-throughput, and large-area fabrication. Kruempelmann et al.Reference Kruempelmann, Balabajew, Gellert and Roling50 carried out nanoscale impedance measurements on Ag-ion conducting phosphate glasses containing different amounts of AgI. Using localized cyclic voltammetry, oxidation/reduction processes at the tip-sample interface were investigated, revealing that the created Ag particles acted as nanoelectrodes, and spreading of the electric field was governed by the lateral diameter of the particles, which provides alternative control parameters for the application of voltage pulses used by Lee et al.Reference Lee, O’Hayre, Prinz and Gur47 The combination of the two methods can be applicable to other solid ion conductors, solid polymer electrolytes, and glasses.
Summary and outlook
We have shown how spatially resolved impedance measurements can advance our understanding of critical phenomena in three energy technologies. In fuel cells, the correlation between the overall device performance and localized charge transfer reaction was verified as a function of surface morphology and environmental conditions. In lithium-ion batteries, degradation mechanisms and phase changes were associated with localized charge transport. In the case of photoactive bio-systems, the relation between absorption, polarization, and photocurrent was elucidated. The primary advantage is the ability of these techniques to provide spatial localization of microstructural elements that manifest both resistive and capacitive behavior. Faradaic reactions, ionic transport, polarization, and diffusion are directly probed. This makes localized impedance especially useful in electrochemical systems, as well as biological and semiconducting systems. Developments on the horizon such as multiplexing, novel tip designs, and improved shielding will lead to even higher sensitivity and spatial resolution, and more comprehensive property analysis. The three classes of studies presented here illustrate the potential of scanning impedance microscopy/spectroscopy to address scientific issues at the cores of some of our critical energy solutions.
Acknowledgments
R.O. acknowledges support from the Army Research Office under Grant #W911NF-09–1-0528 and the National Science Foundation MRSEC program under Grant No. DMR-0820518. D.B. acknowledges support from the Department of Energy DG-FG02- 00ER-45813 and the Nano/Bio Interface Center through the National Science Foundation NSEC DMR 553113.