In contemporary societies characterized by racial or ethnic divisions, public opinion about specific issues is often group-centric – that is, citizens’ attitudes about those issues are shaped by their feelings toward racial/ethnic groups. A prominent example of group-centrism in public opinion is the racialized nature of public opinion in the United States on issues such as welfare, health care or crime.Footnote 1 Less commonly, studies have demonstrated group-centrism with respect to ethnic or gender identities.Footnote 2 By aligning political positions with group identities, group-centrism can create or dismantle powerful political coalitions.Footnote 3 Hence, clarifying the conditions that promote or inhibit group-centric attitudes is an important task in the study of politics.
The concept of group-centric attitudes is nearly as old as the modern study of public opinion itself. Observing that the two policy issues for which average voters show the highest levels of ideological constraint both relate to race relations, Converse remarked that ‘[i]t seems more than coincidence that [this is] the only pair of items involving the fortunes of a visible population grouping’, proposing that what sets these issues apart is the presence of ‘linking information’ connecting policies and groups in citizens’ minds.Footnote 4
Building on this reasoning, a large body of scholarship in political science is devoted to the question of where this linking information comes from. Simply put, how do citizens learn to think about policies in terms of group identities? The bulk of the existing literature singles out one source in particular: mass communications. Either through news coverage in mass media or strategically deployed rhetoric by political elites, mass communications contribute to group-centric public opinion. Whether focused on news media or political figures, these accounts are ‘elite-centric’ in that they identify linking information as something transmitted to citizens by elite actors.
I argue that this account, though correct on its own terms, is too narrow. In addition to elite-driven information, citizens receive and process linking information from casual observation in the local context. Citizens take cues from observable group distinctions in the local environment and use them to make inferences about group–policy linkages. If a given policy appears to map onto stereotypes about a contextually salient outgroup, citizens evaluate the policy based on their feelings about that group. Hence, casual observation can by itself engender group-centric attitudes toward public policies. This implies that ‘top-down’ influences on citizens’ attitudes by elite actors are complemented by ‘bottom-up’ local experiential processes.
I contribute to the literature on group-centric policy attitudes by providing a theory of how casual observation can promote group-centric thinking about political issues. This not only helps provide a more complete account of what linking information can be. It is also a theory more in line with classical and widely accepted social–psychological theories of stereotyping and social categorization.
The idea that citizens’ attitudes respond to visible outgroups in the local context has a long history, and is typically examined in studies pitting contact theory against theories of group threat.Footnote 5 Beyond intergroup attitudes, this study also connects to the broader literature linking local ethnic diversity to political attitudes.Footnote 6 The present article’s key contribution to this literature is that the outcome of interest is not social or political attitudes toward ethnic outgroups per se, but rather the degree to which those attitudes are linked with attitudes toward ostensibly unrelated political issues.
In a recent study, Weber et al. outline a similar argument. The authors present data from a survey of voters in New York State showing that, among respondents low in self-monitoring, residing in racially diverse contexts is associated with a stronger correlation between racial stereotypes and stereotype-relevant policy preferences. (Self-monitoring captures respondents’ sensitivity to social norms.) Mirroring the argument presented here, the authors note that ‘[the] findings underscore the contextualized nature of stereotype expression, suggesting that racial stereotypes have their greatest influence on policy attitudes among whites in diverse zip codes’.Footnote 7
I extend the work of Weber et al. in two important ways. First, I provide a theoretically detailed account of how casual observation in the local context can promote group-centric attitudes. Secondly, I undertake an empirically and statistically more comprehensive test of the theoretical predictions, focusing on the issue of crime in an ethnically diversifying, modern welfare state. The evidence comes from two large sets of surveys of citizens in Denmark, each spanning around 20 years, linked with detailed registry data on local contexts. The data show that since the mid-1980s, Danish citizens’ attitudes about crime and immigration have become more closely linked to each other in response to local increases in ethnic diversity. Since the change is in response to local increases only, it cannot be attributable to national-level communication from political elites. Taken together, the theory and evidence suggest that accounts that hold only elite actors responsible for disseminating stereotypes are incomplete.
THEORY
Here I describe and exemplify the elite-centric approach that is predominant in the extant literature, including its role in explaining stereotypes about crime. I then develop a theoretical account, drawing on ideas from social psychology, of how casual observation promotes group-centric attitudes.
Elite-centric Approaches
From its inception, the study of public opinion has been guided by the assumption that the impersonal influence of mass communications shape political attitudes toward outgroups.Footnote 8 For example, while discussing the limited amount of personal contact with racial outgroups experienced by the average white American, Sigelman and Welch reason that ‘[l]acking such firsthand information, whites must base their responses on whatever other information they may have at their disposal. Given the tendency of media coverage to focus on cases of intense, dramatic conflict, the secondhand information whites have about blacks is apt to accentuate the negative’.Footnote 9
A key line of reasoning in the media-centric approach, then, is that the informational gap left by limited personal contact with outgroups can only be filled by media imagery. The argument is not exclusive to discussions of racial intergroup contact in an American context. In a study of immigration attitudes in Denmark, the empirical setting of this study, Gaasholt and Togeby reason that since beliefs about immigrants ‘[are] only to a very limited extent based on their own experiences […] these beliefs must arise from elsewhere. […] At the end of the day, beliefs and attitudes probably come from television or newspapers’.Footnote 10
Empirical studies that follow the elite-centric approach tend to rely on one of two designs (or in rare cases, both). The first consists of observational designs in the form of content analyses of media representations of minorities. These observational studies have tended to find that racial/ethnic minorities make up a disproportionate share of news media portrayals of welfare recipients and criminal offenders.Footnote 11 The theoretical linchpin of these studies is the idea that news stories represent manifestations of stable semantic structures – labeled ‘media packages’, ‘scripts’, ‘frames’ or ‘discourses’ – which guide and constrain public stereotypes about the target groups of public policies.Footnote 12
The second type of design within the elite-centric approach is experimental. Resting on theoretical ground similar to that of the observational studies, these studies experimentally vary the presence of ‘linking information’ connecting group identity to issues such as crime,Footnote 13 Social SecurityFootnote 14 or health care.Footnote 15 Relative to observational studies, experimental studies have focused less on news media and more on the strategic deployment of racial cues by political elites, testing the effects of cues inserted into political rhetoric. Other studies in this vein argue that even salient background characteristics of prominent political sponsors can by themselves promote group-centric attitudes.Footnote 16 These studies tend to find that political rhetoric that ‘plays the race card’ is effective at priming group-based antagonisms.Footnote 17
Elite Centrism and Criminal Stereotypes
In this study I focus on the issue of crime, on which public opinion scholarship is in many ways emblematic of the elite-centric approach. For example, in a canonical study of racialized crime attitudes, Jon Hurwitz and Mark Peffley conclude that ‘these tragic associations [between race and crime] have permeated the public consciousness in some way. This conflation is doubtless exacerbated by the critical role of the mass media’.Footnote 18 Similarly, Sides and Citrin argue that ‘attitudes towards immigrants have become increasingly divorced from social reality […] people’s perceptions of immigration and immigrants come to rely more on vivid events […] and messages from politicians and media’. Other accounts focus on the content of media coverage, arguing that an ‘ethnic blame discourse’ shapes mass beliefs about minority over-representation in criminal behavior.Footnote 19
Crime is distinct from other issues in two relevant respects. First, public opinion about crime is group-centric to an unusually explicit degree. The association of racial/ethnic minorities with criminal behavior is perhaps the most broadly held stereotype about minorities in Western societies. In the United States, racial ideology shapes white Americans’ policy attitudes about crime.Footnote 20 Similarly, Europeans associate immigration with higher levels of crime, expressing widespread agreement that ‘crime problems are made worse by people coming to live here from other countries’.Footnote 21 No other proposed consequence of immigration, negative or positive, is as widely agreed upon among citizens of European countries.Footnote 22 For my purposes, the unusually explicit group-centrism on the issue of crime is analytically useful. Since racial/ethnic stereotyping is so evidently a feature of contemporary attitudes about crime, I can set aside the issue of whether this is the case and focus on the how this stereotyping is learned.
Secondly, crime differs from other public policy issues in that it is spatially manifested. Contrary to pure public goods such as national security or climate change, the social costs of most types of crime are highly localized. As a result, citizens are likely to be attuned to local contextual cues about the level and nature of criminal activity. This implies that the issue of crime is, if anything, a ‘most-likely’ case for the role of casual observation. I return to the implications of this in the concluding section. Now, I present my theoretical argument of how casual observation in the local context can promote group-centric attitudes.
The Role of Casual Observation in Stereotype Formation
I argue that elite-centric approaches overlook the role of casual observation in the local context in the formation of group-centric policy attitudes. In doing so, I draw on the literature on context effects, specifically studies that focus on individuals’ subjective experiences of their local environment.Footnote 23 Casual observation is thus not understood as learning from social networksFootnote 24 or national-level political discourse,Footnote 25 but from mundane, everyday experiences. Akin to what Baybeck and McClurg call ‘the slow drip of everyday life’, casual observation shapes attitudes through the gradual accumulation of individually unremarkable experiences.Footnote 26 The notion of casual observation thus breaks the traditional theoretical distinction between influences that are either impersonal (largely from mass media) or personal (such as close friendships, crime victimization, unemployment or hospitalization).Footnote 27 Best understood as a third, intermediate category, casual observation facilitates political learning from peripherally perceived cues about the immediate social environment, absent any direct personal involvement. Casual observation is thus not strictly impersonal or personal, but both of these at once.
On the topic of stereotypes about crime, I expect citizens to be attuned to particular neighborhood characteristics indicative of group threat. First and foremost, citizens are likely to infer the likelihood of crime from neighborhood cues of disorder, such as graffiti and other visible traces of vandalism, noisy, brash groups of young people, or public fights or discussions. Most of these cues are far too innocuous to merit the label ‘crime’. But casually observed, most citizens will use exactly such cues to arrive at their implicit estimates of neighborhood crime rates. And, crucially, to the extent that cues of disorder co-vary with the presence of racial/ethnic minorities (either directly or indirectly), they may engender stereotypes about the typical group affiliation of perpetrators of crime.
Empirically speaking, the experience of living in an ethnically diversifying neighborhood is indeed likely to co-vary with increased levels of social disorder. Consider Appendix Figure F1, which shows police reports of crime plotted against municipal-level ethnic diversity in Denmark, the empirical setting studied here. Rates of reported citizen-directed crime (the most visible, personally affecting types, such as vandalism, assault or robbery) increase consistently with higher levels of local ethnic diversity. At the individual level, this correlation almost vanishes completely when correcting for background characteristics (such as age and socio-economic status) as well as contextual features (such as population density) that are analytically distinct from ethnic diversity.Footnote 28 But citizens observing these concomitant trends ‘bivariately’ in their own neighborhood are unlikely to be able (or indeed motivated) to parse out these confounding factors. Casual observation cannot make statistical adjustments. What remains for citizens exposed to their local contexts is the experientially salient fact of social disorder rising along with ethnic diversity.
The notion that stereotypes can arise out of observed covariation between social groups and patterns of behavior is a long-standing theme in social psychology. Influential early work argued that stereotypical beliefs can even develop in the absence of group differences.Footnote 29 Another class of models attributes stereotype formation to social categorization based on real group differences, though these differences can in turn be either exaggerated,Footnote 30 disproportionately attributed to dispositional factorsFootnote 31 or unconsciously detected.Footnote 32
In the present study, the key lesson from the social–psychological literature on stereotype formation is that stereotypes are a result of automatically occurring social categorization processes designed to accentuate between-group differences. As part of this process of social categorization, individuals search for cues that seem to indicate group affiliation. This search is attentive to any type of cue in the informational environment, including those accessible through casual observation in the local context. In local contexts characterized by an increasingly salient majority–minority group distinction (such as ethnic background) and a rare and threatening behavioral pattern (such as crime), this social categorization process will promote minority-group stereotyping among majority-group individuals. Once encoded, individuals pay increased attention to information that confirms this categorization.
In societies characterized by spatially varying ethnic diversity, the implication of this process is that stereotypes are more accessible to individuals residing in diverse contexts with more salient group distinctions. Notably, though this theory describes how stereotypes can arise from information searches in the local context, it provides no explanation of why individuals are cognitively motivated to conduct this search to begin with. One such explanation, from the perspective of evolutionary psychology, would be that social categorization is the automatic execution of an ‘alliance detection system’ evolved to track the presence of relevant coalitions in the local environment.Footnote 33 All else equal, this evolutionary account is more likely given that social disorder is likely to elicit a sense of threat: previous studies indicate that a state of anxiety can shift individual cognition to rely more on evolved response patterns.Footnote 34
Hypothesis
The mechanism of casual observation consists of exposure to mundane social disruption in ethnically diversifying neighborhoods. In turn, as respondents are exposed to higher local levels of ethnic diversity, their attitudes about crime should more strongly reflect how they feel about immigrants. Hence, I expect crime attitudes to be more tightly linked with anti-immigration sentiments in settings with a higher proportion of racial/ethnic minorities. This leads to the main hypothesis tested in this article:
Hypothesis 1: As ethnic diversity in the local context increases, crime attitudes become more strongly associated with anti-immigration attitudes.
The hypothesis thus implicitly assumes that a stronger association between immigration attitudes and crime attitudes reflects higher levels of group-centrism. This follows standard practice in the racialization literature, in which increased correlations with racial predispositions are taken as evidence of an increased reliance on those predispositions.Footnote 35 This measurement strategy has the crucial advantage of allowing me to rely on any survey dataset that contains measures of immigration and crime attitudes without requiring direct measures of stereotyping, which are both much scarcer and more prone to social desirability bias.
EMPIRICAL SETTING
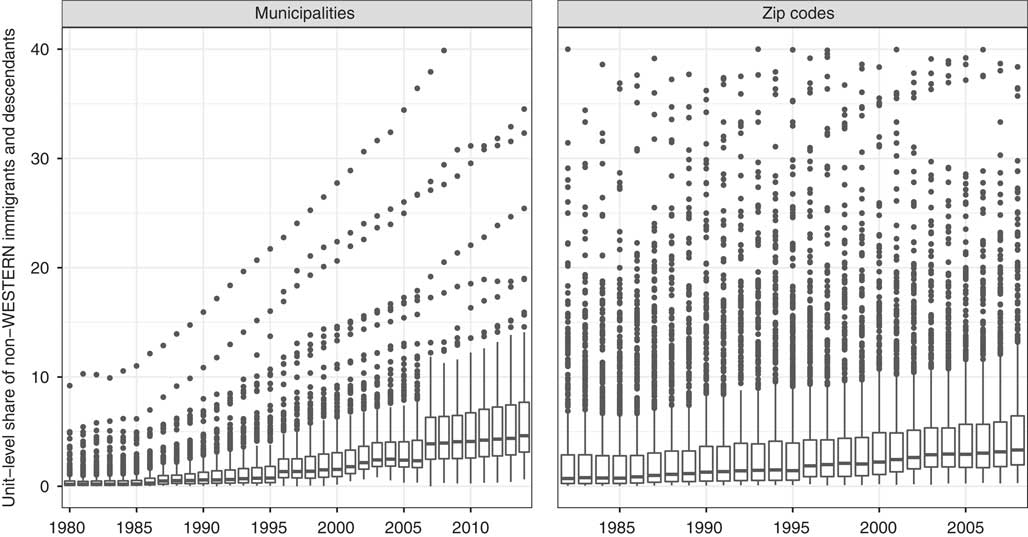
The data used to test the hypothesis are drawn from two large datasets, each of which consists of responses from a number of surveys conducted in Denmark between 1983 and 2011. This choice of empirical setting has four main advantages. First, the data capture considerable variation in ethnic diversity, increasing from a very low to a moderately high level. The observed values of contextual ethnic diversity in the data, measured as the local share of non-Western immigrants and descendants, ranges from zero to around 50 per cent. Figure 1 plots the trends in ethnic diversity within municipalities and zip codes, the two levels of measurement used here.
Box plots of distributions of shares of non-Western immigrants and descendants at the zip code and municipality level by year. Note: the y-axis is censored at 40 per cent in order to more clearly show variation at the bottom of the scale. In the municipality data, the jump in 2007 is partly attributable to a reform that amalgamated municipalities into larger units. Source: Statistics Denmark

Secondly, the empirical setting is particularly useful for studying the consequences of contextual ethnic diversity in that it allows for comparing citizens in fully ethnically homogeneous contexts with those in highly diverse contexts. By observing citizens in contexts across this range, the setting allows for observing conditions under which group-based distinctions become increasingly salient from a baseline of being virtually absent. This setting contrasts with most studies of contextual ethnic diversity, which examine already diverse contexts.Footnote 36
Thirdly, citizens’ news diet is relatively nationalized in this setting. The Danish newspaper market is dominated by three national dailies, and Danes are less likely to watch local TV news than either Americans or Brits (albeit more so than other Scandinavians).Footnote 37 Therefore rhetoric from national-level political elites should affect local communities roughly uniformly. This does not imply that party cues are unimportant in explaining group-centric attitudes. The role of party cues is at the center of a rich and persuasive literature in public opinion,Footnote 38 including studies using Danish data.Footnote 39 However, it does imply that party cues and other elite-level influences are ill-equipped to explain differences in group-centric attitudes between local communities.Footnote 40
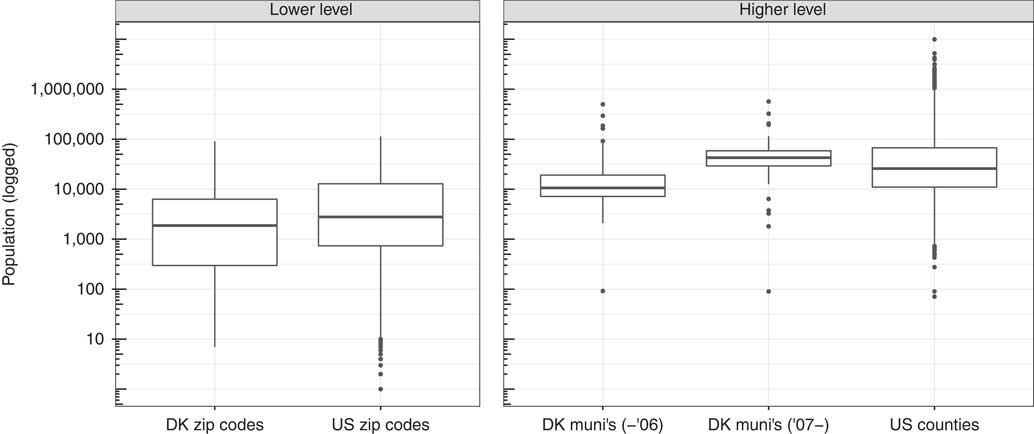
Lastly, the empirical setting allows me to retrieve highly accurate and relatively localized contextual data from official registries. Consider Figure 2, which plots the sizes of the contextual units analyzed, zip codes and municipalities (the latter both before and after the 2007 amalgamation reform). For comparison, the figure also plots the distributions of geographical units often used in studies of context effects: US countiesFootnote 41 and US zip codes.Footnote 42
Distributions of sizes of contextual units. Sources: Statistics Denmark, United States Census Bureau

Pre-reform Danish municipalities, which represent around 69 per cent of the municipality data, are substantially smaller than typical US counties. Post-reform, the average municipality is slightly larger. Like pre-reform municipalities, Danish zip codes represent fewer people than their US counterparts – some contain fewer than 100 inhabitants. Hence, particularly for the zip code data, measured contextual ethnic diversity should capture important variation in respondents’ everyday exposure to ethnic minorities. Equally importantly, Danish unit sizes tend to be less variant than is the case for US counties and zip codes. This alleviates a concern when working with US data, namely that the size of the contextual unit (which is correlated with measurement error) is itself correlated with covariates of interest.
Besides varying measurement error, official geographical units such as municipalities and zip codes are, in another, more basic sense, problematic measures of individuals’ environments of contextual experience. First of all, there is no guarantee that individuals’ subjective experiences – their ‘pseudoenvironments’Footnote 43 – accurately capture objective features of their environment. In fact, evidence suggests that these pseudoenvironments do not resemble official units in shape or content.Footnote 44 Furthermore, scholars who nevertheless find themselves relying on official units are faced with the ‘modifiable area unit problem’ (MAUP). Because geographical space is continuous, it can be partitioned in an infinite, arbitrary number of ways. The MAUP is the phenomenon whereby this arbitrarily chosen method of aggregation in itself affects a correlation between variables of interest, even to the point of flipping its sign.Footnote 45
This study, like most others, is constrained by data availability and so relies on contextual measures from official geographical units. However, in order to alleviate concerns about the MAUP, I follow the recommendation of Wong, as well as Tam Cho and Baer and use contextual measures from two different geographical units.Footnote 46 The results show that the observed association is robust across both levels of measurement. This robustness makes it less likely that the inference is an artifact of the specific measure of context.
DATA AND MODEL
In order to test the hypothesis presented above, data with at least three types of information are needed: individuals’ intergroup attitudes, their crime attitudes and a contextual identifier allowing for merging in data on contextual ethnic diversity. Two data sets, each with its own advantages and disadvantages, satisfy this criterion. One is an aggregate of ten separate, nationally representative surveys, most of which are election surveys, in which respondent context is observed at the municipality level. The other comes from a commercial polling agency that for a number of years conducted regular surveys about political concerns, which include data on respondents’ zip codes. In the following, I present the results from these two datasets in parallel. As will be clear, despite differences in measurement, the results are highly consistent across both datasets. For convenience, I will refer to them as the municipality data and the zip code data, respectively.
In both sets of data, one of the main independent variables, Ethnic Diversity, is constructed as the unit-level share of non-Western immigrants and descendants.Footnote 47 Since I theorize that stereotypes about ethnic minorities are inferred from visible contextual cues, it makes sense to use a measure concentrating on non-Western immigrants and descendants, who are the most likely to be visibly distinct from the native population. The choice to use a simple measure of the share of non-Western immigrants and descendants over other, more complex measures such as the Herfindahl Index is primarily theoretically motivated: using the Herfindahl Index would imply distinguishing between the specific nationalities of individual outgroup members, a distinction citizens engaging in casual observation are unlikely to make. However, the choice of the measure of ethnic diversity is not empirically consequential: Dinesen and Sonderskov, who rely on similar data, find that their results are robust to relying on the Herfindahl Index.Footnote 48
I depart from other studies by using the level of local ethnic diversity as opposed to a measure of change. For example, both Hopkins and Newman use a measure of 10-year change in local ethnic diversity, arguing that changes in the local environment are more psychologically salient than levels.Footnote 49 However, since I observe local immigration from a baseline of almost total ethnic homogeneity, levels are virtually synonymous with long-run changes in the Danish context. Appendix Figure F2 plots levels versus changes for US counties and Danish municipalities, showing that whereas the two are only weakly correlated in the United States (r=0.45), they are nearly synonymous in my data (r=0.93). Hence, in order to avoid dropping observations, I opt for a measure of local levels.
The other key variables are measured somewhat differently in the municipality and zip code datasets. The remainder of this section describes how. Appendix B presents summary statistics for all variables in both datasets.
The Municipality Data
The municipality data gather survey responses from ten nationally representative surveys from 1990 to 2011, presented in Appendix Section A. Three of the surveys included do not provide the respondents’ municipality of residence. In order to be able to use these data, I impute the municipalities of respondents in those two surveys by exploiting the fact that several surveys provide information on both municipality and zip code.Footnote 50
The individual-level independent variable, Anti-Immigration Attitude, is measured using survey items that examine the question of immigration as a cultural threat, reported in Appendix Table A2.Footnote 51 The dependent variable, Crime Attitude, is measured in a slightly cruder, though reasonably theoretically valid, way. The typical question used is whether the respondent supports ‘tougher sentences for violent crime’, arguably a face valid measure of attitude toward crime.Footnote 52 However, in some cases the response options are binary, and in the Likert-scaled items, the responses are highly skewed in favor of supporting tougher sentencing. In order to ensure a balanced measure of crime attitude, I dichotomize the item across all surveys.
The set of statistical controls available is partly constrained by the fact that any variable needs to be present in all ten surveys. Hence, at the individual level the models rely on standard demographic controls (gender, age and education) as well as the household income of the respondent and dummies for whether the respondent is a student or retired. Income is a typical demographic control, but including it introduces the problem of missing data for nearly a third of respondents. Simply ignoring missing data by using listwise deletion can lead to severe bias, so I impute income and other demographics using the multiple imputation approach presented in Honaker and King.Footnote 53 At the aggregate level, I follow Hopkins and include a control for municipality-level average education as well as population.Footnote 54 Some models also include various combinations of fixed effects for municipality and year and controls for ideology and partisanship, the inclusion of which is discussed below. All variables except age and ethnic diversity are coded to range 0–1 in order to maximize comparability across coefficients.
The Zip Code Data
The zip code data are drawn from a quarterly survey conducted by the Institute for Business Cycle Analysis (IBCA), a private polling agency.Footnote 55 From 1983 to 2004, the IBCA was contracted by the Danish Ministry of Justice to conduct quarterly, nationally representative surveys of citizens’ concerns and worries about various issues. The key attitudinal measures used here are all drawn from this battery. Altogether, the dataset collects around 56,000 responses.
To measure Anti-Immigration Attitude, I use an item measuring respondents’ concerns about ‘immigrants and refugees’. As was the case in the municipality data, this item taps respondents’ basic feelings toward ethnic outgroups reasonably well. One potential concern is that, compared to the measure in the municipality data, this measure does not as straightforwardly capture a strictly negative attitude. A respondent may express concern without harboring negative affect toward ethnic outgroups. However, while respondents expressing concern for this reason would affect estimates of overall levels of immigration attitudes, measurement bias of this sort would not in itself affect comparisons between respondents residing in different local contexts.
The dependent variable, Crime Attitude, is measured as respondents’ level of concern about ‘violence and crime’. This measure is analytically distinct from the one used in the municipality data: whereas the former measured an attitude about policy, this item reflects concerns about personal security. Yet in a broader sense, both items capture respondents’ thinking about crime, and so should provide a reasonable test of the hypothesis.Footnote 56 Question wordings for both items are reported in Appendix Table A3.
For both measures, the response range is a four-point scale moving from very concerned to not at all. Though a four-point scale is coarser than the conventional minimal standard for interval-scale data, for ease of interpretation I assume both scales to be continuous measures.Footnote 57
The data have only few individual-level control variables. Only standard demographic controls (gender, age and education), which are asked of all respondents, are included here. The aggregate level includes some additional control variables, which are constructed from individual-level registry data and matched with respondent zip code. These include the zip code population, average level of education and average income. As was the case in the municipality data, I recode all individual-level variables except age to range 0–1 in order to maximize comparability.
Modeling Strategy
The data are constructed to test the hypothesis that crime and anti-immigration attitudes are more strongly correlated in ethnically diverse contexts. In other words, the hypothesis states that the association between anti-immigration and crime attitudes is moderated by contextual ethnic diversity. Hence, I specify a number of interaction models of the basic form:
 $$Crime_{{ij}} \,{\equals}\,f\left( {\beta _{1} {\times}Imm_{{ij}} {\plus}\beta _{2} {\times}ED_{j} {\plus}\beta _{3} {\times}Imm_{{ij}} {\times}ED_{j} {\plus}{\bf{X}} _{{{\bf{ij}} }} {\times}\gamma } \right)$$
Where Crime ij is a measure of attitude toward crime for respondent i in context j, Imm ij is a measure of respondent i’s anti-immigration attitude, ED j is the ethnic diversity in context j, and X ij × γ is a vector of additional controls and their coefficients. The hypothesis implies that the coefficient on the interaction term, β 3, is positive and significant.
In the municipality data, the measure of Crime ij is binary, so I estimate f (·) using logistic regression. In zip code data, the measure is continuous, so I estimate f (·) using ordinary least squares (OLS). All models are fixed-effects models with standard errors clustered at the level of unit-year.Footnote 58 Given the limited within-unit variation but high statistical power, I opt for fixed-effects models in order to minimize unit-level bias at the expense of inefficiency, which is less of a concern given the large number of units.Footnote 59 The fixed-effects estimator has the important property of controlling out time-invariant confounders, the advantages of which I discuss in further detail below.
RESULTS
Regression Estimates
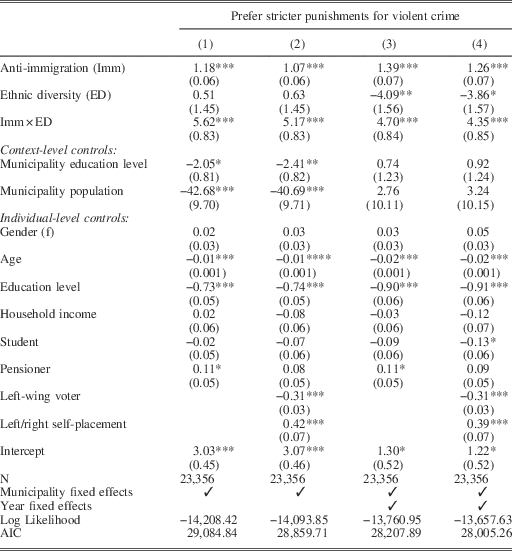
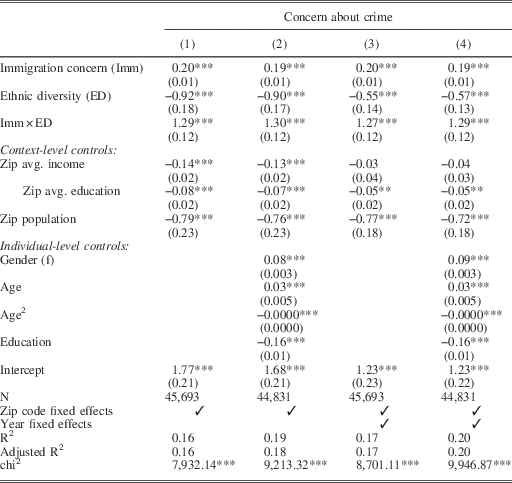
Tables 1–2 present results from various specifications of the model described above for the municipality and zip code datasets, respectively. In both tables, I present the main and interaction terms in Equation 1 first and then various control variables. The models differ in two respects: the types of fixed effects included in the model and the inclusion of individual-level political covariates.
Models using Municipality Data

Note: *p<0.05; **p<0.01; ***p<0.001
Models Using Zip Code Data

Note: *p<0.05; **p<0.01; ***p<0.001
In Tables 1–2, the last two models differ from the first two only with respect to the inclusion of fixed effects. In Models 1–2, fixed effects for municipalities or zip codes are included. These control for time-invariant unobserved heterogeneity at the contextual level of measurement. Models 3–4 add fixed effects for survey-years. These control for unobserved heterogeneity specific to each survey, such as the contemporaneous political or media agenda. As the tables show, even when including both sets of fixed effects and the full set of individual-level controls, the hypothesized interaction effect is substantively robust and strongly statistically significant.
Statistically speaking, the robustness of the coefficient on Imm × ED across these sets of models is informative, since the inclusion of fixed effects removes bias from unobserved spatial or temporal heterogeneity at the expense of larger standard errors. Even so, the interaction is strongly significant across all specifications. This is more than a mere technical point, especially with respect to the unit-level fixed effects included in all four models. By controlling away time-invariant unobserved heterogeneity between units, the fixed effects strengthen the case that local ethnic diversity is the causally consequential contextual feature. In contrast, researchers using cross-sectional data need to assume that they can observe and adjust for all potential context-level confounders. If not, they risk ascribing effects to contextual diversity that are in fact due to other local characteristics. Hence, the large sets of data I use here are not merely sources of high statistical power. The cross-sectional time-series nature also provides a stronger foundation for the proposed causal mechanism.
In each table, Models 2 and 4 differ from Models 1 and 3 with respect to the inclusion of individual-level controls. In the zip code data, the individual-level controls are standard demographics. As is clear in Table 2, including these is inconsequential. In the models based on municipality data, the inclusion of additional individual controls is more debatable, in that Models 2 and 4 include voters’ self-reported party choice in the previous election as well as their left–right self-placement. These variables are included in order to account for heterogeneity in voters’ general political outlook. For example, if voters of a particular political orientation are more likely to self-select into ethnically diverse localities, and are simultaneously more likely to think about crime in ethnic terms, the observed interaction will be spuriously inflated. The downside of including these variables is that they may be post-treatment to anti-immigration attitudes, in which case the observed interaction may be underestimated.Footnote 60 Regardless of which of these effects dominates, the results in Table 1 remain robustly significant.
Illustrations of Effect Sizes
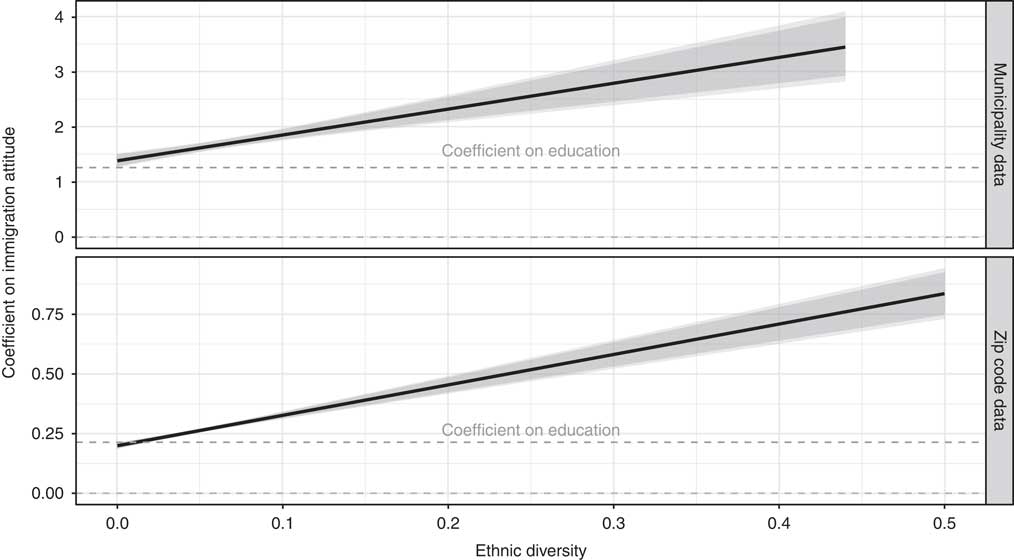
The statistical significance of the results aside, the substantive magnitude of the interaction is difficult to make sense of based on the regression output alone. To help illustrate the interaction, Figure 3 plots the predicted association between anti-immigration and crime attitudes at various levels of contextual ethnic diversity. In order to help make sense of the predicted effect, the plot includes a line for the coefficient on education in a model with no interactions. Like the immigration attitude measure, the education measure is scaled from 0 to 1, so the coefficients can be interpreted as the predicted change in crime attitude associated with moving across the full range of the variable. The line for the coefficient on education thus provides a baseline for comparing how strongly immigration and crime attitudes are associated at various levels of ethnic diversity.
Correlations between anti-immigration attitudes and crime attitudes at varying levels of contextual diversity in municipality and zip code data. Note: shaded areas represent 90 and 95 per cent confidence intervals. The dotted line shows the coefficient on level of education in a model predicting crime attitudes. At the lowest level of ethnic diversity, anti-immigration attitude is about as informative as education in terms of predicting crime attitude. But moving across the range of ethnic diversity, the association increases to a level more than double (in the municipality data) or triple (in the zip code data) that of education level.

The observed patterns in both datasets are strikingly similar. At the lowest level of ethnic diversity, anti-immigration attitude is about as informative as the level of education in terms of predicting crime attitude. But moving across the range of ethnic diversity, the association increases to a level more than double (in the municipality data) or triple (in the zip code data) that of education level. The comparison indicates that the interaction is thus not just statistically but also substantively significant.
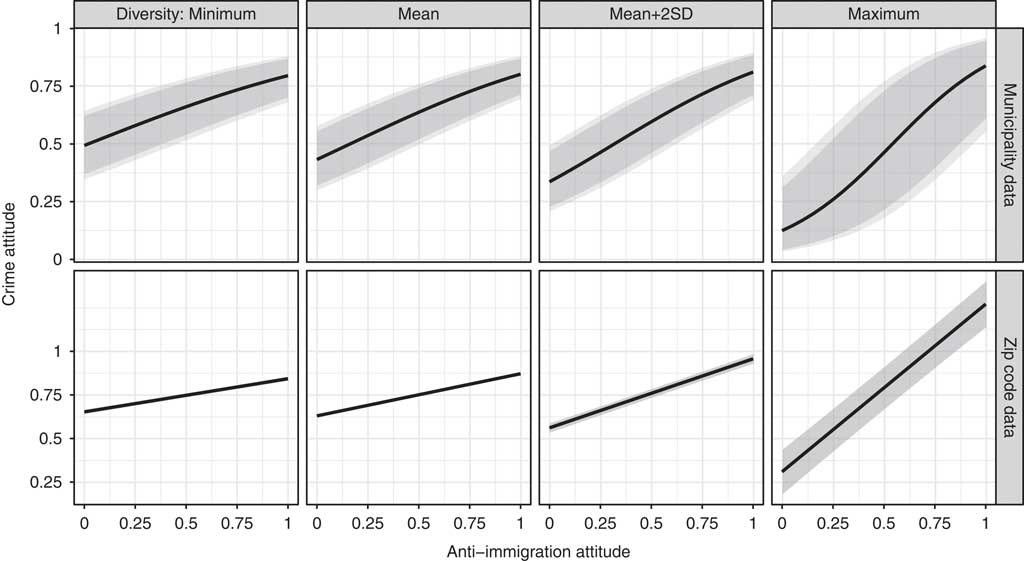
Another way of making sense of the substantive magnitude of the interaction is shown in Figure 4, which plots the predicted associations between immigration and crime attitudes at various observed levels of ethnic diversity. Again, the results for the two datasets are similar. At the lowest observed level, moving across the range of anti-immigration attitudes corresponds to a change of about a quarter of the dependent variable. At the highest observed level of ethnic diversity, the corresponding predicted change is three-quarters of the dependent variable or more. The figures illustrate how much more closely immigration and crime attitudes are linked in highly ethnically diverse local contexts.
Predicted associations between anti-immigration and crime attitudes at various levels of ethnic diversity, in municipality and zip code datasets. Note: shaded areas represent 90 and 95 per cent confidence intervals. In both datasets, anti-immigration attitude predicts crime attitudes more strongly as local ethnic diversity increases.

As is apparent in Figures 3–4, the estimated interaction effect is considerably greater at the zip code level compared to the municipality level. This most likely reflects a smaller amount of attenuation bias in the zip code data, where both the dependent variable (a more fine-grained measure) and the contextual measure (a smaller geographical unit) contain less measurement error.
Manipulation Check
This study’s hypothesis rests on the assumption that the stronger association between immigration and crime attitudes in more ethnically diverse contexts reflects exposure to ethnic diversity. That is, I assume that individuals in diversifying contexts react to changing neighborhood composition. The hypothesized stronger link between immigration and crime attitudes is a downstream consequence of this experience. To bolster the case for this link, I present evidence supporting the case that individuals actually experience neighborhood ethnic diversity. The test thus serves as a ‘manipulation check’ of the hypothesized treatment, showing that neighborhood ethnic diversity does enter into respondents’ everyday lives.
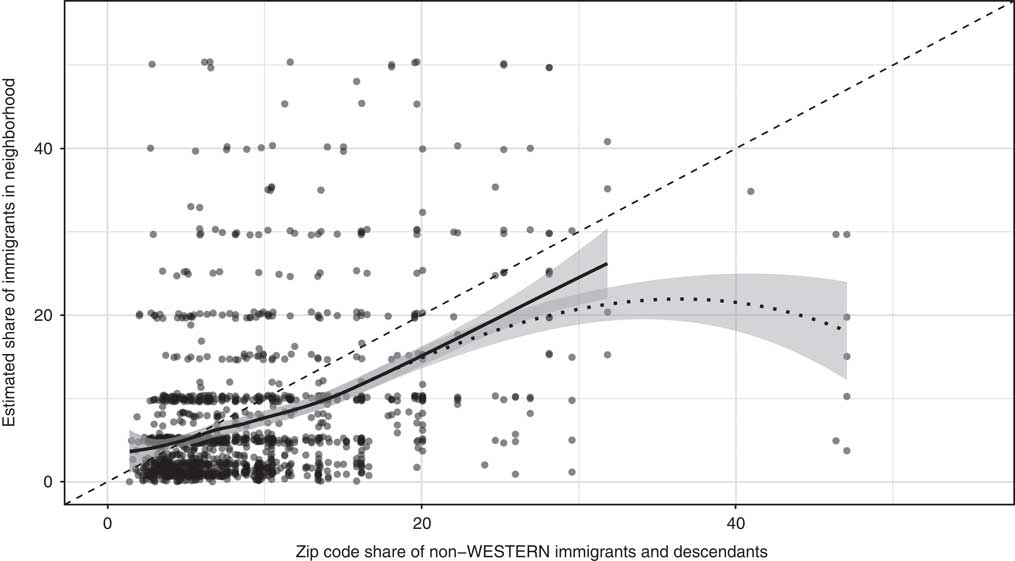
In a study using US survey data, Newman et al. conduct a similar check, showing that respondents do in fact ‘receive the treatment’ in that they can reasonably accurately estimate local levels of immigration and unemployment.Footnote 61 Here, I show that Danish citizens are equally responsive to local characteristics. I rely on the Danish implementation of the 2009 International Social Survey Programme, which includes a few items on how respondents perceive their neighborhood. One question asks respondents to ‘please provide your best guess—approximately what proportion of people living in your neighborhood are immigrants from non-western countries?’ Response options range from zero to 100 per cent. Since the data also provide respondents’ zip codes, I can match respondent estimates to actual zip code shares of non-Western immigrants and descendants. Figure 5 plots the two against each other.
Manipulation check: actual vs. respondent-estimated levels of neighborhood ethnic diversity. Note: the dotted line is a loess fit. The thick line is a loess fit excluding the ten observations at the highest levels of neighborhood ethnic diversity (above 40 per cent).

As shown by the loess lines in the figure, respondent estimates of neighborhood ethnic diversity track actual ethnic diversity very closely across almost the entire observable range.Footnote 62 In fact, the observed correlation is around three times stronger than that found in a similar study of neighborhood perceptions in the United States.Footnote 63 The notable exception is the ten respondents from zip codes with more than 40 per cent non-Western immigrants, who seem to underestimate neighborhood diversity. This underestimation at the highest end of the range should not affect the main results, since very few respondents in the municipality and zip code datasets (0.02 per cent) are observed in contexts that diverse. Furthermore, any bias introduced by underestimating neighborhood diversity should attenuate the estimated effects, yielding a more conservative test. In sum, I can be fairly confident that, as a rule, respondents in more ethnically diverse contexts actually perceive them as such.
Placebo Tests
While the main results show a clear interaction, it remains the case that immigration and crime attitudes are significantly correlated even where the observed level of ethnic diversity is zero (see, for example, the leftmost panels in Figure 4). This should come as no surprise. Immigration and crime attitudes are both tied to the class of ‘post-materialist’ issues that emerged as an independent ideological dimension in Western electorates in the post-war era.Footnote 64 Hence, at minimum levels of ideological constraint, the two issue positions should correlate simply by virtue of reflecting the same ideological dimension.
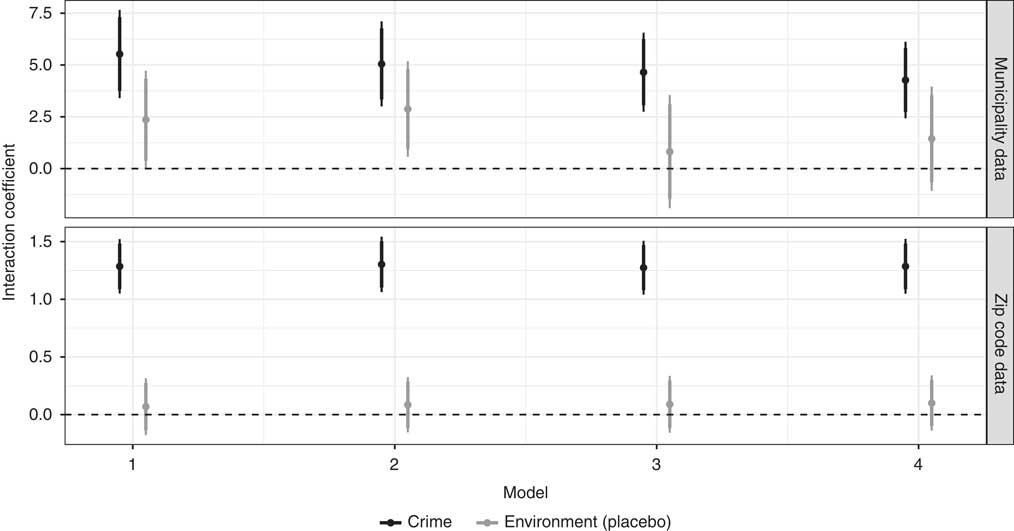
This is not, in and of itself, a problem for the theory proposed here, which is concerned with changes in the correlation conditional on ethnic diversity rather than its baseline level. But it does raise the concern that the results may reflect greater post-materialist ideological constraints among inhabitants of ethnically diverse localities rather than an issue-specific change in how those inhabitants think about crime. In order to test this proposition, Appendix Tables C1–C2 present placebo tests of the main results, re-estimating the models from Tables 1–2 using a different post-materialist issue, concern for the environment, as the dependent variable. I summarize the placebo tests in Figure 6, plotting the placebo interaction coefficients alongside the coefficients from the original models.
Interaction coefficients in original and placebo models for each of the four presented specifications, municipality and zip code data

The environmental issue is useful as a placebo test since, being a classical post-materialist issue, it is measured in all of the surveys used in this study. It also has no meaningful direct connection to anti-immigration attitudes. Since the benefits of environmental policy tend to be diffuse (that is, environmental quality is a pure public good), it is unlikely to be associated with any specific group. Hence, while environmental attitudes are ideologically aligned with crime attitudes, they should not be easily implicitly linked with visible social groups, including immigrants. If the main results merely reflected higher levels of ideological constraint among post-materialist attitudes in ethnically diverse localities, the models should return significant interactions similar to those in Tables 1–2. Conversely, if the effect of ethnic diversity really is specific to ethnic stereotyping of the issue of crime, the interaction should be negligible. The results illustrated in Figure 6 suggest the latter is the case. In all the placebo models save one, the interaction term is insignificant, and its magnitude is at most about half of that found in the main results.
In sum, the placebo test indicates that the main result does not merely reflect a broader tendency towards more ideologically constrained post-materialist attitudes in diverse contexts, but is in fact a specific link between diversity and the issue of crime.
Additional Tests
As in all observational studies, there is a relevant concern that the results may be model-dependent.Footnote 65 To address this concern, Appendix D presents the results from various alternative models. First, I use fixed-effects regressions in the main results above, which typically minimize bias. However, there are relatively few individual-level observations for at least some contextual units in the data, in which case a random-effects model may potentially reduce variance enough to offset a minor increase in bias.Footnote 66 In Tables D1–D2 I show that random-effects models produce similar estimates.
Secondly, the assumption that the four-point scale for the independent and dependent attitude variables in the zip code data can be treated as interval scaled may be too strong. In Table D3 and Figure D2, I show that the results are robust to treating both scales as ordered categorical using ordinal logit models. Thirdly, testing the main hypothesis using a multiplicative interaction model allows only the attitudinal independent variable to vary by local context and sets the coefficients on all other variables as fixed. Tables D4–D5 relax this constraint by splitting the local ethnic diversity variable at the median and fitting a simpler, additive model on each half of the data, thus allowing the coefficients on all variables to vary by local ethnic diversity. Consistent with the hypothesis, the coefficient on anti-immigration attitudes is larger in the high ethnic diversity sample across all specifications in both datasets, and the difference between coefficients is statistically significant in every case. Hence, the result is not an artifact of the interaction model specification.
Lastly, as in other studies involving the effects of features of local contexts, the possibly confounding role of residential self-selection is an important concern.Footnote 67 In the context of this study, the results could be driven by self-selection if individuals with less group-centric attitudes were systematically more likely to move out of areas with high levels of ethnic diversity. Such a selection pattern could result in changes in local population composition masking as effects of local ethnic diversity. In studies that purport to find adverse effects of local ethnic diversity, this concern about self-selection is typically addressed on theoretical grounds, noting that it is prima facie unlikely that the individuals least hostile to ethnic outgroups would be systematically more likely to move out of ethnically diverse areas.Footnote 68 In addition to this theoretical argument, the self-selection concern can also be tested empirically. I do so following the approach of Dinesen and Sonderskov: I interact a measure of ethnic crime stereotypes with local ethnic diversity in a model in which the dependent variable is a binary indicator for whether the respondent moved in the three years subsequent to the survey.Footnote 69 I utilize the fact that the European Social Survey round 1 has a reasonable measure of ethnic crime stereotypes (agreement with the statement that ‘crime problems [are] made worse’ by immigrants) and can be linked to information in Danish public registers about respondents’ local contexts and moving behavior after taking the survey.
I present the results of this analysis in Appendix E. Note that if individuals with less group-centric attitudes were systematically more likely to move out of ethnically diverse areas, the interaction between local ethnic diversity and the attitude measure should be negative. Yet as shown in Table E1, the interaction term is statistically indistinguishable from zero. Moreover, the point estimate of the interaction term is positive, suggesting that if anything, individuals with more group-centric crime attitudes are more likely to move out of ethnically diverse areas. In sum, although self-selection cannot be fully ruled out, observable moving patterns suggest that the study’s results are not likely to be attributable to self-selection.
CONCLUSION AND DISCUSSION
To explain the group-centric nature of various policy attitudes, scholars have typically turned to elite-centric accounts, emphasizing the role of mass communications and prominent political sponsors in promoting group–policy linkages. In this article, I have challenged the assumption that only elite influences can engender such associations. Instead, casual observation in the local context contributes to citizens’ beliefs about the group-linked nature of public policies.
Using data from two large sets of surveys spanning 20 years, I provided evidence consistent with this argument: as ethnic diversity increases in citizens’ local contexts, their views on crime more closely reflect their feelings about immigrants. In Danish localities where ethnic diversity has increased significantly in recent decades, moving across the observable range of diversity is associated with this link increasing two- to threefold. Since the effects persist when considering only variation within small geographical units and within years, they cannot be attributable to national-level media discourse. The results highlight the potential role of casual observation in the development of stereotypes about racial/ethnic minorities.
The main limitation of this study lies in the observational, time-series cross-sectional nature of the data. For one, this leaves open the possibility that the observed associations reflect changes in population composition rather than changed attitudes. In theory, the observed data could be explained by less-prejudiced citizens being more likely to move out of ethnically diverse localities for unobserved reasons. Though difficult to obtain for sufficiently long periods of time, panel data would allow for observing within-individual responses to changing local contexts. Even so, the question of the role played by self-selection in and out of diversifying contexts would remain. A worthwhile avenue for future research would thus be to test the argument presented here using exogenous variation in exposure to local ethnic diversity, either naturally occurring or implemented experimentally.
An additional limitation of this study is its single-issue character, which leaves open the question of whether casual observation is particularly important for the issue of crime. Exploring the boundary conditions of the political role of casual observation is an important task for future research.
For those concerned with the detrimental impact of racial/ethnic stereotypes on political discourse and public policy, the study holds somewhat somber implications. The theory and findings suggest that ridding mass communications of news media distortions and racialized campaign rhetoric would not fully do away with stereotypes about crime. Altering the impressions citizens get from the local context is a greater challenge, involving intractable tasks such as reducing public disorder and preventing ethnic segregation. But to the extent that stereotypes derive not just from the media but also from casual observation in the local context, addressing such stereotypes is a question not only of political communication, but also of public policy.