Implications
In dairy cows, metabolic diseases are of major economic importance. In mammals, the nutritional state of pregnant dams influences the risk of metabolic disease in their offspring. Metabolic conditions in dairy cattle bred in practice vary immensely, but the effect on their calves is unknown. We demonstrated significant differences in blood metabolite concentrations between non-lactating heifers and lactating cows around conception. However, glucose metabolism and development were similar in their neonatal calves. These findings imply that a calf from a lactating cow does not display altered intra-uterine development or glucose homeostasis compared with a calf born from a heifer.
Introduction
The Developmental Origins of Health and Disease (DoHAD) concept states that the nutritional state of mammals during the embryonic and foetal stages in utero has consequences for development and health in later life (McMillen et al., Reference McMillen, MacLaughlin, Muhlhausler, Gentili, Duffield and Morrison2008). When exposed to unfavourable conditions, an embryo undergoes adaptations that enhance its chance of survival on the short term, but may become detrimental in postnatal life (Hales and Barker, Reference Hales and Barker1992; Ravelli et al., Reference Ravelli, van der Meulen, Michels, Osmond, Barker, Hales and Bleker1998; Ozanne and Hales, Reference Ozanne and Hales2002; Stocker et al., Reference Stocker, Arch and Cawthorne2005). These adaptations take place via modifications of gene expression that do not involve changes in the nucleotide sequence (e.g. via DNA methylation and histone modification), and are hence called ‘epigenetic’. A very large number of epidemiological in vivo studies conducted in man support the DoHAD concept, exposing associations between metabolic or nutritional disturbances in pregnant women and a variety of health issues, including lower birth weight and non-insulin dependent diabetes mellitus, in their offspring (Ozanne and Hales, Reference Ozanne and Hales2002; de Rooij et al., Reference de Rooij, Painter, Phillips, Osmond, Michels, Godsland, Bossuyt, Bleker and Roseboom2006).
The high incidence of metabolic disorders in high-yielding dairy cows presents one of the major economic challenges in today’s dairy industry (Leroy et al., Reference Leroy, Vanholder, Van Knegsel, Garcia-Ispierto and Bols2008). In order to obtain a better understanding of the association between yield and transition disorders, research should target mechanisms that underlie both the drive for production and the cow’s disease susceptibility. In this aspect, mechanisms regulating energy partitioning throughout the body are very interesting research targets, and insulin plays a key role in this (Drackley et al., Reference Drackley, Dann, Douglas, Janovick Guretzky, Litherland, Underwood and Loor2005; Bossaert, Reference Bossaert2010). Prioritization of milk yield during peak lactation is established through a postpartal decrease of insulin concentration and responsiveness (Drackley et al., Reference Drackley, Dann, Douglas, Janovick Guretzky, Litherland, Underwood and Loor2005). On the other hand, low insulin concentrations and responsiveness make high-yielding cows respond to nutritional shortcomings with massive body tissue mobilization, increasing their disease susceptibility (Oikawa and Oetzel, Reference Oikawa and Oetzel2006; Friggens et al., Reference Friggens, Berg, Theilgaard, Korsgaard, Ingvartsen, Løvendahl and Jensen2007). Therefore, decreases in insulin concentration and responsiveness are considered key aetiologic mechanisms in the pathogenesis of metabolic disorders in lactating dairy cows.
Researchers have unraveled metabolic and genetic backgrounds for low insulin secretion (Gutierrez et al., Reference Gutierrez, Gong, Bramley and Webb2006; Hammon et al., Reference Hammon, Bellmann, Voigt, Schneider and Kühn2007; Bossaert et al., Reference Bossaert, Leroy, De Vliegher and Opsomer2008) and responsiveness (Oikawa and Oetzel, Reference Oikawa and Oetzel2006; Pires et al., Reference Pires, Souza and Grummer2007; Bossaert et al., Reference Bossaert, Leroy, De Campeneere, De Vliegher and Opsomer2009) in cattle. However, very little is known about the epigenetic background of insulin-dependent glucose metabolism in dairy cows. This is surprising, since the DoHAD concept seems relevant to dairy cattle. Indeed, animals used for reproduction on commercial dairy farms vary immensely from a metabolic point of view. Dairy cows are usually bred during or briefly after the negative energy balance (NEB) that occurs in early lactation, and partition large amounts of energy towards the mammary gland at the time of conception (Bossaert et al., Reference Bossaert, Leroy, De Vliegher and Opsomer2008; Leroy et al., Reference Leroy, Vanholder, Van Knegsel, Garcia-Ispierto and Bols2008). In contrast, non-lactating heifers are bred in an anabolic condition and divert energy towards the growth of tissue. It is unclear to what extent this difference influences glucose metabolism in their offspring. More knowledge in this field would contribute to a better understanding of the complex aetiology of metabolic disorders in dairy cattle.
The aim of the present study was to assess the influence of the metabolic state of cows and heifers during early pregnancy on their neonatal calves’ birth weight, conformation, and glucose metabolism, as measured with an intravenous glucose (IVGTT) and insulin (IVITT) tolerance test.
Material and methods
All the experiments and protocols in the current study have been approved by the Ethical Committee of the Faculty of Biomedical, Pharmaceutical and Veterinary Sciences of the University of Antwerp (Approval number: 2010/11).
Cows and heifers
Housing and management
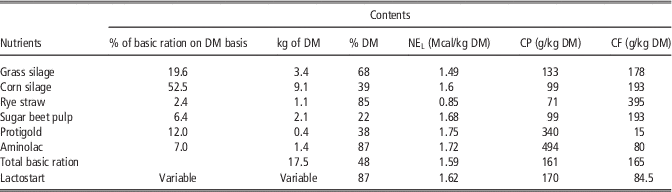
In total, 16 non-lactating heifers and 18 lactating cows, housed in a commercial dairy farm, were observed. Lactating cows were housed in a loose cubicle stable and milked on average 2.7 times per day by an automated milking system (DeLaval, Gent, Belgium). Cows were followed up by the Flemish Cattle Breeding Association and had an average 365-day fat-corrected milk yield of 10 850 kg in the previous lactation and an average genetic index for production of 894 kg above the mean of all cows in the Association. Cows were fed a mixed ration at the feed bunk ad libitum, consisting of grass silage (19.6% of the ration on a dry matter (DM) basis), corn silage (52.5%), rye straw (2.4%), sugar beet pulp (6.4%), a protein mixture (12.0%, Protigold; Aveve, Diest, Belgium) and protein-rich concentrate (7.0%, Aminolac; Aveve). Supplementation of a balanced concentrate (Lactostart; Aveve) in feeding stations and during milking was increased from 1 kg per day at calving to 5.5 kg (heifers) or 6.5 kg (cows) per day at 21 days postpartum, and was then individually adapted to lactation stage, health and production level. During the far-off dry period (6 to 2 weeks before the expected calving date), cows were moved to a separate section and fed hay ad libitum and 7.5 kg DM of corn silage, supplemented with 250 g of a dry period mineral mixture (Prolacta; Aveve). Approximately 10 days before the expected calving date, cows were moved into a cubicle pen adjacent to the lactating group, and were offered the dry period ration supplemented with 4.5 kg DM of the mixed lactation ration. When signs of imminent parturition were evident, cows were moved to a separate calving pen with straw bedding, where they received the same ration. Non-lactating heifers were housed in a loose cubicle stable and were fed ad libitum a mixed ration consisting of 67% grass silage and 33% corn silage on a DM basis, supplemented with 100 g of a mineral mixture (Biotine Mix; Comptoir de Gives, Villers-le-Bouillet, Belgium). Approximately 3 weeks before calving, heifers were moved to the close-up dry cow pen. More details about the composition of the diet is provided in Tables 1 and 2.
Contents of the different feed components in the lactating cow ration

% DM=percentage of dry matter; NEL=net energy for lactation; CF=crude fibre.
Contents of the different feed components in the heifer ration

% DM=percentage of dry matter; NEL=net energy for lactation; CF=crude fibre.
Blood sampling and pregnancy diagnosis
Breeding of the cows was started after a voluntary waiting period of 40 days. Oestrus in cows was detected on sight and with the help of an automated activity meter (DeLaval). Heifers were bred at visible oestrus from the age of 13.5 months. Development and growth of the heifers was above the recommended growth curves (Flemish Cattle Breeding Association, 2012, data not shown). Whenever a cow or heifer was inseminated, a series of four blood samples was taken, with intervals of 1 week. Agitation of the cows was avoided. All blood samples were taken from the coccygeal vein using evacuated gel-coated and fluorinized blood tubes (Vacutainer; Terumo Europe N. V., Leuven, Belgium). Between 33 and 40 days after insemination, pregnancy diagnosis was carried out using a 7.5 MHz linear array ultrasound probe (Pie Medical, Maastricht, The Netherlands). The blood sampling procedure was restarted whenever an animal was rebred.
Neonatal calves
Housing and management
. Immediately after birth, calves were removed from the dam and individually housed in igloo huts on concrete floors with straw bedding. Calves were fed 3 l colostrum with a gastric tube within the 1st 12 h after birth, followed by another 3 l fed with a drinking bottle during the next 12 h. Calves received the dam’s milk ad libitum from a drinking bucket during the 2nd day. From the 3rd day to the 7th day, calves received 1.7 l of formula (i.e. 1.5 l water and 225 g of formula, Spraystart nr 224; Aveve) twice per day, at 0700 h and 1800 h. This amount was increased to ~2.6 l twice per day (i.e. 2.25 l of water and 337.5 g of formula) from day 8 until day 14. Milk refusal was negligible. At all times, water, fresh hay and calf starter flakes (Startflakes; Aveve) were offered ad libitum. A feeding schedule (data not provided) with milk replacer was continued until 9 weeks of age, after which the calves were weaned. BW, withers height and heart girth were measured at birth and at the days of the IVGTT and IVITT.
IVGTT
Between 7 and 14 days of age, at exactly 0800 h, an IVGTT was carried out according to a protocol described elsewhere (Bossaert et al., Reference Bossaert, Leroy, De Vliegher and Opsomer2008). No milk was provided on the morning of the IVGTT, so the experiment was carried out after a 14 h fasting period. Briefly, blood samples were obtained in evacuated gel-coated and fluorinized blood tubes (Vacutainer; Terumo Europe N. V.) from a catheter fixed in the jugular vein, at −10, −5, 4, 8, 12, 18, 25, 36, 45 and 60 min relative to an intravenous infusion of 150 mg glucose (Glucose Dextrose; Eurovet, Heusden-Zolder, Belgium) per kg BW. Stress was avoided and a resting period of 30 min was included after insertion of the catheter.
IVITT
The IVITT was performed 2 days after the IVGTT, following the protocol described elsewhere (Bossaert et al., Reference Bossaert, Leroy, De Campeneere, De Vliegher and Opsomer2009). Preparation of the calves and time of the experiments were identical to the IVGTT. Blood samples were collected from a catheter fixed in the jugular vein at −10, −5 and 30 min relative to an intravenous infusion of 0.05 IU of human recombinant insulin (Actrapid; Novo Nordisk Pharma, Brussels, Belgium) per kg BW.
Lab analyses
All blood samples were centrifuged (2000×g, 30 min) within 1.5 h after collection and serum and plasma samples were stored at −25 °C until analysis. Analyses were carried out semi-automatically in a diagnostic lab (AML; Antwerp, Belgium). Glucose concentrations (mg/dl) were quantified spectrophotometrically using a commercially available kit (glucose assay; Abbott Laboratories, Illinois, USA) and converted to mmol/l. This kit had a detection limit of 2.5 mg/dl and an inter- and intra-assay coefficient of variance below 2%. Insulin concentrations (µIU/ml) were measured in a radioimmunoassay using a commercially available kit (Coat-a-count; Siemens, München, Germany). The kit had a detection limit of 2.4 µIU/ml and an inter- and intra-assay coefficient of variance below 10%. Concentrations of non-esterified fatty acids (NEFA; mmol/l) were measured with a commercially available kit (NEFA C Kit; Wako Chemicals, Richmond, USA) with a detection limit of 0.001 mmol/l and an inter- and intra-assay coefficient of variance below 10%. Concentrations of IGF-I (ng/ml) were measured by a radioimmunoassay using a commercially available kit (DIAsource SM-C-RIA-CT Kit; DIAsource ImmunoAssays S.A, Louvain-La-Neuve, Belgium) with a detection limit of 0.25 ng/ml and an inter- and intra-assay coefficient of variance below 10%.
Data processing
IVGTT
Using the data of the IVGTT, basal levels of insulin (Ib) and glucose (Gb) of the calves were determined as the mean concentration of the two blood samples taken before glucose infusion. The area under the curve of insulin (AUCins; µIU/ml×min) and glucose (AUCgluc; mmol/l×min) was computed as the total insulin and glucose increment above basal levels during the 60 min following infusion. Insulin and glucose peak and nadir concentrations (Pins, Nins and Pgluc, Ngluc, respectively) were determined. Elimination rates of insulin and glucose (ERins; %/min, and ERgluc; %/min, respectively) were computed with the following formulas, as described by Pires et al. (Reference Pires, Souza and Grummer2007):
 $$\eqalignno{ & {\rm ER}_{{{\rm ins}}} =\left\{ {\left( {{\rm ln }\left[ {{\rm P}_{{{\rm ins}}} } \right]-{\rm ln }\left[ {{\rm N}_{{{\rm ins}}} } \right]} \right)/\left( {{\rm t}_{{\rm p}} -{\rm t}_{{\rm n}} } \right)} \right\}{\times}{\rm 1}00 \cr & {\rm ER}_{{{\rm gluc}}} =\left\{ {\left( {{\rm ln}\left[ {{\rm P}_{{{\rm gluc}}} } \right]-{\rm ln }\left[ {{\rm N}_{{{\rm gluc}}} } \right]} \right)/\left( {{\rm t}_{{\rm p}} -{\rm t}_{{\rm n}} } \right)} \right\}{\times}{\rm 1}00 $$
where tp and tn are the times of the peak and nadir concentration, respectively.
QUICKI
Using Gb (converted to mmol/l) and Ib, the quantitative insulin sensitivity check index (QUICKI) was computed as an indicator of insulin responsiveness (Rabasa-Lhoret et al., 2003):
 $${\rm QUICKI}={\rm 1}/\left[ {{\rm log}\left( {{\rm G}_{{\rm b}} } \right){\plus}{\rm log }\left( {{\rm I}_{{\rm b}} } \right)} \right]$$
IVITT
Basal levels of glucose (Gb) were determined as the mean concentration of the two samples taken before insulin infusion. Using Gb and the glucose concentrations at 30 min (G30) after insulin infusion, the insulin-stimulated blood glucose response (ISBGR; %) was computed as described by Oikawa and Oetzel (Reference Oikawa and Oetzel2006):
 $${\rm ISBGR}=\left[ {\left( {{\rm G}_{{\rm b}} -{\rm G}_{{{\rm 3}0}} } \right)/{\rm G}_{{\rm b}} } \right]{\times}{\rm 1}00$$
Statistical analysis
The 16 heifers and 18 cows gave birth to 37 calves (three twins). Data from the twin calves and their mothers were omitted to avoid confounding. Also, two calves were excluded from the data set due to health problems. As a result, 16 cows and 13 heifers and their calves (15 female and 14 male) were studied. All statistical analyses were carried out using a statistical software package (SAS Institute Inc., Cary, NC, USA). Two statistical analyses were conducted and are described below.
Cows and heifers
A longitudinal data set of plasma glucose, NEFA and IGF-I concentrations was created: repeated measurements of each heifer or cow were obtained on four different time points after conception. First, histograms were generated to check the distribution of the outcome variables. Logarithmic transformation was carried out when the distribution of the outcome variable was not normal. This was the case for NEFA and IGF-I concentrations. The relationship between blood metabolites, time and parity was modelled using linear mixed models. Parity (1: heifer; 2: cow) and time (time points 1, 2, 3 and 4) were included as fixed effects, and a random intercept was included for individual animals to account for the dependence between measurements within the same animal. In each model, we tested for a time×parity interaction. When insignificant, the interaction term was omitted from the model in order to test for the main effects only.
Neonatal calves
We assessed the effect of the dam’s parity and the calf’s gender on eight metabolic traits (AUCgluc, AUCins, Pgluc, Pins, ERgluc, ERins, QUICKI and ISBGR) and three developmental traits (BW, withers height and heart girth) of the calves. Analysis was performed using two-way ANOVA, with parity of the dam (heifer or cow) and gender of the calf (male or female) as independent variables, and the metabolic and developmental traits as outcome variables. In each analysis, a parity×gender interaction was included to test whether the effect of the dam’s parity depended on the sex of the calf. When insignificant, the interaction term was omitted from the model in order to test for the main effects only.
Results
Cows and heifers
Cows were in their 1st (n=7), 2nd (n=5) or 3rd (n=4) lactation when they conceived. Their average interval from parturition to conception was 114 days (range: 44 to 210 days). Heifers (n=13) conceived at an average age of 15 months (range: 14 to 18 months). Cows needed on average 2.75 inseminations per conception, compared with 2.0 in the heifers.
Results of plasma glucose, NEFA and IGF-I concentrations are displayed in Table 3. The time×parity interaction and the main effect of time were not significant for any of the investigated parameters. An effect of parity on all parameters was found: compared with cows, heifers had higher IGF-I (P=8.6×E−7) and glucose concentrations (P=5.9×E−13), and lower NEFA concentrations (P=1.8×E−5).
Glucose, NEFA and IGF-I concentrations in non-lactating heifers and lactating cows at different weeks after conception

NEFA=non-esterified fatty acids.
Neonatal calves
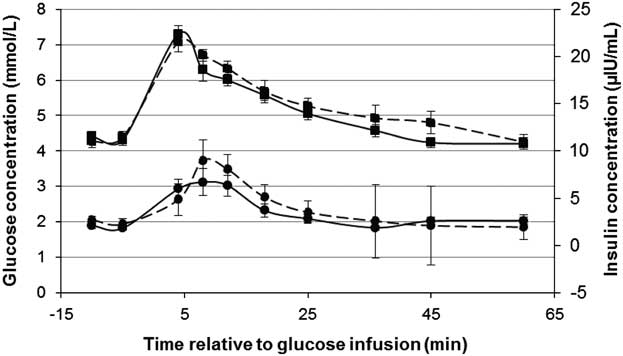
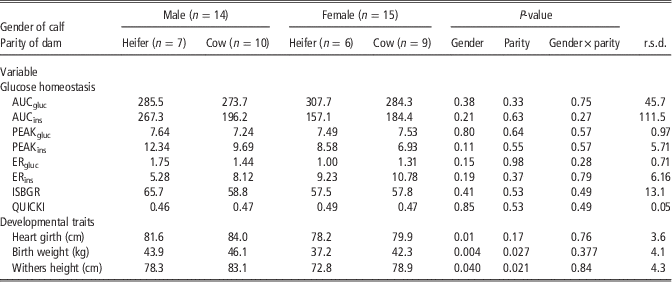
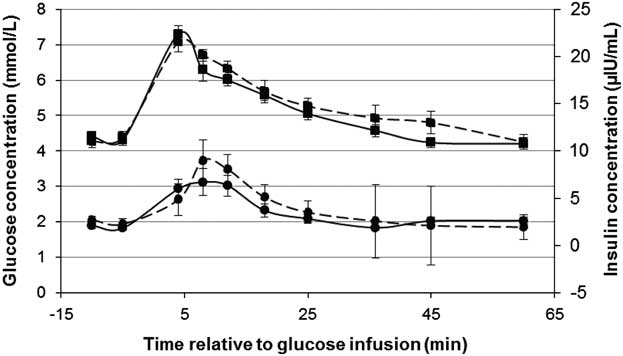
Results are displayed in Table 4. Examples of responses to an intravenous glucose or insulin challenge are provided in Figure 1. For none of the outcome variables, a significant parity×gender interaction was found. The main effect of the dam’s parity was not significant for any of the metabolic variables. Dam parity did affect BW (P=0.027) and withers height (P=0.040): both parameters were higher in calves born from a cow compared with a heifer. Parity did not affect heart girth (P=0.17).
Responses to an intravenous challenge of 150 mg glucose per kg BW in calves born from heifers (interrupted line; n=13) and cows (solid line; n=16). Glucose concentrations (squares; mmol/l) are displayed on the primary vertical axis, while insulin concentrations (circles; µIU/ml) are displayed on the secondary vertical axis. Error bars represent the standard error of the mean.
Effects of dam parity and calf gender on glucose homeostasis and developmental traits in calves

AUCgluc=area under the curve of glucose (mmol/l×min); AUCins=area under the curve of insulin (µIU/ml×min); PEAKgluc=glucose peak concentration (mmol/l); PEAKins=insulin peak concentration (µIU/ml); ERgluc=glucose elimination rate (%/min); ERins=insulin elimination rate (%/min); ISBGR=insulin-stimulated blood glucose reduction (%); QUICKI=quantitative insulin sensitivity check index.
The main effect of gender was non-significant for all metabolic parameters. A main effect of gender was found on developmental traits: BW (P=0.004), withers height (P=0.04) and heart girth (P=0.024) were higher in male than female calves.
Discussion
The aims of our study were (1) to compare the metabolic state between non-lactating heifers and lactating cows in the 1st month after conception under field conditions, using blood metabolite concentrations, and (2) to investigate the effect of the dam’s metabolic state on glucose homeostasis and development of their calves in the 1st 2 weeks of life.
The 1st analysis reveals lower glucose and IGF-I and higher NEFA concentrations in cows compared with heifers around conception. As mentioned above, animals displayed large variation in size, milk yield, feed intake and age or days in milk at conception. These factors were not controlled nor corrected for in the statistical analysis and may confound the data, specifically the energy status. For instance, due to the variation in the interval between calving and fertilization, some cows were in NEB while others were recovering towards a positive energy balance at the time of conception (Jorritsma et al., Reference Jorritsma, Wensing, Kruip, Vos and Noordhuizen2003). It is important to note that, despite these variations, substantial metabolic differences were found, indicating a relatively ‘catabolic’ state in the lactating cows compared with the relatively ‘anabolic’ state in the growing heifers.
The marked differences between cows and heifers justify further comparison of their calves. Previous work has demonstrated that the factor ‘lactation’ alters embryo quality compared with non-lactating cows (Leroy et al., Reference Leroy, Opsomer, De Vliegher, Vanholder, Goossens, Geldhof, Bols, de Kruif and Van Soom2005), and that exposure of bovine oocytes to NEB conditions in vitro affects glucose homeostasis in early embryonic stages (Van Hoeck et al., Reference Van Hoeck, Sturmey, Bermejo-Alvarez, Rizos, Gutierrez-Adan, Leese, Bols and Leroy2011 and Reference Van Hoeck, JL, Alvarez, Rizos, Gutierrez-Adan, Schnorbusch, Bols, Leese and Sturmey2013). The difference in IGF-I corresponds to other reports (Taylor et al., Reference Taylor, Cheng, Pushpakumara, Wathes and Beever2004) and is of particular interest, since IGF-I has been proposed as a mediator between maternal energy balance and foetal development (Wathes et al., Reference Wathes, Reynolds, Robinson and Stevenson1998; Lucy, Reference Lucy2008; Micke et al., Reference Micke, Sullivan, Gatford, Owens and Perry2010).
In the 2nd analysis, the effects of dam parity and calf sex on developmental traits and glucose homeostasis in the neonates were assessed. Despite the differences between the lactating and non-lactating metabolic states, main effects of parity on insulin-dependent glucose metabolism were non-significant. This may seem surprising, since studies conducted in sheep have demonstrated that impaired prenatal energy supply affects insulin secretion and insulin responsiveness in their lambs (Gardner et al., Reference Gardner, Tingey, Van Bon, Ozanne, Wilson, Dandrea, Keisler, Stephenson and Symonds2005; Owens et al., Reference Owens, Thavaneswaran, De Blasio, McMillen, Robinson and Gatford2007; Todd et al., Reference Todd, Oliver, Jaquiery, Bloomfield and Harding2009). However, some important differences should be considered when comparing these studies. A first issue to consider is the level of energy restriction. While the aforementioned studies induced experimental and severe energy restriction, metabolic differences between heifers and cows in the current study were not experimentally induced, but observed under field conditions. While statistically significant, these differences may not have been sufficient to evoke biologically relevant responses. A second issue is the age of the test subjects. Calves were tested at a very young age, allowing a transparent interpretation of glucose and insulin challenge tests (Bossaert et al., Reference Bossaert, Leroy, De Campeneere, De Vliegher and Opsomer2009). A decrease in insulin responsiveness in human infants has been reported as an early precedent of clinical diabetes (Martin et al., Reference Martin, Warram, Krolewski, Bergman, Soeldner and Kahn1992). On the other hand, studies conducted in sheep (Gardner et al., Reference Gardner, Tingey, Van Bon, Ozanne, Wilson, Dandrea, Keisler, Stephenson and Symonds2005; Owens et al., Reference Owens, Thavaneswaran, De Blasio, McMillen, Robinson and Gatford2007; Todd et al., Reference Todd, Oliver, Jaquiery, Bloomfield and Harding2009) and rats (Stocker et al., Reference Stocker, Arch and Cawthorne2005) suggest that the metabolic consequences of malnutrition in utero may remain latent at a younger age and emerge around or after puberty. The absence of a dam effect on the outcome variables in the neonates does not exclude effects on the longer term.
It must be mentioned that colostrum and milk feeding influence glucose homeostasis in calves (Hammon and Blum, Reference Hammon and Blum1998; Rauprich et al., Reference Rauprich, Hammon and Blum2000). Since colostrum, milk, starter and roughage feeding management was constant among calves and all tests were carried out after a 14 h fast, confounding of the data by nutritional differences in the calves seems unlikely.
A higher BW and heart girth were found in male than in female calves, corresponding to data reported elsewhere (Freetly et al., Reference Freetly, Ferrell and Jenkins2000). Cows gave birth to calves with a larger BW and withers height than heifers. This positive effect of dam parity on the size of the calf corresponds to other sources (Kertz et al., Reference Kertz, Reutzel, Barton and Ely1997). On the other hand, maternal metabolic state also affects foetal growth and BW in babies (de Rooij et al., Reference de Rooij, Painter, Phillips, Osmond, Michels, Godsland, Bossuyt, Bleker and Roseboom2006), lambs (Freetly et al., Reference Freetly, Ferrell and Jenkins2000) and calves (Freetly et al., Reference Freetly, Ferrell and Jenkins2000; Micke et al., Reference Micke, Sullivan, Soares Magalhaes, Rolls, Norman and Perry2009; Du et al., Reference Du, Tong, Zhao, Underwood, Zhu, Ford and Nathanielsz2010; Micke et al., Reference Micke, Sullivan, Gatford, Owens and Perry2010). This effect could not be confirmed in the current study. Very recently, calves born out of energy-restricted heifers from conception up to 110 days in gestation were compared with calves born from control-fed heifers: BW, growth rate and glucose metabolism were comparable between both groups (Mossa et al., Reference Mossa, Carter, Walsh, Kenny, Smith, Ireland, Hildebrandt, Lonergan, Ireland and Evans2013).
Conclusion
To conclude, periconceptional differences in the metabolic state between high-yielding lactating cows and non-lactating heifers, as they occur in practice, were not associated with differences in glucose metabolism and size in their newborn calves. The practical implication of these findings is that a calf born from a lactating cow does not display altered insulin secretion and insulin responsiveness compared with a calf born from a heifer. In order to understand the full, long-term impact of prenatal metabolism on postnatal growth and the susceptibility to metabolic disorders in cattle, follow-up studies are suggested, focusing on different degrees of energy restriction in specific stages of pregnancy and investigating offspring of different ages.
Acknowledgement
This research was funded by the Province of Antwerp (Belgium) and University of Antwerp. Authors are members of the EU Cost Action Epiconcept FA1201.