

INTRODUCTION
Tissue culture preparations derived from sensory ganglia have been used for decades for investigating sensory neurons (Crain, Reference Crain1956; Lawson et al., Reference Lawson, Biscoe and Headley1976). These cultures are currently much in use and are very helpful for elucidating important aspects of the somatosensory system, and in particular basic pain mechanisms (Julius and Basbaum, Reference Julius and Basbaum2001; Rugiero et al., Reference Rugiero, Drew and Wood2010). Because the sensory endings of sensory neurons have a very small diameter, they are currently not amenable to direct physiological and pharmacological investigations. Fortunately, it appears that the neuronal somata are similar in many ways to the endings (Devor, Reference Devor1999), and therefore investigation of the somata can yield essential information on the terminals. In addition, the accessibility of sensory ganglia, the simplicity of the neuronal morphology and the lack of synapses make cultured sensory ganglia an ideal tool to study also general neuronal properties.
Sensory neurons are ensheathed by specialized glial cells termed ‘satellite glial cells’ (SGCs). Recently, there has been considerable interest in these cells as they are profoundly altered by peripheral injuries used to study pain, and appear to contribute to chronic pain (Huang et al., Reference Huang, Belzer and Hanani2010; Jasmin et al., Reference Jasmin, Vit, Bhargava and Ohara2010). SGCs are peripheral glial cells, but share many properties with astrocytes in the central nervous system, including expression of glutamine synthetase and transporters of amino acid neurotransmitters. SGCs presumably fulfill roles such as those attributed to astrocytes in clearing extracellular potassium accumulating near active neurons and metabolite delivery and removal from neurons. However, SGCs differ in some respects from astrocytes, particularly by the tight sheath they make around neuronal cell bodies (Pannese, Reference Pannese1981, Reference Pannese2010). In most studies on cultured sensory ganglia the focus was on the neurons, and SGCs were largely ignored. Recently, a number of investigations were conducted on cultured SGCs from trigeminal ganglia (Ceruti et al., Reference Ceruti, Fumagalli, Villa, Verderio and Abbracchio2008; Suadicani et al., Reference Suadicani, Cherkas, Zuckerman, Smith, Spray and Hanani2010), dorsal root ganglia (DRG) (Thippeswamy and Morris, Reference Thippeswamy and Morris2001; Bradman et al., Reference Bradman, Arora, Morris and Thippeswamy2010; Gu et al., Reference Gu, Chen, Zhang, Li, Wang and Huang2010; Ng et al., Reference Ng, Wong and Wise2010) and nodose ganglia (Shoji et al., Reference Shoji, Yamaguchi-Yamada and Yamamoto2010). However, there is no detailed account on the effect of culturing on these cells. A major feature of SGCs is their close apposition to the neurons, and because cultured cells tend to migrate and alter their properties, it is essential to better understand how SGCs behave in culture. The aim of this work was to characterize phenotypic changes of SGCs from trigeminal ganglia of adult mice in tissue culture. We followed these cells for up to 14 days and observed profound morphological and immunohistochemical changes in them.
OBJECTIVE
To learn about changes that SGCs undergo in culture.
METHODS
Animals
Mice (Balb/c, 2–6 months old, M/F ratio 1:1) were used. Ganglia from different animals were not mixed. The procedures were approved by the Animal Care and Use Committee of the Hebrew University-Hadassah Medical School and adhered to the guidelines of the International Association for the Study of Pain and conform to the NIH standards for the care and use of laboratory animals.
Primary culture of trigeminal ganglion cells
Animals were killed with CO2 and the trigeminal ganglia were removed. They were cleaned from connective tissue and blood vessels and transferred to a 1.5 ml vial containing 1.5 mg ml−1 collagenase type 1A (Sigma-Aldrich Corp, St. Louis, MO, USA) in Krebs solution, having the following composition (in mM): NaCl 120.9, KCl 5.9, NaHCO3 14.4, MgSO4 2.5, NaH2PO4 1.2, CaCl2 2.5 and glucose 11.5; pH 7.35. The vial was placed is a tilting bath (at 100 min−1) for 60 min at 37°C. Following that, the collagenase solution was replaced with MEM-alpha growth medium (Biological Industries, Israel) containing 10% fetal bovine serum, 100 units ml−1 penicillin G sodium salt, 0.1 µg ml−1 streptomycin sulfate and 0.25 µg ml−1 amphotericin B (all from Biological Industries, Israel). The ganglia were then triturated by repeated pipetting until complete tissue homogenization, and placed in MatTek glass-bottomed dishes (14 mm diameter; MatTek Corp., Ashland, MA, USA). The dishes were not coated; our previous experience is that neurons and glial cells of peripheral ganglia from adult mammals grow well on uncoated glass (Hanani et al., Reference Hanani, Xia and Wood1994; Suadicani et al., Reference Suadicani, Cherkas, Zuckerman, Smith, Spray and Hanani2010). The dishes were placed in a humidified 5% CO2 incubator at 37°C and the medium was changed at least twice a week. Observations were performed at times between 4 h and 14 days of culturing.
The cultures were observed using an inverted microscope (Nikon Diaphot TMD, Tokyo, Japan) equipped with phase optics. For continuous long-term (4–24 h) observations, the dishes were placed on the stage of the inverted microscope within a home-made chamber where the temperature was maintained at 34–36°C and humidity at around 100%. Gas mixture of 95% O2/5% CO2 was blown over the dish to maintain pH around 7.3. Time lapse photography (every 10 min for periods of 4–24 h) was performed using Cool snap HQ CCD camera (www.photometrics.com), and Image Pro Plus software (MediaCybernetics, Bethesda, MD, USA).
Immunohistochemistry
The cultures were fixed in 4% paraformaldehyde for 10 min at room temperature, washed in phosphate-buffered saline (PBS) and then incubated for 1.5 h at room temperature in blocking solution containing 5% bovine serum albumin (BSA, Sigma) and 0.4% Triton X-100 in PBS. Polyclonal primary antibodies against P2X7 receptor (APR-004, Alomone Labs, Jerusalem, Israel) or against glutamine synthetase (sc-6640, Santa Cruz Biotechnology, Santa Cruz, CA, USA) were diluted 1:400 in 1% BSA in PBS with 0.4% Triton X-100 and incubated overnight at 4°C. Cultures were washed in PBS with 0.4% Triton X-100 and incubated with secondary antibodies DyLight 549-conjugated donkey anti-goat, or anti-rabbit (Jackson ImmunoResearch, West Grove, PA), diluted 1:1500 in PBS containing 0.4% Triton X-100 for 1 h at room temperature. Cultures were washed in PBS with 0.4% Triton X-100, then finally washed in PBS and visualized using an upright microscope (Axioskop FS2, Zeiss, Jena, Germany), equipped with epifluorescent illumination and a digital camera (Penguin 600CL, Pixera, Los Gatos, CA, USA). Controls were obtained by omitting the primary antibody. Cell nuclei were stained with 4 µM 4′-6-diamidino-2-phenylindole (DAPI; Sigma-Aldrich).
Confocal microscopy
Imaging was performed using a confocal microscope (Olympus FV-1000, Japan), equipped with an IX81 inverted microscope. A 40X/1.3 oil immersion objective was used.
DAPI was scanned using a 405 nm laser line for excitation and a 430–470 nm emission filter. DyLight 549 was scanned using a 543 nm laser line for excitation and a 560–620 nm emission filter.
Cell counting
The number of SGCs around individual neurons was obtained counting nuclei stained with DAPI and for glutamine synthetase under a fluorescence microscope. For each time point between 7 and 15 cultures were used, obtained from 5–10 animals. In the phase optics study of the cultures, for each time point we used at least five different cultures. To obtain cell densities, ten fields per dish were randomly selected per culture (in a total of 4–5 cultures per time point).
Statistics
One-way analysis of variance with Tuckey's post-test was used to analyze data obtained in the imaging experiments; P < 0.05 was considered as statistically significant.
RESULTS
We examined the cultures under phase optics at 4 h, 1, 2, 7 and 14 days from culturing. We noted four main stages in the development of the cultures:
Stage 1 (0–6 h in culture)
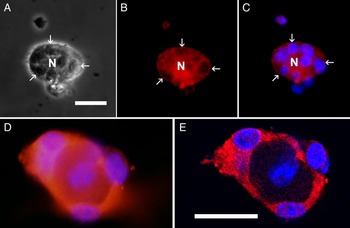
Two cell types were observed, neurons and the surrounding SGCs (Fig. 1A). With phase optics, neurons were easily identified owing to their rounded shape and large size. SGCs were identified on the basis of their smaller size and location in contact with the neurons (Cameron-Curry et al., Reference Cameron-Curry, Dulac and Le Douarin1993; Ceruti et al., Reference Ceruti, Fumagalli, Villa, Verderio and Abbracchio2008), and also by staining for the glial marker glutamine synthetase (Weick et al., Reference Weick, Cherkas, Härtig, Pannicke, Uckermann, Bringman, Tal, Reichenbach and Hanani2003), see Fig. 1. Optical sections clearly showed that glutamine synthetase immunoreactivity was located only in SGCs (Fig. 1E). DAPI staining also helped in cell identification because neuronal nuclei were large, but faintly stained, whereas glial nuclei were smaller and brighter. At this stage, most SGCs were in very close apposition to the neurons. Comparing phase optics images to those of nuclear staining with DAPI revealed that not all SGCs were visible under phase optics, due to stacking of these cells. Using DAPI staining, we determined that the mean number of SGCs around a single neuron was 4.6 (Fig. 2A). Only 0.4% of the neurons had no associated SGCs (Fig. 2B).
The organization of SGCs around neurons 4 h after culturing dissociated mouse trigeminal ganglia. (A) Phase optics. A neuron (N) is surrounded by SGCs, three of which are marked with arrows. SGCs are in close contact with the neuron and form a tight envelope around it, as seen in the intact ganglia. (B) The same field was photographed to show immunostaining for glutamine synthetase (red). The glutamine synthetase staining is seen as a rim around the SGC nuclei. (C) Both glutamine synthetase and DAPI (blue) staining are shown to demonstrate SGC nuclei. DAPI staining indicates the presence of 13 SGCs around the neuron. (D) Another example of a neuron–glia unit, stained for glutamine synthetase. (E) The same unit as in (D) was imaged with a confocal microscope. An optical slice in the middle of the neuron shows that only the glial envelope is immunopositive for glutamine synthetase. Scale bar in (A) 20 µm, applies to (A–C). Scale bar in (E) 20 µm, applies also to (D).

The number of glial cells in close contact with the neurons changes with time in culture. The numbers were determined by staining cell nuclei with DAPI. (A) The number of glial cells around the neurons was maximal 4 h after culturing, declined by nearly 50% at two days, and then recovered at 14 days. The asterisks denote P < 0.05 compared with 4 h. (B) The number of neurons without glial cells around them. This number was minimal at 4 h, and reached maximum at 2 days and then declined at days 7 and 14. For 2–14 day time points 280–373 cells were counted, and for the 4 h point, 68 cells. Data were obtained from 3–10 cultures, obtained from 2–6 mice.

Stage 2 (8–30 h in culture)
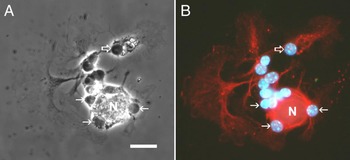
Because in the in vivo situation SGCs are defined as those that are in close contact with the neurons, we focused only on changes in the immediate vicinity of neurons. At this stage, cells started sending processes, most of which were fan-like and flat, but others were elongated and thin (Fig. 3). Staining for glutamine synthetase showed that these processes largely originated from SGCs surrounding the neurons. Some glial cell bodies migrated away from the neurons and were seen at a short distance (up to about 50 µm) from the neurons. These cell bodies belonged to SGCs, as can be clearly seen by glutamine synthetase staining. Still, the SGC envelopes around the neurons appeared intact, indicating that many SGCs were still apposed to the neurons. The number of glial cells around individual neurons was quantified with DAPI staining (Fig. 2). It should be emphasized that only at stage 1 and 2, glial cells around neurons are unequivocal SGCs. From stage 3 on, the glial cells (even those surrounding the neurons) lose some of the SGC phenotype, and therefore are not defined as SGCs.
Identification of SGCs in 24-h-old culture. (A) Phase contrast image showing a neuron surrounded by 11 SGCs; three of which are marked with arrows. (B) Cells were immunostained for glutamine synthetase (red) and with the nuclear marker DAPI (blue). Note the complete SGC sheath around the neuron. Several SGCs apparently had migrated a short distance from the neurons (an example is marked with an empty arrow), but they clearly express glutamine synthetase. SGCs send flat processes, some of which are fan-like. The DAPI staining indicates the presence of 13 SGCs, six of which are in contact with the neuron. Scale bar: 20 µm.

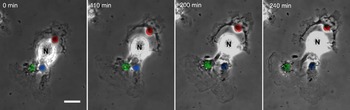
Time-lapse photography provided information on the dynamics of cell migration. As seen in Fig. 4, SGCs tended to move only a short distance from the neurons, or remained attached to them. We found that in all cases (N = 25), both SGCs and neurons were in constant motion, and during the several hours of observation all the cells, even those SGCs that remained attached to the neurons, altered their position and morphology.
Time-lapse photography of a 24-h culture. Three SGCs around a neuron (N) are marked by color. These cells send flat processes. The SGCs marked red and green move away from the neuron during the 4 h of photography, whereas the SGC marked blue is quite static. Scale bar: 20 µm.

Stage 3 (2–7 days in culture)
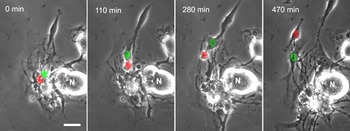
Two prominent changes were observed at this stage: the migration of a large proportion of SGCs away from the neurons and the decline in glutamine synthetase expression. We followed cell migration using time-lapse photography, which revealed that cells were in constant motion, with the main change being migration of SGCs from their neurons (Fig. 5). Whereas SGCs traveled in straight lines at up to 40 µm/h, neurons moved more slowly, covering only up to 25 µm/h, and also rotated around themselves. Usually SGCs sent a flat membrane which moved back and forth. In agreement with the observation that SGCs migrate from the neurons, the number of glial cells around a given neuron declined by nearly 50% on day 2, and the number of neurons without any SGCs reached maximum on that day (although at a low value of about 6%), see Fig. 2. The time lapse photography did not reveal any SGC division.
Time-lapse photography of a 3-day culture. SGCs are much more mobile than neurons. Two SGCs were labeled with color to facilitate their identification. At time zero these cells were very close to the neuron, and during the nearly 8 h of observation both migrated from the neuron and traveled about 50 µm. At the end of the photography period, the cell marked red was transformed from typical SGC into spindle-shaped cell. The cell marked green was not yet fully transformed. Scale bar: 20 µm.

At this stage there was a clear proliferation of glial cells. Whereas at day 1 in culture there were 13,000 glial cells per dish, at day 7 we counted 103,000 glial cells per dish (85 and 673 per mm2, respectively). We also compared the number of neurons at 1 and 7 days after culturing. This number declined form 1500 to 550 per dish. This corresponds to a decline in density from 9.7 to 3.6 neurons per mm2.
As SGCs migrated from the neurons their morphology was quite variable, but could assume two main forms. Some cells extended flat membranes and developed irregular multipolar structures, whereas others became spindle-shaped, with a thin process at each pole of the cell (bipolar cells; Fig. 5). Spindle-shaped cells constituted about 75% of the total glial population. Eventually, virtually all glial cells appear bipolar (see below).
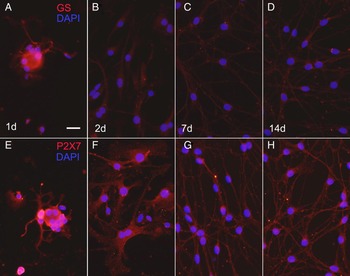
Another major change in SGCs is the decline in the staining for the glial marker glutamine synthetase. At day 2, staining for glutamine synthetase was much weaker than seen at day 1, and did not recover even at day 14 (Fig. 6A–D). For comparison we stained the cultures for another protein, P2X7 receptor, which is quite specific for SGCs (Chessell et al., Reference Chessell, Hatcher, Bountra, Michel, Hughes, Green, Egerton, Murfin, Richardson, Peck, Grahames, Casula, Yiangou, Birch, Anand and Buell2005; Kobayashi et al., Reference Kobayashi, Fukuoka, Yamanaka, Dai, Obata, Tokunaga and Noguchi2005; Zhang et al., Reference Zhang, Han, Faltynek, Jarvis and Shieh2005). In contrast to the decline seen with glutamine synthetase, the staining for P2X7 receptor changed very little from day 1 to day 14 (Fig. 6D–H).
The expression of glutamine synthetase declines with time in culture. (A–D) Cultures were stained for glutamine synthetase (red) at time points 4 h to 14 days in culture. DAPI was used to stain nuclei. Note the striking decline in staining for glutamine synthetase from 2 days in culture onwards. (E–G) For comparison, cultures were stained for P2X7 receptor, which showed very little change during the same period. Scale bar: 20 µm.

Stage 4 (7–14 days in culture)
After 1 week in culture, the number of spindle-shaped cells increased and they covered most of the surface of the dish (Fig. 7). Typically, these cells were arranged with their long axes oriented in the same direction, and sometimes formed multilayers. In some regions, these cells aggregated into clusters. In these cultures fibroblasts became quite prominent. Fibroblasts are identified by being larger than the other cell types, their irregular shape, large nucleus and numerous cytoplasmic granules. As shown in Fig. 7A, neurons were surrounded by glial cells, whose number around given neurons recovered close to the level seen in 4 h cultures (Fig. 2). However, these cells cannot be regarded as genuine SGCs, because the level of glutamine synthetase in them was very low.
Phase contrast images of the cultures at 14 days. (A) A neuron is closely associated with glial cells. The majority of cells in the culture are spindle-shaped. (B) Lower magnification micrograph showing that most of the spindle-shaped cells are oriented in the same direction. (C) In some regions of the culture the cells tend to group together. Two fibroblasts (fib) are also present. Scale bars: 20 µm.

CONCLUSIONS
After one day in culture SGCs retain most of their original characteristics. However, from day 2 onwards in culture they migrate away from the neurons, change their morphology and largely lose the expression of glutamine synthetase.
DISCUSSION
Although sensory ganglia have been studied in culture for many years, a major component of these cultures – SGCs – has received very little attention. In this study, we followed mixed neuron–SGCs cultures for up to 14 days in culture and showed that the organization of SGCs around neurons, as well as their morphology and chemistry is not maintained over time. Our results show that SGCs display a high degree of plasticity in culture.
We found that several essential features of SGCs are altered in culture over time: (1) SGCs in situ wrap around individual neurons, and in culture they tended to migrate away from the neurons. (2) The expression of glutamine synthetase in SGCs declined rapidly in culture, whereas that of P2X7 receptors was quite stable. (3) After migrating away from the neurons, most SGCs assumed a spindle shape. After 7 days in culture, these spindle-shaped cells aligned and formed three-dimensional structures and sometimes formed clusters.
In several previous studies, it was claimed that cultured sensory ganglia contain largely spindle-shaped cells that were described as Schwann cells (e.g., Ninomiya et al., Reference Ninomiya, Barakat-Walter and Droz1994; Li et al., Reference Li, Sliwkowski, Lo and Mather1996). The identification as Schwann cells was based on the presence of the glial markers GFAP and vimentin; however, these proteins are also detected in SGCs (Jessen and Mirsky, Reference Jessen and Mirsky1983; Jessen et al., Reference Jessen, Morgan, Stewart and Mirsky1990), and therefore cannot serve as exclusive Schwann cell markers. The spindle morphology of the cells was also considered as a Schwann cell feature, but our time-lapse observations have shown that SGCs can acquire such morphology.
Fex Svenningsen et al. (Reference Fex Svenningsen, Colman and Pedraza2004) have shown that SGCs from embryonic rat DRG can differentiate into Schwann cells, oligodendrocytes and astrocytes. This is consistent with the observation that in cultures of quail DRG, SGCs start to express Schwann cell myelin protein, which is normally expressed only in Schwann cells (Cameron-Curry et al., Reference Cameron-Curry, Dulac and Le Douarin1993). This observation is consistent with the present observation that SGCs acquire Schwann cell-like morphology. More recent work indicated that SGCs can function as progenitor cells in rat DRG and give rise to stem cells from which neurons, Schwann cells and smooth muscles can be generated (Arora et al., Reference Arora, Cosgrave, Howard, Bubb, Quinn and Thippeswamy2007; Li et al., Reference Li, Say and Zhou2007). These investigations highlight the potential of SGCs to differentiate into other cell types. Our results, showing that after several days in culture the phenotype of SGCs apparently changed, are in accord with this conclusion, although the exact cell type into which SGCs transform is not clear.
The defining and most unique feature of SGCs is the envelope they form around neurons (Pannese, Reference Pannese1981; Cameron-Curry et al., Reference Cameron-Curry, Dulac and Le Douarin1993; Hanani, Reference Hanani2005). Therefore, their migration away from the neurons is a major phenotypic change. We followed individual cells visually using time-lapse photography, rather than relying exclusively on immunostaining, and this yielded the unequivocal conclusion that SGCs migrated from the neurons and completely changed their morphology. These observations were complemented by staining for the SGC marker glutamine synthetase, which showed that also protein synthesis in SGCs changes in culture. In short-term cultures (1 day), the SGC phenotype is very similar to that in freshly isolated cells. This includes the close apposition between most SGCs and neurons, the morphology of SGCs and the presence of glutamine synthetase and P2X7 receptors. In older cultures, SGCs contained greatly reduced levels of glutamine synthetase that is a highly important enzyme because it converts glutamate into glutamine, which is then supplied from glial cells to the neurons (Norenberg and Martinez-Hernandez, Reference Norenberg and Martinez-Hernandez1979). Therefore, from stage 3 (2–7 days in culture) onwards these cells can no longer be considered as genuine SGCs. This decline in glutamine synthetase content does not seem to be related to the changes in the proximity of SGCs to the neurons, because the decline was seen in both SGCs close and at some distance from the neurons.
In contrast to our results on the decline over time in glutamine synthetase expression, Capuano et al. (Reference Capuano, De Corato, Lisi, Tringali, Navarra and Dello Russo2009) observed glutamine synthetase in SGCs from rat trigeminal ganglia that were cultured for 6–7 days. This difference may be explained by the different methods and species, but it is more likely that the reason is that these authors used cultures from newborn animals, whereas we used adults. As discussed above, SGCs from embryonic ganglia have the ability to differentiate into astrocytes and other cell types. As astrocytes normally express glutamine synthetase, this may provide at least a partial explanation for the different results.
The results in Fig. 2 provide a quantitative assessment of the number of SGCs surrounding neurons and also of their migration from the neuron. At 4 h the average number of SGCs around a given neuron is 4.6. After 2 days in culture this number declined to about 2, and nearly fully recovered at day 14. This may indicate an initial migration followed by re-association between neurons and SGCs. It should be added, however, that although close association of SGCs and neurons is a major hallmark of SGCs, the near absence of glutamine synthetase in them at stages 3 and 4 indicates that these cells cannot be considered as typical SGCs. Therefore, in studies using older cultures, regarding these cells as SGCs may be incorrect. Moreover, the interactions between these cells and neurons may differ from those occurring in intact ganglia and in young cultures, and therefore neurons in young and old cultures may not have identical characteristics.
On the basis of our results, in short-term cultures, glial cells surrounding neurons are genuine SGCs. Such cultures offer several distinct advantages for studying neuron–SGCs interactions and SGC pharmacology, as has been done recently (Ceruti et al., Reference Ceruti, Fumagalli, Villa, Verderio and Abbracchio2008; Suadicani et al., Reference Suadicani, Cherkas, Zuckerman, Smith, Spray and Hanani2010; Kushnir et al., Reference Kushnir, Cherkas and Hanani2011). In older cultures the identity of glial cells is less well defined, but they display some important Schwann cell characteristics.
ACKNOWLEDGEMENTS
Supported by the Israel Science Foundation (Grant No. 212/08), by the US-Israel Binational Science Foundation (BSF, Grant No. 2007311) and by the Israel Cancer Association, funded from Golf Proceeds.
Conflict of interest
None.