Introduction
New X-ray radiation sources of high-intensity and ultra-short duration in the attosecond range have a significant impact in novel applications in many fields of science (Tzallas et al., Reference Tzallas, Charalambidis, Papadogiannis, Witte and Tsakiris2003; Hu and Collins, Reference Hu and Collins2006; Chu and Lin, Reference Chu and Lin2010; Sansone et al., Reference Sansone, Poletto and Nisoli2011; Faenov et al., Reference Faenov, Pikuz, Vergunova, Pikuz, Skobelev, Andreev, Zhidkov and Kodama2017 ). Laser-driven X-ray sources are commonly involved in the study of the structural dynamics in fields like physics, chemistry and biology. Many processes such as lattice dynamics, chemical reactions, phase transitions, molecular dynamics or surface processes require a time resolution on a femtosecond time scale. Structured targets of random or periodical modulations have proved having a higher efficiency on the laser energy coupling and demonstrated the generation of enhanced X-ray yield (Nishikawa et al., Reference Nishikawa, Nakano, Oguri and Uesugib1999; Kulcsár et al., Reference Kulcsár, Al Mawlawi, Budnik, Herman, Moskovits, Zhao and Marjoribanks2000; Fazeli et al., Reference Fazeli, Mahdieh and Tallents2011; Cerchez et al., Reference Cerchez, Swantusch, Toncian, Zhu, Prasad, Toncian, Rödel, Jäckel, Paulus, Andreev and Willi2018). On route to create high-energy radiation sources, the higher harmonics (HH) generation by plasmas driven by ultra-short, femtosecond laser pulses confirmed to be a very promising option (Murnane et al., Reference Murnane, Kapteyn, Rosen and Falcone1991; Mourou et al., Reference Mourou, Tajima and Bulanov2006). Hence extensive research effort worldwide is presently dedicated to investigate laser-driven XUV/soft X-ray sources including HH generation in underdense (Paul et al., Reference Paul, Toma, Breger, Mullot, Auge, Balcou, Muller and Agostini2001) or overdense plasmas (Teubner et al., Reference Teubner, Gibbon, Altenbernd, Oberschmidt, Förster, Mysyrowicz, Audebert, Geindre and Gauthier1999, Reference Teubner, Eidmann, Wagner, Andiel, Pisani, Tsakiris, Witte, Meyer-ter-Vehn, Schlegel and Förster2004; Földes et al., Reference Földes, Kocsis, Racz, Szatmari and Veres2003; Baeva et al., Reference Baeva, Gordienko and Pukhov2006; Dromey et al., Reference Dromey, Zepf, Gopal, Lancaster, Wei, Krushelnick, Tatarakis, Vakakis, Moustaizis, Kodama, Tampo, Stoeckl, Clarke, Habara, Neely, Karsch and Norreys2006). Higher order harmonics have been recorded in case of solid, planar targets irradiated by high-intensity, relativistic laser pulses. Two generation mechanisms have been proposed: coherent wake emission (Teubner et al., Reference Teubner, Gibbon, Altenbernd, Oberschmidt, Förster, Mysyrowicz, Audebert, Geindre and Gauthier1999, Reference Teubner, Eidmann, Wagner, Andiel, Pisani, Tsakiris, Witte, Meyer-ter-Vehn, Schlegel and Förster2004) and relativistic oscillating mirror (Baeva et al., Reference Baeva, Gordienko and Pukhov2006; Behmke et al., Reference Behmke, an der Brügge, Rödel, Cerchez, Hemmers, Heyer, Jäckel, Käbel, Paulus, Pretzler, Pukhov, Toncian, Toncian and Willi2011). However, irrespective of the emission mechanism, the high-order harmonic radiation originating from flat overdense targets is emitted in the laser pulse specular direction having a divergence of 10s mrad (Dromey et al., Reference Dromey, Adams, Hörlein, Nomura, Rykovanov, Carroll, Foster, Kar, Markey, McKenna, Neely, Geissler, Tsakiris and Zepf2009).
Novel targets with particular geometries such as gratings/periodic modulations have recently been considered for the efficient generation of monochromatic, high-energy radiation along the target surface. By employing the diffractive properties of a target with periodic modulations, the control of the emitted radiation such as the spectral separation and/or an increased efficiency of the radiation with a specific wavelength from the HH beam have been theoretically demonstrated (Lavocat-Dubuis and Matte, Reference Lavocat-Dubuis and Matte2009, Reference Lavocat-Dubuis and Matte2010; Yeung et al., Reference Yeung, Zepf, Geissler and Dromey2011; Fedeli et al., Reference Fedeli, Formenti, Cialfi, Sgattoni, Cantono and Passoni2018). The angular distribution of the mth-order harmonic emitted by a grating of groove spacing a irradiated with a laser pulse of λL wavelength is described by the diffraction formula
 $$a\cdot ({\rm sin\theta} + {\rm sin\alpha} ) = {\rm \lambda} _{\rm L}\cdot \displaystyle{n \over m}$$
where θ and α are the laser pulse incidence angle and the diffraction angle, respectively, and n is the diffraction order. Thus, the grating interference effects capacitate the HH emission along various directions, separated from the specular direction and allow the isolation of specific HH order from the laser fundamental directly from generation point at the target surface. The first evidence of laser HH emission up to 45th order (in XUV range) by using grating targets was presented in Cerchez et al. (Reference Cerchez, Giesecke, Peth, Toncian, Albertazzi, Fuchs, Willi and Toncian2013). The study demonstrates a clear dependence of the high harmonic spectral composition on grating periodicity and vacuum-target interface shape. Moreover, numerical investigations pointed out that the laser focus parameters have a strong effect on the emission angle of HH and thus, can furthermore contribute to the spectral control of the HH emitted along at angles close to the target surface.
Here we present experimental and numerical investigations of the lower order harmonics (2nd and 3rd) of an 800 nm wavelength laser pulse emitted in the UV spectral range from grating targets interacting with laser pulses at relativistic intensities (~ 1020 W/cm2). Our results indicate that laser harmonics are emitted with very different relative efficiencies and the effect depends on the interaction conditions such as grating geometry, laser contrast, and observation angle. For example, the second-order harmonic radiation (λ2 ≃ 397 nm) can be emitted with an almost two orders of magnitude higher efficiency by a grating of a = 410 nm periodicity along the observation angle compared with flat targets and gratings of different geometries, while in case of a grating a = 480 nm and the same interaction conditions, the third harmonic radiation (λ3 ≃ 263 nm) can be emitted. Two-dimensional numerical simulations fairly agree with the experimental findings and confirm the radiation interference effect and grating periodicity influence on the HH emission efficiency. Thus, with an appropriate selection of the grating target geometry, this method proves to offer a very robust and effective approach to control composition of HH spectrum and the relative efficiency of the lower order harmonics.
Experimental setup
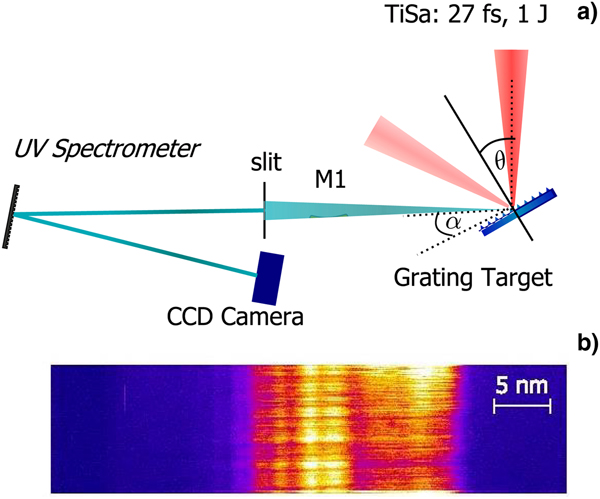
The experiments have been conducted at Arcturus laser facility (Heinrich-Heine-University Düsseldorf Düsseldorf) (Giesecke, Reference Giesecke2013; Willi et al., Reference Willi, Behmke, Gezici, Hidding, Jung, Königstein, Pipahl, Osterholz, Pretzler, Pukhov, Toncian, Toncian, Heyer, Jäckel, Kübel, Paulus, Rödel, Schlenvoigt, Ziegler, Büscher, Feyt, Lehrach, Ohm, Oswald, Raab, Ruzzo, Seltmann and Zhang2009) by employing the 100 TW Ti:Sa laser system. For this experiment, the laser pulses of λL = 790 nm central wavelength were amplified to an energy of up to E = 2.5 J and compressed to τ = 27 fs (FWHM) pulse duration. The pulse contrast cleaning was achieved by employing a single plasma mirror system (Rödel et al., Reference Rödel, Heyer, Behmke, Kübel, Jäckel, Ziegler, Ehrt, Kaluza and Paulus2011) which leads to a contrast enhancement down to 10−12 on a 100s of ps time scale and to 10−10 at 10s of ps before the main peak pulse. The laser pulse was focused by means of an F/2 off-axis parabolic mirror to a 2 μm focal spot diameter onto the grating target reaching an intensity of I = 2.5 · 1020 W/cm2. The laser incidence angle was θ = 25° to the target normal and the grating's grooves were orientated transversally to the laser polarization axis. Different gratings with periodicities of 250 nm (G1), 410 nm (G2), and 480 nm (G3) were used. The vertical amplitude of the gratings employed in the experiment was between 50 and 90 nm. The lower order harmonics (2nd and 3rd) were detected at an angle of α = 25° from the target surface by using a McPherson (type 225) spectrometer. The radiation source is imaged onto the spectrometer entrance slit by a spherical mirror (M1) of 8 m radius of curvature. The spherical grating with 600 lines/mm and a focal length of 1 m dispersed the spectrum onto an Andor CCD camera with a deviation of 15° between the entrance slit and the dispersion plane, with a linear dispersion of 1.66 nm/mm. In Figure 1, the target-laser arrangement, the UV spectrometer set-up, and a spectrum of the second harmonic emission are shown. For preserving the structured target modulations during the irradiation with relativistic pulses, a high contrast of the relativistic laser pulse is required. In case of the experiments presented here, we estimated the preplasma scale length of the electron density L = n e|∂n x/∂x|−1 at the critical density n c employing the MULTI-fs hydrodynamic code (Ramis et al., Reference Ramis, Schmalz and Meyer-Ter-Vehn1988) of about L = 30 nm, a value smaller compared with the grating vertical modulation h employed in the experiment (Cerchez et al., Reference Cerchez, Giesecke, Peth, Toncian, Albertazzi, Fuchs, Willi and Toncian2013).
(a) Schematic representations of the experimental arrangement and the UV spectrometer setup. (b) A raw spectrum of the second-order harmonic.

Experimental results
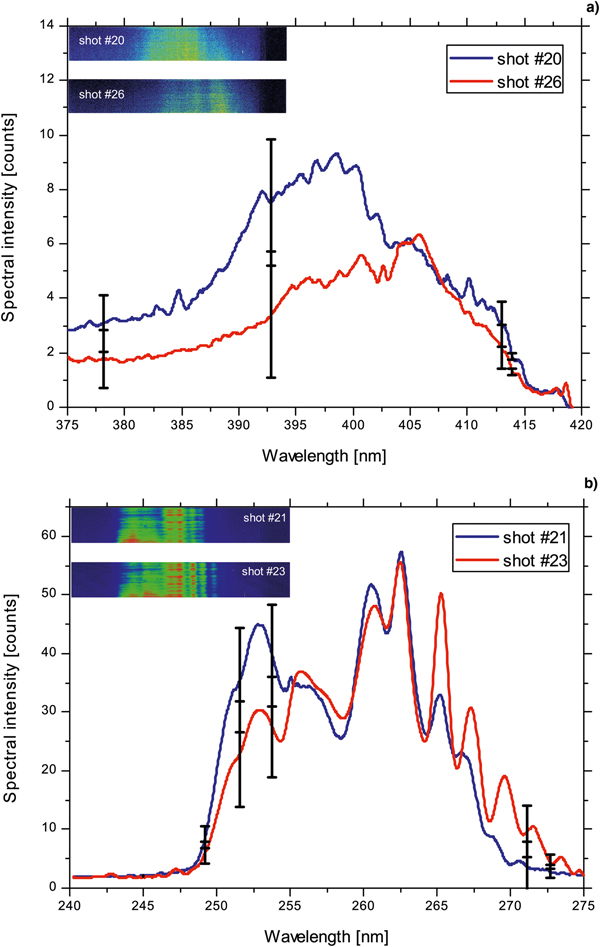
In Figure 2, experimental results of the 2nd- and 3rd-order harmonic emission for different grating targets compared with a flat target are illustrated. Figure 2a shows spectra of the second-order harmonic emission. The inset depicts the enlarged 2nd harmonic spectra for the flat target and gratings G1 and G3 which are less efficient compared with the grating G2. All spectra were obtained under the same experimental conditions and the spectral intensity is expressed in number of counts from the Andor CCD camera. An offset value of 398 counts was subtracted for all spectra. By employing a flat glass target with a surface quality of λ/20, the 2nd-order harmonic was detected at the same observation angle with rather low efficiency (black spectrum in Fig. 2a), while emission of the 3rd-order harmonic could not be detected. The results for the grating G1 were similar (orange spectrum) where the 2nd harmonic was emitted with a maximum of eight counts in four shots, while the 3rd harmonic could not be recorded. In case of the grating target G2 both, the 2nd- and 3rd-order harmonics, were emitted intensively (blue spectra in Fig. 2a and 2b). The emission efficiency of the 2nd harmonic from G2 was about seven times higher than for the other gratings and flat targets. The comparison of the absolute count numbers of the investigated harmonics reveals that the maximum of the spectral intensity of the 2nd-order harmonic is a factor of 5 larger than the maximum number of counts of the 3rd harmonic. By using the grating G3, with only a 70 nm larger wavelength compared with the grating G2, the expected lower emission efficiency of the 3rd harmonic compared with the 2nd was reversed, that is, the signal of the 3rd harmonic was by factor of six higher than the 2nd order (see Fig. 2, red curves). The enhancement of the third-order harmonic was not been observed and is a direct consequence of the effect of the grating periodicity on the efficiency and angular distribution of the different harmonic orders. The reproducibility of the recorded data is illustrated in Figure 3. Plot (a) shows the spectral intensities of the second harmonic for two different shots and the maximum standard deviation for four evaluated shots is marked by the error bars. Thus, the tendency of the lower emission efficiency of the 2nd harmonic was the same for all the shots. The shot-to-shot variation of the third-order harmonic is depicted in part (b). The high number of counts for the third harmonic was obtained repeatedly. This supports the reproducibility of the strong emission of the third order compared with the second harmonic. The influence of the grating's groove orientation was tested in similar interaction conditions but with the grooves 90° rotated. No HH emission was recorded in this situation. In the similar experimental conditions as the investigations for grating targets, we recorded the plasma emission of a flat surface glass target (λ/20), and in also in this case no HH radiation was detected at the observation angle α = 25°.
Experimental spectra of low-order harmonic generated by grating targets. (a) Spectral intensities of the 2nd-order harmonic for different types of targets. The inset depicts a zoom into the spectral intensities of the second harmonic emission for the flat target and gratings G1 and G3. (b) Spectral intensities of the 3rd-order harmonic from grating G2 and G3. The spectra from the flat target and G1 are not shown, as no counts above the noise level were detected.

Examples of 2nd (a) and 3rd (b) order harmonic spectra emitted by the grating target G3 (a = 480 nm). The error bars marked on the spectra are calculated as the standard deviation of the recorded spectra. In the insets, the raw spectra are shown.

Numerical simulations
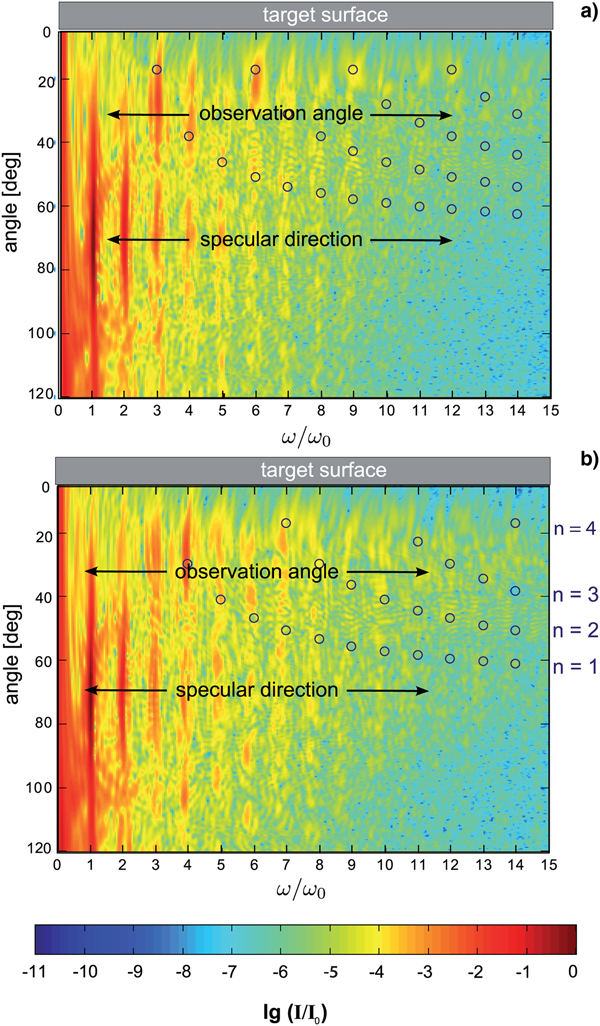
The specific effects which characterize the emission of the low-order harmonics by grating targets have been investigated numerically using the 2D PIC EPOCH code (Brady and Arber, Reference Brady and Arber2011). The simulation box size is 12λ × 16λ with 45 macro particles/cell having resolution of the grid of 166 cells/λ and 125 cells/λ, respectively. The laser pulse parameters have been considered similar with the experimental values while as a target, a sinusoidal grating structure with a thickness of 2 μm and an amplitude of 50 nm of ten times ionized aluminum was modeled. In Figure 4, the simulation box details are shown as the magnetic field B z perpendicular to the simulation planes in (a) and the electron density of the target in (b). The spectral distribution of the reflected radiation was obtained by a sampling method and a 2D Fourier transformation of the B z magnetic field over an angular range or for the specific observation angle. Figures 5 and 6 show the 2D simulation results for two gratings of periodicities similar to G2 and G3 used in the experiment as interferograms of the HH emission over the full angular range. In contrast with flat targets, where the HH are emitted on the specular laser direction (Teubner et al., Reference Teubner, Eidmann, Wagner, Andiel, Pisani, Tsakiris, Witte, Meyer-ter-Vehn, Schlegel and Förster2004; Baeva et al., Reference Baeva, Gordienko and Pukhov2006; Dromey et al., Reference Dromey, Zepf, Gopal, Lancaster, Wei, Krushelnick, Tatarakis, Vakakis, Moustaizis, Kodama, Tampo, Stoeckl, Clarke, Habara, Neely, Karsch and Norreys2006), in case of grating targets the HH orders are emitted with a much more complex angular distribution and relative efficiency. In Figure 5, the circles mark the harmonic orders and emission angles as predicted by the interference formula (1) for the first interference orders n = 1, 2, 3, 4. One can observe that for the grating target G3, the third harmonic can be predominantly found around the observation angle, whereas in case of G2, the fourth-order harmonic dominates the harmonic spectrum at the observation angle. The results demonstrate the direct effect of the grating periodicity on the angular distribution of various harmonic orders, and thus the capability of the grating geometry on influencing the HH spectral composition at a specific observation angle.
Simulation box used in the 2D PIC simulations with the EPOCH code. Laser shines onto the target from the left-hand side with α = 25°. In (a) is shown the magnetic field B z orthogonal to the laser polarization direction. In plot (b) the electron density and angular geometry of the interaction are presented. Both plots correspond to the same time step.

Spectra of the HH emission from grating targets over an angular range of 120° obtained with the EPOCH simulation code. The observation direction along the angle θ = 25° and the laser specular direction are indicated on the spectra. The relative intensities of HH radiation are presented as a function of the harmonic orders and emission angles. The circles mark the emission angles of the harmonics predicted by Eq. (1) and the integers n = 1,…,4 denote the different interference orders. The spectra correspond to: (a) a grating of periodicity a = 480 nm (G3) and (b) a grating of periodicity a = 410 nm (G2).

The spectral distributions of the higher harmonics emitted at α = 25° for grating targets of periodicities similar with the targets used in the experiment (a) and for a small grating periodicity compared to a flat target.

By extracting line-outs of these spectra at α = 25° (equivalent with the experimental observation angle), the numerical results and the experimental findings can be directly compared. In Figure 6a, the relative spectral intensity of HH orders for grating targets of periodicities similar with the experimental case is shown. For the grating G1 (a = 250 nm), the harmonic spectrum is dominated in the UV range by harmonic orders 5th–8th, while the spectrum obtained from G2 (a = 410 nm) is dominated by the emission of the 4th harmonic. In case of the later target, 2nd and 3rd harmonics are emitted with the similar efficiency, in agreement to the experimental results. A direct comparison will be drawn in the following. For the grating target G3 (a = 480 nm), the emission of the 3rd harmonic is by one order of magnitude more intense than the 2nd harmonic. This enhancement of the 3rd-order harmonic was also visible in the experiment. By changing the grating periodicity, the emission of selected harmonic orders can be enhanced or suppressed. The results of the simulations indicate the possibility of selecting several harmonic orders by changing the grating periodicity. The plot (b) of Figure 6 shows an efficient generation of the 2nd- and 3rd-order harmonic for a grating with a periodicity of a = 200 nm. Moreover, in comparison with a flat target, an enhancement of the HH emission up to two order of magnitude was calculated.
In Figure 7, the simulation results and experimental data are presented in comparison and the emission level is depicted for different grating periodicities at an observation angle α = 25°. The detected emission level in the experiment is given by the absolute number of counts at the CCD camera corrected for the spectrometer and camera efficiency, while the simulation results are depicted as relative values to the incoming intensity [lg(I/I 0)]. Usually, the emission efficiency drops with the harmonic order (Teubner et al., Reference Teubner, Eidmann, Wagner, Andiel, Pisani, Tsakiris, Witte, Meyer-ter-Vehn, Schlegel and Förster2004; Baeva et al., Reference Baeva, Gordienko and Pukhov2006; Dromey et al., Reference Dromey, Zepf, Gopal, Lancaster, Wei, Krushelnick, Tatarakis, Vakakis, Moustaizis, Kodama, Tampo, Stoeckl, Clarke, Habara, Neely, Karsch and Norreys2006), thus the recorded spectral intensity of the 3rd harmonic is lower than of 2nd. The same tendency was observed in the grating experiment and simulation for the flat target, grating G1 and G2. By changing the grating periodicity to 480 nm (G3), the result is completely different. Both, simulation and experiment show the higher efficiency of the third harmonic compared with the second harmonic for G3 at the investigated observation angle. The simulation results are in fair agreement with the experimental observations indicating a similar trend of the second- and third-order harmonics emission (Fig. 6a and 6b).
Overview and comparison of simulation and experimental results of the 2nd- (blue dots) and 3rd-order(red dots) harmonic emission for different grating periodicities and flat target at α = 25° represented as: (a) maximum counts obtained in the experiment and (b) the maximum emission intensity obtained by the 2D PIC simulations at the same observation angle as in the experiment.

Even though the 3rd harmonic was recorded at α = 25° with a higher yield than the 2nd order for the grating with 480 nm (Fig. 6a), it cannot be stated that the generation efficiency over the full angular distribution is higher. A tendency where which harmonic order can be found is defined by the interference formula. Nevertheless, the actual spectral energy distribution crucially depends on the interaction conditions, which are the focusing geometry of the laser, the preplasma scale length as well as the angle of incidence on the target. Numerical investigations of the UV and XUV harmonic generation from grating targets for different setups and in various interaction conditions have been performed and the results demonstrate the interplay between target geometry, laser wavefront curvature, and interference properties of the grating lead to a rather complex spectral structure (Cerchez et al., Reference Cerchez, Giesecke, Peth, Toncian, Albertazzi, Fuchs, Willi and Toncian2013; Giesecke, Reference Giesecke2013). Due to the strong target denting, more deviations from the interference model arise, as many more incidence angles have to be taken into account. A very high laser intensity distributed on a small focal spot size with an intermediate contrast leads to the destruction of the periodical structure of the target and thus to diminished interference properties of the gratings. It was found that the height of the protuberances does not change the spectral distribution (at α = 25°) significantly, as long as the preplasma scale length is small. However, for angles close to the target surface (<5°), the emitted radiation is possibly blocked by the height of the protuberances.
Conclusions
In summary, a new experimental method is demonstrated to generate higher order laser harmonics by employing periodic modulated targets (gratings). The experimental investigations prove that the high harmonics can be emitted under grazing emission angles separated from the laser fundamental radiation. The energy of certain harmonic orders is shifted apart from the specular direction of the laser and distributed over a larger angular range. Contrary to the HH emitted by flat targets where the entire high harmonics sequence is contained in the spectrum, we demonstrate in this manuscript that in case of grating targets the spectral composition of the spectrum depends on the laser–target interaction conditions. The right choice of laser incidence angle onto the target, grating longitudinal periodicity, and laser pulse contrast allows a selection of certain harmonic orders in particular in the emission direction. The method described here demonstrates a route to control the HH emission angle directly on the target, and therefore the spectral composition of the HH radiation at a distinct observation angle.
The research has been supported by the DFG Transregio SFB/TR18 and GRK 1203 programs.