

Not often does a rich developed country consider a fundamental restructuring of its healthcare system. The current discussions of healthcare reform in the United States provide a rare opportunity for policymakers to utilize academic evidence in the design of its healthcare system. Arguably, the optimal health system is one that results in the largest health gains per dollar spent, that is, the most efficient system.Footnote 1 Unfortunately, our knowledge of which health-system structures are most efficient is inadequate.
Interest in efficiency estimation of the healthcare system was sparked by two reports produced by the World Health Organization (WHO; Evans et al., Reference Evans, Tandon, Murray and Lauer2000; Tandon et al., Reference Tandon, Murray, Lauer and Evans2001). In both reports, the efficiency of healthcare systems was estimated for 191 countries using a frontier estimation approach. The reports culminated in rankings of healthcare systems; rankings that attracted a disproportionate amount of attention from public policy decision-makers.Footnote 2 Academic discussion focused on improving estimation methods (Pedersen, Reference Pedersen2002; Gravelle et al., Reference Gravelle, Jacobs, Jones and Street2003; Hollingsworth et al., 2003; Richardson et al., Reference Richardson, Wildman and Robertson2003; Greene, Reference Greene2004; Spinks and Hollingsworth, Reference Spinks and Hollingsworth2009) and conceptual approaches (Navarro, Reference Navarro2000; Pedersen, Reference Pedersen2002).
This literature left behind a number of questions. Among the most pressing is the question of what contributes to efficiency, and in particular, which organizational arrangements are associated with higher efficiency. Pedersen (Reference Pedersen2002) states that the WHO report: “…does not provide any answers as to why a country is located [in ranking] where it is and how its position can be changed.” Pedersen's questions are precisely the questions addressed here. This study estimates the determinants of efficiency of 21 OECD health systems.Footnote 3 Health systems are characterized along seven dimensions that shape a healthcare system, each of which is determined via discretionary health policy actions. The dimensions include: financing arrangements; public sector funding; patient cost sharing and insurance; physician remuneration methods; and gatekeeping arrangements. In each case, the estimation discerns whether a particular characteristic has a positive or negative impact on efficiency, so as to provide guidance in the selection of policy instruments.
The paper is organized as follows. Section 1 discusses literature on health-system efficiency, and literature on the relative merits of the seven health-system characteristics. Section 2 develops the stochastic frontier model, which allows for combining both strands of literature, and estimating the extent to which each health-system characteristics contribute to efficiency. Section 3 describes the data. Results are discussed in section 4, and concluding remarks are provided in section 5.
1 Literature
This study builds on a strand of literature, henceforth referred to as ‘efficiency literature’, which estimates efficiency at the health-system level using methods that have long been used in health literature to estimate production efficiency, and hospital efficiency. This efficiency literature is combined with a second strand of literature, henceforth referred to as ‘institutional arrangements literature’, which discusses the relative merits of various health-system structures.
1.1 Efficiency literature
The sparks that first ignited interest in efficiency estimations at the system level were two reports published by the World Health Organization (WHO) that estimate health-system efficiency for 191 countries between 1993 and 1997 (Evans et al., Reference Evans, Tandon, Murray and Lauer2000; Tandon et al., Reference Tandon, Murray, Lauer and Evans2001). The initial excitement was quelled by the follow-up literature on the shortcomings in the methodologies (Pedersen, Reference Pedersen2002; Gravelle et al., Reference Gravelle, Jacobs, Jones and Street2003; Hollingsworth and Wildman, Reference Hollingsworth and Wildman2003; Richardson et al., Reference Richardson, Wildman and Robertson2003; Greene, Reference Greene2004; Spinks and Hollingsworth, Reference Spinks and Hollingsworth2009) and conceptual approaches (Navarro, Reference Navarro2000; Pedersen, Reference Pedersen2002) used in the WHO reports.
The WHO authors use a panel-fixed effects model to create a production frontier. Because the WHO model assumes a time-invariant inefficiency term, it is later labeled as a deterministic frontier model to distinguish from a stochastic frontier model (or a true fixed effects model; Greene, Reference Greene2007a, Reference Greene2007b) Health outcome is modeled as the output of the production function, whereas health expenditures, their square and educational levels are used as the inputs. The same variables are used by Gravelle et al. (Reference Gravelle, Jacobs, Jones and Street2003), Hollingsworth and Wildman (Reference Hollingsworth and Wildman2003) and Greene (Reference Greene2004), who also adds further variables. Inefficiency is measured as the deviation of each country's performance from that of the highest performing country. Technical efficiency is defined as a country's actual performance as a percentage of its potential performance, where the measure of potential performance is based on the best performer in the sample.
Subsequent re-estimations compare the efficiency results of using parametric and non-parametric methods (Hollingsworth and Wildman, Reference Hollingsworth and Wildman2003) and competing model specifications (Gravelle et al., Reference Gravelle, Jacobs, Jones and Street2003). Both studies conclude that country rankings and efficiency scores are sensitive to the definition of efficiency and choice of model specification. The focus here is strictly on technical efficiency, which is estimated using the parametric approach of stochastic frontier modeling (described in section 2 – ‘The stochastic frontier model’).
Greene (Reference Greene2004) examines extensions to the WHO model and presents a more general flexible model that allows for the incorporation of both time and potential determinants of efficiency (Greene, Reference Greene2004). Greene's study surveys available panel data estimators and proposes methods of incorporating potential determinants of inefficiency into the estimation. A version of the general model is used in this paper. This study differs significantly from Greene's in the choice of potential explanations for system inefficiency. Greene includes income distribution, democratization, government effectiveness, income per capita, public financing of health care, OECD membership and tropical climate as potential explanations for variations in efficiency. The focus here is on institutional arrangements of health systems as discretionary policy tools (described in the next section – ‘Institutional arrangements literature’).
Or et al. (Reference Or, Wang and Jamison2005) use multilevel modeling techniques to assess the impact of medical-care resources on health outcomes, where medical-care resources are measured as the number of doctors per capita. The effects of structural system variables on the efficiency with which doctors improve health status are investigated. Their model differs substantially from mine in terms of estimation technique, measure of healthcare resources used and the data on the structural characteristics of health systems.
The conceptual basis for frontier and efficiency estimation is a health production function. The assumption of a positive relationship between health spending and health outcomes is questioned by some (Navarro, Reference Navarro2000; Pedersen, Reference Pedersen2002), but is not uncommon and forms the basis for a number of key studies (Cremieux, 1999; Nixon and Ulmann, Reference Nixon and Ulmann2006; Self and Grabowski, 2003; Joumard et al., Reference Joumard, Andre, Ninq and Chatal2008, Reference Joumard, Andre and Nicq2010). Results in the literature are not unambiguous. The relationship between health spending and health outcomes is significant in some studies (Cremieux et al., Reference Cremieux, Ouellette and Pilon1999; Gravelle, 2003; Or et al., Reference Or, Wang and Jamison2005; Nixon and Ulmann, Reference Nixon and Ulmann2006; Joumard et al., Reference Joumard, Andre, Ninq and Chatal2008, Reference Joumard, Andre and Nicq2010), but not significant in others (Self and Grabowski, Reference Self and Grabowski2003; Nixon and Ulmann, Reference Nixon and Ulmann2006). This is discussed in more detail in the Results section.
1.2 Institutional arrangements literature
The characterization of institutional arrangements used here builds on a functional framework developed by Kutzin (Reference Kutzin2001) and on empirical literature focused on the determinants of healthcare spending. The seven dimensions used in this study are: (i) financing system (Beveridge single-payer or Bismarck multi-payer);Footnote 4 (ii) cost-sharing requirements; (iii) gatekeeping arrangements; (iv) primary physician payment methods; (v) specialist payment methods; (vi) extent of public expenditure; and (vii) extent of insurance coverage for the population.
Across OECD countries two types of fund collection and pooling systems dominate: the Beveridge style single-payer tax-funded system and the Bismarck style multi-payer social insurance system funded through earmarked employer and employee contributions. The single-payer system has been advocated for its potential ability to achieve lower costs. In theory, the system should have lower administrative costs, a monopsony power that would allow for control over provider costs, and the general ability for the payer to limit resources devoted to health care (Glied, Reference Glied2009). Single-payer systems, however, might have lower access to health care (Gusmano et al., Reference Gusmano, Weisz and Rodwin2009) and restrict consumer choice (Hussey and Anderson, Reference Hussey and Anderson2003). Empirical support is weak. Glied (Reference Glied2009) finds that costs are moderately lower in single-payer systems (Glied, Reference Glied2009), while Barros (Reference Barros1998) finds no association between system type and expenditure growth. Bhat (Reference Bhat2005) finds that single-payer systems are more efficient, while others find the opposite (Gerdtham, 1998; Gerdtham and Lothgren, Reference Gerdtham and Lothgren2001). The results of these studies are discussed in more detail in the Discussion section.
In principle, consumer access and choice are also restricted by gatekeeping arrangementsFootnote 5 (Gusmano et al., Reference Gusmano, Weisz and Rodwin2009). On the other hand, gatekeeping improves coordination in a system and restricts unnecessary use of specialist services (Gusmano et al., Reference Gusmano, Weisz and Rodwin2009), all of which might lead to reduced overall healthcare costs (Delnoij et al., Reference Delnoij, Van Merode, Paulus and Groenewegen2000). Gatekeeping has been associated with lower utilization (Bolin et al., Reference Bolin, Lindgren, Lindgren and Lundborg2009), lower costs (Gerdtham, 1998) and higher efficiency (Bhat, Reference Bhat2005). In theory, gatekeeping arrangements work best when coupled with appropriate and effective physician incentives (Garcia Marinoso and Jelovac, Reference Garcia Marinoso and Jelovac2003; Gonzales, Reference Gonzales2009).
In theory, fee-for-service (FFS) payments are the most likely to result in overuse of services, capitation payments are the most likely to lead to cream skimming and unnecessary referrals, while salary payments are the most likely to lead to under-provision of care. The incentive effects can be balanced via a blending of methods. Further discussion of the relative merits of physician payment methods can be found in Jegers et al. (Reference Jegers, Kesteloot, De Greave and Gilles2002) or in Wranik and Durier-Copp (Reference Wranik and Durier-Copp2010).
Co-payments, a common form of cost sharing, are typically introduced for two reasons. One is to reduce pressures on government budgets in Beveridge-type systems. The second is to curb unnecessary use of care. Co-payments, however, create a financial barrier to access, and reduce the government's monopsony bargaining power. Many oppose co-payments on moral grounds, arguing that health care ought to be provided based on need, and not based on ability to pay (see, e.g. Weale and Clark, Reference Weale and Clark2010). Co-payments have been linked to lower utilization of care (Bolin et al., Reference Bolin, Lindgren, Lindgren and Lundborg2009) and to underuse of medications (Wagner et al., Reference Wagner, Heisler and Piette2008). In fact, user charges are bound to result in underuse of care rather than the curbing of unnecessary care whenever patients are not able to differentiate between care that is necessary and unnecessary (Thomson et al., Reference Thomson, Foubiser and Mossialos2010).
Institutional arrangements have been studied empirically as determinants of health expenditure.Footnote 6 Hansen and King (Reference Hansen and King1996) and Roberts (Reference Roberts1999) include the public proportion of healthcare spending as a determinant of spending; Barros (Reference Barros1998) includes financing and gatekeeping arrangements; Gerdtham et al. (1998) include the largest list of institutional arrangements and provide a comprehensive analysis of the impact of these arrangements on health-system costs; and lastly Gerdtham and Lothgren (Reference Gerdtham and Lothgren2001) include a list of institutional arrangements as potential determinants of cost efficiency. All use a panel set of OECD data (Hitiris and Posnett, Reference Hitiris and Posnett1992; Hansen and King, Reference Hansen and King1996; Barros, Reference Barros1998; Gerdtham et al., Reference Gerdtham, Jonsson, MacFarlan and Oxley1998; Roberts, Reference Roberts1999; Gerdtham and Lothgren, Reference Gerdtham and Lothgren2001). Appendix A provides a summary of the literature.
2 The stochastic frontier model
A stochastic frontier framework is used in the analysis. The stochastic frontier allows for the estimation of a potential level of outcome given expenditures in a country, where the deviation of the actual from the potential level is used in the computation of an inefficiency score. Extensions to the model allow for the incorporation of external and institutional variables that contribute to efficiency of a system (Battese and Coelli, 1995; Coelli et al., 2005; Greene, 2003, 2004, 2007a, 2007b, 2008; Hollingsworth and Peacock, 2008; Hollingsworth and Wildman, 2003; Pitt and Lee, 1981; Schmidt and Sickles, 1984; Spinks and Hollingsworth, 2009; Street, 2003).
An alternative framework also explored in the literature is data envelopment analysis (Hollingsworth and Wildman, Reference Hollingsworth and Wildman2003; Bhat, Reference Bhat2005). This approach is non-parametric and relies on linear programming methods. Its advantage is that it allows for the specification of multiple outputs of a system. Its disadvantage, however, is that it does not distinguish between inefficiency and statistical noise. A discussion of these competing frameworks can be found elsewhere (e.g. Hollingsworth, 2008). Furthermore, the data envelopment framework does not provide a comprehensive approach to the assessment of efficiency determinants. Bhat (Reference Bhat2005) uses a piecewise analysis of determinants within the data envelopment framework. A Spearman's correlation is used to measure the association between Data Envelopment Analysis (DEA) scores and individual determinants. The standard approach in the DEA literature is to jointly regress DEA efficiency scores on a series of determinants, an approach that has been questioned in terms of their validity (Simar and Wilson, Reference Simar and Wilson2007).
The stochastic production frontier model presumes a production-function relationship between health inputs and health outputs, which has been captured using the Cobb-Douglas framework, or the more general translog production function formulation (Greene, Reference Greene2004; Hollingsworth, 2008). The advantage of the translog specification is an increased flexibility in which the model can accommodate a number of functional forms of the production function without the need of their a priori specification (Hollingsworth, 2008). The drawback is the requirement for a large number of degrees of freedom, hence the Cobb-Douglas specification may be chosen to relax the demands on the data (Newhouse, Reference Newhouse1994).
In the case where the production function is specified in terms of one production input, the translog production model includes this input and its square, whereas the log-linear Cobb-Douglas specification does not include the squared term. Here, the production relationship between health outcomes and one health-system input (health expenditures) is specified using the translog model. In addition, health outcome is influenced by a series of control variables (consumption, employment, income distribution and population age structure). The basic version of the model takes the form:


where yit is the log of the health outcome (life expectancy), xit is a vector of the logs of health-system inputs (health expenditures and their square), cit is a vector of the logs of control variables (consumption, employment, income distribution and population age structure), vit is the stochastic error term and the estimated  are the measure of proportional inefficiency. Lambda is the asymmetry parameter, which, when larger, indicates a greater inefficiency component in the model. Efficiency scores can be computed using
 (Greene, Reference Greene2004; Coelli et al., Reference Coelli, Rao, O'Donnell and Battese2005).
Several versions of the stochastic frontier model are possible (Appendix B). The stochastic frontier can be estimated using classic fixed effects method (Schmidt and Sickles, Reference Schmidt and Sickles1984) or the classic random effects model (Pitt and Lee, Reference Pitt and Lee1981). Greene (Reference Greene2004) re-specifies what he calls a true fixed effects model and a true random effects model. The problem with all above specifications is an assumption of time-invariant inefficiency and the inability to properly isolate inefficiency from heterogeneity. The true fixed effects model could further be extended to incorporate heterogeneity in the distribution of inefficiency (Greene, Reference Greene2004). Extensions to the random effects model are used more often, including in the present analysis. The Battese Coelli extension accommodates systemic variation in inefficiency (Battese and Coelli, Reference Battese and Coelli1995) and is generalized to accommodate other formulations by Kumbhakar and Orea (Reference Kumbhakar and Orea2002). Greene (Reference Greene2004, Reference Greene2007a, Reference Greene2007b) proposes further refinements to the Battese Coelli model.
In this paper, the effects of health-system policy variables on the production and efficiency relationship are of particular interests. The vector of these variables, zit, contains both continuous and dummy variables. The continuous variables are expressed in logarithms. Incorporation of explanatory variables of the efficiencies is possible in Battese and Coelli (Reference Battese and Coelli1995) extension to the true random effects model; their model allows for time variation in technical inefficiencies and for estimation of inefficiency effects. Three options exist for the placement of the policy variables: (i) directly in the production function (model A); (ii) within the mean function of the inefficiency term (model B); and (iii) within the variance function on the inefficiency term (model C). Model A is a version of the BC model that allows for time variation in technical inefficiencies (Greene, Reference Greene2007a, Reference Greene2007b). Model B is the standard BC model (Battese and Coelli, Reference Battese and Coelli1995) and model C is an extension thereof (Greene, Reference Greene2007a, Reference Greene2007b).
Model A


Model B


Model C


All models are estimated in a random effects framework using the maximum likelihood estimator. Coelli et al. (Reference Coelli, Rao, O'Donnell and Battese2005) discusses the choice between models A and B, but does not provide an expose of situations when model A or B are most appropriate. According to Greene (Reference Greene2004) there is no clearly defined theory to guide how the policy variables should be incorporated into the model. The choice becomes an empirical matter. To discriminate between the three models, the Vuong test is used, which is a likelihood ratio test for model selection of non-nested models (Vuong, Reference Vuong1989). The test is based on the assumption that there is a true model specification. One model is superior to another when closer to true specification. The test statistics has a limiting standard normal distribution and the test is directional. Details are described in Appendix C (Vuong, Reference Vuong1989; Greene, Reference Greene2004).
It should be noted that the interpretation of the inefficiency coefficients in these models is generally restricted to their sign and statistical significance. The values of the coefficients are not of less interest (Battese and Coelli, Reference Battese and Coelli1995; Greene, Reference Greene2004). Of key importance is the estimate of η, which tests for time invariance. If its value is significantly greater than zero, the hypothesis of time invariance can be rejected.
3 Data
A sample of 21 developed OECD countries for the period between 1970 and 2008Footnote 7 is used. Most of the efficiency literature uses the same panel of data from the WHO that provides data for 191 countries between 1993 and 1997. Literature did identify, however, that the OECD group of countries is distinct and should be treated separately from the rest of the world (Hollingsworth and Wildman, Reference Hollingsworth and Wildman2003; Greene, Reference Greene2004). The sample here consists of affluent (GDP per capita >$24,000) and large (population >500,000) OECD countries. The sample countries all have well-developed healthcare systems.Footnote 8 In addition, these countries are relatively homogeneous along the environmental characteristics included by Greene (Reference Greene2004), which include tropical location, a measure of democratization and a measure of government effectiveness.
Life expectancy is used as an indicator of health-system outcome at the population level. Life expectancy as the outcome of a health system is used also by Or et al. (2001, Reference Or, Wang and Jamison2005), whereas Berger and Messer (Reference Berger and Messer2002) use OECD mortality rates. Authors who use WHO data use the Disability Adjusted Life Years (DALY) Index constructed by the WHO. Neither measure is perfect. Life expectancy is a broad measure that only in part reflects health outcomes, and in an even smaller part reflects health outcomes attributable to the health system. The DALY has been criticized in the literature on numerous grounds. It is claimed flawed and based on questionable and in part unethical age-weighting and discounting practices and confusion between resource allocation and the burden of disease (Anand and Hanson, Reference Anand and Hanson1997; Arnesen and Nord, 1999). The life expectancy measure used here is less controversial and based on fewer value judgments. It is preferred in the Stochastic Frontier Analysis (SFA) model to other system-level measures that are available, such as mortality rates, potential years of life lost, infant mortality rates, as the latter are negative outcomes of a malfunctioning health system.Footnote 9 Life expectancy is preferred to disease-specific or treatment-specific measures of survival, as it better lends itself to system-level assessment (Joumard et al., Reference Joumard, Andre, Ninq and Chatal2008).
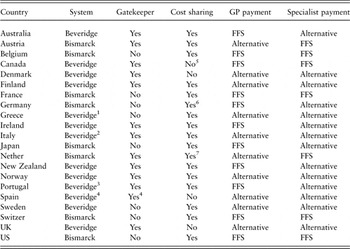
Health-system characteristics (Table 1) were identified via extensive literature review extensive literature review (Anell, 2005; Akaho et al., 1998; Ashton and Tenbensel, 2010; Ashton et al., 2004; Bellanger and Mosse, 2005; Custers et al., 2007; France et al., 2005; Gauld et al., 2006; Hakkinen, 2005; Lopez-Casanovas et al, 2005; Mossialos et al., 2005; Oliveira and Bevan, 2003; Oliver, 2005; Schokkaert and van de Voorde, 2005; Tountas et al., 2002; van den Noord et al., 1998; Wiley, 2005; Wranik and Durier-Copp, 2010; HiT series on health systems as included in the reference section) and via surveys of health-system experts. Thirty-four surveys were conducted between September and December 2009. Respondents were contacted via e-mail; the response rate was 52%. The purposeful sample of respondents consisted of authors of the surveyed literature, the Social Sciences Research Network database and Internet searches of economics departments in all countries. When the information matrix was satisfactorily completed and data were saturated, no further respondents were contacted. Respondents were asked to describe selected features of their health system. They were also asked to indicate under each category which feature predominates in their country. As an example, they were asked to indicate, which method of payment was the predominant form of payment to primary physicians. Characteristics are captured as dummy variables, with the understanding that a healthcare system is more complex than a set of dummy variables. Therefore, the presence of a characteristic, such as fee for service payment to primary physicians, does not imply the complete absence of alternative remuneration methods, but rather the predominance of one method. The crudeness of the indicators developed here as measures of health-system characteristics is a limitation of the study (discussed under Conclusions section).
Healthcare system characteristicsFootnote A

GP = general practitioner; FFS = fee-for-service.
A The characteristics were assessed via literature review and a qualitative survey with health-system experts. Experts indicated which characteristic predominates in their system. As an example, ‘no’ under ‘Cost sharing’ in Canada indicates that there is no cost sharing in the majority of the Canadian system, although it might exist in some parts of the system.
1 Since 1982.
2 Since 1977.
3 Since 1979.
4 Since 1985.
5 Since 1984.
6 Since 2004.
7 Since 2007.
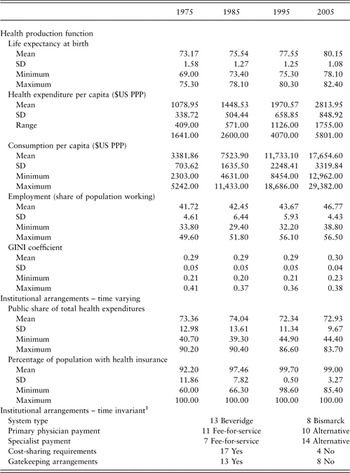
A Gini coefficient variable was extracted from the OECD Stats Extracts website.Footnote 10 A measure of the GINI coefficient was not available for each year between 1970 and 2008. Rather the measure is reported as ‘mid-70s’, ‘mid-80s’, ‘around 1990’, etc.) Missing observations were filled in as follows. A GINI coefficient measure reported for ‘around 1990’ was used for the years 1988–1992. The measure reported for ‘mid-1990’ was used for the years 1993–1997 and so forth. Descriptive statistics of the data are provided in Table 2. Remaining variables were downloaded from the OECD Health Data 2009 file (OECD 2009) and the OECD Stats online database.
Descriptive statistics

1Some changes over time, see Table 1.
The input into the health production function is per capita total health expenditure expressed in $US purchasing power parity.Footnote 11 This provides an aggregate summary measure of health-system inputs that is relatively comparable between countries, although differences between accounting systems exist (Tandon et al., Reference Tandon, Murray, Lauer and Evans2001; Hollingsworth, 2003; Self and Grabowski, Reference Self and Grabowski2003; Greene, Reference Greene2004). Or et al. (Reference Or, Wang and Jamison2005) use the number of physicians as the input into the health system. Although conceptually, disaggregated measures of labour and capital fit well into a production function framework, practical considerations make these measures less attractive.Footnote 12
To isolate the effects of health spending, aggregate measures of economic well-being (employment) are controlled for. It has been suggested that economic well-being is a dominant health determinant in developed countries (Self and Grabowski, Reference Self and Grabowski2003).Footnote 13
There are three speculated channels through which income affects health (Wagstaff and van Doorslaer, Reference Wagstaff and van Doorslaer2000; Wildman et al., Reference Wildman, Gravelle and Sutton2003; Lorgelly and Lindley, Reference Lorgelly and Lindley2008): (i) a direct impact of personal or household income on an individual's own health; (ii) the impact of economic prosperity at the system level on population health; and (iii) the impact of inequality in income distribution on population health. I include three variables to account for these three channels respectively: (i) personal per capita consumption expenditure; (ii) total employment as a percentage of total population; and (iii) the GINI coefficient as a measure of income inequality. I do not include a measure of national income due to its high collinearity with health spending and cointegration issues (Gerdtham and Lothgren, Reference Gerdtham and Lothgren2002).Footnote 14
Literature suggests that: (i) the model specification for the OECD group should be different from the non-OECD group (Hollingsworth and Wildman, Reference Hollingsworth and Wildman2003); and that (ii) the impact of education on health is grossly overestimated for the OECD countries (Grignon, Reference Grignon2008). In addition, health in non-OECD countries is influenced by education at the primary level (Grignon, Reference Grignon2008) and there is little variation in primary-level education between the OECD countries. OECD data on educational attainment are available starting in 1998. As such, education was not included.Footnote 15
4 Results and discussion
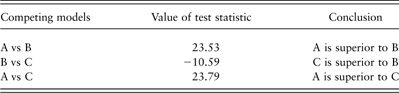
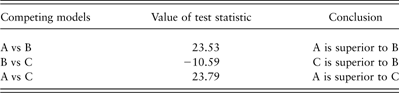
The Vuong test results indicate that Model A is superior to the two other specifications (Table 3). Accordingly, I report results of Model A only – all policy variables are incorporated directly into the production function. Estimations by Greene (Reference Greene2004) also favoured this model specification.
Vuong test results
4.1 Institutional arrangements
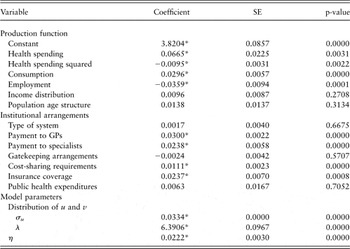
Findings indicate that health expenditures are most efficiently used in health production in systems that offer insurance coverage to a larger percentage of the population and at the same time require the population to carry some of the cost burden. Furthermore, systems that offer FFS payments to physicians at both the primary- and secondary-care level are more efficient than those offering alternative payments. Strictly speaking, the results suggest the following: Given a level of health expenditures in a country, the average life expectancy is 1.03 (and 1.02) years higher in countries that offer fee for service payments to primary physicians (and specialists) as compared to alternative payments. The cost-sharing requirements improve health outcome by 1.01 years at any level of health spending. The elasticity of insurance coverage is 2%, which indicates that an increase in the percentage of the population with insurance coverage by 1% is associated with a 2% higher life expectancy-given health expenditures (Table 4). These results should be interpreted with caution, however, for two reasons: (i) they stand in contrast with some of the results of other studies, as described below; and (ii) the model used here is subject to a series of limitations, as discussed in the Conclusions section. Most importantly, the stochastic frontier framework is not designed to establish causative relationships, but measures associations.
Determinants of efficiency

GP = general practitioner.
*Significant at the 5% level of significance.
The positive effect of FFS payments on efficiency coincides with Or et al. (Reference Or, Wang and Jamison2005), where FFS was found to improve the efficiency of physicians (not health spending in general). Other studies at the macro level do not favour FFS methods; mean efficiency is found to be lower under FFS than under capitation arrangements, although the finding is not statistically significant (Bhat, Reference Bhat2005). Furthermore, FFS is found to be positively related to premature mortality (Or, 2001) and to higher health expenditures (Gerdtham, 1998). The latter finding holds at the primary-care level, but not at the inpatient care level, where FFS is not associated with higher spending (Gerdtham et al., Reference Gerdtham, Jonsson, MacFarlan and Oxley1998). Bhat (Reference Bhat2005) provides a fragmented analysis of the determinants of efficiency, where efficiency scores found via data envelopment analysis are compared against institutional arrangements with simple statistical tests (e.g. analysis of variance). Or (2001) also uses a piecewise approach. These procedures are methodologically weaker than the stochastic frontier framework. Gerdtham's findings suggesting a positive relationship between FFS remuneration and spending do not contradict the negative relationship between FFS and efficiency.
The positive impact of cost sharing on efficiency favours the proposition that cost sharing reduces the use of unnecessary services. This positive impact seems to outweigh any negative impact where necessary care might not be accessed due to financial constraint. Furthermore, across the health systems examined here, user charges are likely to have better results in countries with lower supply-side controls, as described in Thomson et al. (2010). The results add to the scant evidence suggesting that cost sharing reduces utilization (Bolin et al., Reference Bolin, Lindgren, Lindgren and Lundborg2009) and use of medication (Wagner et al., Reference Wagner, Heisler and Piette2008), and that awareness of costs by patients reduces health expenditures (Gerdtham et al., Reference Gerdtham, Jonsson, MacFarlan and Oxley1998). Insurance coverage, which also has a positive effect on efficiency, mitigates the direct financial burden to patients of some cost sharing, but the awareness of cost remains. In a previous study, insurance coverage is not a statistically significant determinant of health expenditures (Gerdtham et al., Reference Gerdtham, Jonsson, MacFarlan and Oxley1998).
Information is insufficient to reject the hypotheses that gatekeeping arrangements or financial arrangements have no impact on efficiency, as neither the gatekeeping nor the system-type coefficients are statistically significant. The results fall in line with most previous literature. Gatekeeping arrangements have no statistically significant impact on premature mortality or infant mortality (Or, 2001, 2005), health expenditure growth rates (Barros, Reference Barros1998) or efficiency (Bhat, Reference Bhat2005). Only Gerdtham (1998) finds that gatekeeping is the less costly arrangement.
The system type is not a statistically significant predictor of expenditure growth (Barros, Reference Barros1998). In other studies, the Beveridge-type systems are found to be more efficient (Hurst, Reference Hurst1992; Bhat, Reference Bhat2005), but more costly (Gerdtham et al., Reference Gerdtham, Jonsson, MacFarlan and Oxley1998; Gerdtham and Lothgren, Reference Gerdtham and Lothgren2001). Glied (Reference Glied2009) discovers that single-payer systems are moderately less costly; however, the primary contribution of Glied is the development of a measure of single-payerdness; one that is not easily transposed into the Beveridge or Bismarck classification. The measure is used in a basic regression framework, which is econometrically less suitable than the Gerdtham et al. (2001) stochastic frontier framework.
The division of health systems into the Beverage and Bismarck type is problematic, as most systems display blended features of both systems. Furthermore, most systems have come close to universal coverage, and in all the share of health spending carried by government is at least half.
Perhaps for similar reasons, there is no statistically significant association between the share of public expenditures with system efficiency; a relationship on which the literature is conflicting. Higher public financing of health care was found to have positive implications (Gerdtham et al., Reference Gerdtham, Jonsson, MacFarlan and Oxley1998; Or, 2001), negative implications (Berger and Messer, Reference Berger and Messer2002; Greene, Reference Greene2004) or no implications (Barros, Reference Barros1998; Self and Grabowski, Reference Self and Grabowski2003; Bhat, Reference Bhat2005; Or, 2005).
To elaborate, public financing as a share of total financing is assessed in the literature as a determinant of health expenditures (Barros, Reference Barros1998; Gerdtham et al., Reference Gerdtham, Jonsson, MacFarlan and Oxley1998; Roberts, Reference Roberts1999), a determinant of efficiency (Greene, Reference Greene2004) or a determinant of health outcomes (Berger and Messer, Reference Berger and Messer2002; Self and Grabowski, Reference Self and Grabowski2003; Or, 2005). Greene (Reference Greene2004) does not find a statistically significant relationship between the share of public spending and efficiency measures using a WHO data set of 191 countries. Barros (Reference Barros1998) also does not discover a significant relationship with growth rates in spending in the OECD sample of 24 countries. In addition, using OECD data, Gerdtham et al. (Reference Gerdtham, Jonsson, MacFarlan and Oxley1998) find a positive relationship between spending and public financing, whereas Roberts (Reference Roberts1999), finds the same relationship to be positive. As a determinant of health outcomes, Or et al. (Reference Or, Wang and Jamison2005), using the OECD data, discover a positive relationship between the public and private mix of spending and several indicators of longevity, but only for females. Self and Grabowski (Reference Self and Grabowski2003) confirm this positive relationship in the WHO data set, whereas Berger and Messer (Reference Berger and Messer2002) find this relationship to be negative in their OECD sample.
4.2 Health production function
Health outcome is significantly affected by health expenditures (and their square), consumption and employment. The relationship between income distribution and the population age structure is not statistically significant. The coefficients are elasticities of health outcome with respect to its determinants. The elasticity of health outcome with respect to health expenditure is 0.06; with respect to consumption it is 0.03 and with respect to employment it is −0.03 (Table 4).
The effects of health spending on health are not clearly established in the literature. The positive relationship is supported by many studies (Cremieux et al., Reference Cremieux, Ouellette and Pilon1999; Gravelle et al., 2003; Or et al., Reference Or, Wang and Jamison2005; Nixon and Ulmann, Reference Nixon and Ulmann2006), although several studies challenge this relationship (Self and Grabowski, Reference Self and Grabowski2003; Nixon and Ulmann, Reference Nixon and Ulmann2006). The positive impact of consumption, as an indicator of economic well-being is as expected, whereas the negative impact of the employment measure is surprising. The possible channels through which economic upturns negatively affect health are explored by Ruhm (Reference Ruhm2000).
The influence of income inequality on health outcome is controversial. Many find a negative association (Kawachi and Kennedy, Reference Kawachi and Kennedy1997, Reference Kawachi and Kennedy1999; Wagstaff and van Doorslaer, Reference Wagstaff and van Doorslaer2000; Ellison, Reference Ellison2002; Greene, Reference Greene2004), yet more recently the relationship has been called into question (Gravelle, Reference Gravelle1998; Wildman et al., Reference Wildman, Gravelle and Sutton2003; Wilkinson and Pickett, Reference Wilkinson and Pickett2006; Lorgelly and Lindley, Reference Lorgelly and Lindley2008). My results do not support the notion that a more equal distribution of income results in improved health.
Lastly, previous studies did not find a statistically significant correlation between the population age structure and higher health expenditures (Gerdtham, 1998) nor expenditure growth rates (Barros, Reference Barros1998). My results are similar.
4.3 Efficiency scores and rankings
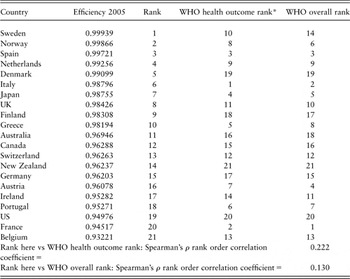
Although not the focus of the paper, efficiency scores from 2005 and country rankings are provided in Table 5. Rankings from this study are compared to the WHO rankings. The first set based on the efficiency of producing health outcome (Evans et al., 2001), the second based on overall system efficiency (Tandon et al., 2001). It is typical for most efficiency scores to be in the neighbourhood of one, when the distribution of the efficiency term is assumed half normal or exponential (Coelli et al., Reference Coelli, Rao, O'Donnell and Battese2005). Rankings based on efficiency scores, rather than the scores themselves, are typically of interest in stochastic frontier analysis. Rankings are robust to distributional assumptions of the model (Coelli et al., Reference Coelli, Rao, O'Donnell and Battese2005). The Spearman's ρ correlation coefficients between my rankings and those of WHO are low (0.252 and 0.369, respectively), indicating that the rankings are substantially different from each other. This is not surprising, given the differences in data, model structure and variable choices.
Efficiency ranking

*The WHO study ranked 191 countries, and within the ranking included OECD countries in Table 4. The WHO ranking indicates column, which of the OECD countries appeared first in the ranking, second in the ranking, etc. Ranks do not necessarily correspond to the rank within the entire sample of 191, but their relative ranks are preserved.
5 Concluding remarks
This paper builds on the literature on health-system efficiency, the interest in which was sparked by two WHO reports. The reports provide a ranking of countries by efficiency. The descriptive nature of such rankings leaves little direction to policymakers. This study adds a policy-relevant analysis of health-system arrangements that contribute to efficiency.
Findings indicate that the most important contributors to policy are the policy instruments that target patient behaviour (insurance coverage and cost sharing) and those that target physician behaviour (payment methods). System structures related to financing mechanisms and gatekeeping have an uncertain impact on efficiency, in that we do not have sufficient information to assess their impact. From the perspective of the policymaker, changes to cost-sharing requirements or physician payment methods are easier to implement than changes in the foundational financing structure of the system.
The uncertainty of results might be attributed to the inability of a binary classification of systems (Beveridge type and Bismarck type) to capture all the complexities of the financing arrangements. Most systems are blends of the two types and most have unique caveats embedded within. In fact, the practice of characterizing complex health systems by way of a set of categorical variables is admittedly a shortcoming of all studies that embark on system-level cross-country comparisons. The classification is imperfect, as systems do not exist in pure forms (social insurance and tax-financed insurance can co-exist, FFS payments and capitation payments can co-exist, etc.).
Health systems have additional features that are not captured in the typology used here, but might have an impact on efficiency. The crude classification of health systems used here does not do justice to the details and complexities of each system. This manifests in the apparent inconsistency, where for instance Belgium ranks last despite the use of predicted most efficient policy instruments, while the Scandinavian countries rank highly, despite using some less efficient policy instruments. Furthermore, cross-country comparisons are complicated by inconsistencies in variable interpretation, comparability of financial information, the extent to which the purchasing power parity index actually reflects the purchasing power of health expenditures and data collection mechanisms across counties.
Future studies might explore the use of alternative measures of health outcome in efficiency estimation. Life expectancy is a crude measure of health outcome; one might argue that the contribution of a health system to life expectancy is relatively small in comparison with other factors, such as environment and lifestyles. Future studies might also investigate other policy levers, such as the degree of centralization of decision-making within a system. Furthermore, many system institutional characteristics in this model are expressed as binary variables. Continuous measures, such as, for instance, the percentage of physician income derived from FFS or the percentage of financing derived from patient cost-sharing arrangements, might improve the model. A potential alternative in health-system classification is the work of Joumard et al. (Reference Joumard, Andre, Ninq and Chatal2008, Reference Joumard, Andre and Nicq2010) that might provide an improved set of health-system variables to use in empirical estimation.
Despite the limitations, this study provides valuable guidance to policymakers. Evidence is not sufficient to support neither a single-payer Beveridge-type mechanism, nor a multi-payer Bismarck-type mechanism. The distinction between these two systems is increasingly more blurry in practice. Policy efforts are best expended on the structuring of physician payment mechanisms, on expanding insurance coverage and on requiring patients to carry some portion of the cost burden.
Acknowledgements
The author would like to extend a special thanks to William Greene (New York University) for his invaluable and tireless assistance with Limdep programming and econometric modeling questions. He also thanks Bruce Hollingsworth (Monash University) for reviewing several versions of the paper and for offering helpful comments and suggestions with respect to the stochastic frontier framework used in this paper. Next, he extends his thanks to Wayne Simpson (University of Manitoba) for his guidance at the initial stages of this work. Finally, the author would like to express gratitude to the two anonymous reviewers, whose comments challenged his thinking and allowed him to improve the paper in a number of important ways. To the best of the author's knowledge, a potential conflict of interest does not exist. The study uses data published by the OECD and was not subjected to a separate ethical review process.
Appendix A
Literature on institutional arrangements

DALY = Disability Adjusted Life Years; FFS = fee-for-service.
Appendix B

Appendix C
The Voung test is set up as follows:
H0: The two models (f and g) are equally close to the true specification.
H1: There is a statistical difference in the distance of each model from true specification.
Under H0:


To calculate


The null hypothesis is rejected, if the absolute value of the test statistic exceeds 1.96. The null hypothesis cannot be rejected otherwise, and the test is not conclusive. An absolute value of the test statistic that is less than 1.96 implies that the two models are equally close to the true specification. A positive test statistic greater than 1.96 favours model f, and a negative test statistic greater than 1.96 favours model g.