




No CrossRef data available.
Learning inexpensive parametric design models using an augmented genetic programming technique
Published online by Cambridge University Press: 10 February 2006
Abstract
Previous applications of genetic programming (GP) have been restricted to searching for algebraic approximations mapping the design parameters (e.g., geometrical parameters) to a single design objective (e.g., weight). In addition, these algebraic expressions tend to be highly complex. By adding a simple extension to the GP technique, a powerful design data analysis tool is developed. This paper significantly extends the analysis capabilities of GP by searching for multiple simple models within a single population by splitting the population into multiple islands according to the design variables used by individual members. Where members from different islands “cooperate,” simple design models can be extracted from this cooperation. This relatively simple extension to GP is shown to have powerful implications to extracting design models that can be readily interpreted and exploited by human designers. The full analysis method, GP heuristics extraction method, is described and illustrated by means of a design case study.
Information
- Type
- Research Article
- Information
- Copyright
- 2006 Cambridge University Press
1. INTRODUCTION
A designer's ability to rapidly identify and modify conceptual designs is based on their tacit domain knowledge. This knowledge takes the form of relationships between the design parameters (aspects of the design a designer has control over) and design objectives (aspects of the design resulting from the designer's choices). These relationships will be dependent on the particular design family, and can be considered as a tacit model. Typically, this tacit knowledge is the result of extensive experience of designing other product family members. Tacit knowledge has been defined as “knowledge which cannot be articulated easily” (Shadbolt & Milton, 1999). Obtaining such knowledge through experience requires time. One method for accelerating this process is by providing the knowledge explicitly. However, transforming a designer's tacit knowledge into explicit knowledge is known to be a costly and not always a totally accurate method (Ahmed, 2001).
This research aims to build computational methods for extracting design knowledge from previous design exemplars, and for reporting this back to designers in an intuitive manner. This knowledge will take the form of simple algebraic relationships between design parameters and objectives. The quality of these heuristic relationships can be further improved through expert interpretation. On the surface, the use of experts appears to counter the argument of developing the computational analysis method in the first place. However, the extracted relationships provide a basis for the expert to document the domain, as opposed from providing this documentation with no starting point. Figure 1 shows the overall procedure for generating this report using the genetic programming heuristics extraction method (GP-HEM).

The overall procedure for generating the design relationship report. This paper concentrates on the right-hand side of the figure.
Given a set of coarse relationships, it then becomes possible to search more rapidly the design space. A designer can specify a desired value for a given design variable1
A design variable is either a design parameter (e.g., length, material, etc.) or design objective (e.g., weight, cost, esthetic properties), and the full set of variables defines the design problem space.
To illustrate the aim of this method, consider a bicycle design. Most bicycles can be described by a common set of design variables (wheel size, position of top bar, stiffness, weight, cost, etc.). In addition to the “engineering” variables, subjective variables can also be added such as “desirability,” as perhaps measured by sales volume. When designing a new bicycle, a designer will have a target specification. This specification will determine targets for a subset of the design variables. The designer's task is then to provide firm values for the remaining design variables, potentially modifying some of those provided in the original specification where they prove to be infeasible. The relationships are used to provide this information. Note that it is also possible to make estimates on the subjective elements of the design, as these relationships are also extracted.
The total knowledge extraction method comprises a number of components, each of which will be described in detail. At the core is the GP component. This alone searches for increasingly complex and accurate models for the given product family. However, the aim is not to provide a single, “grand-unifying” model of the domain but rather a collection of loosely related simple micromodels. This is achieved through a component that ensures the GP is “pressured” into generating these simple micromodels. Finally, there is the reporting component, which is used at the end of the method to provide a meaningful report of the micromodels. Figure 2 illustrates the interaction between the components. These micromodels will be described in greater detail later in the paper.

The interaction between the components: the algorithm iterates between the GP and the micromodels components until termination, when the report generation module is used.
The remainder of the paper discusses the background to this research (Section 2), followed by a more extensive description of the GP algorithm (Section 3). The applications of the GP, including the supporting components, are then described (Section 4). The method is illustrated with a case study, including an analysis of the results (Section 5). Finally, a general discussion of the method concludes the paper (Section 6).
2. BACKGROUND: ENGINEERING KNOWLEDGE
There are a number of methods for eliciting domain knowledge. These can be split into two main subdivisions: deductive and inductive. The deductive methods require domain experts to provide a set of rules or cases that can be used to deduce new examples of the domain. Inductive methods are the reverse of this: from a set of examples they obtain rules that describe the relationships between these. This work looks at using the results of an inductive approach and interpreting these to provide the rules that a deductive method requires.
2.1. Design representation
It is assumed that the designs are to be represented parametrically. This is a common encoding method where the relevant design variables are the parameters of the design representation model. A design instance is then described by the associated (typically numerical) values taken by these parameters (Eastman et al., 1991; Green, 1997; Malmqvist & Schachinger, 1997). This does have the drawback of restricting the domain into a single representation; however, it is possible to allow sufficient flexibility by careful abstraction of the domain. For example, the bicycle example could detail all the possible saddle configurations; however, these are unlikely to have a major impact on the remainder of the domain, and hence, it is acceptable to assume that these can be represented simply by the saddle connection point only. In addition to the design parameters (e.g., geometry, material, etc.), this representation must also contain all the objective design criteria (e.g., weight, cost) and the subjective criteria that have been measured previously (e.g., suitable for city riding). The set of design parameters, objective, and subjective criteria2
The subjective criteria will be included, and hence referred to, as design objectives.
2.2. Engineering design knowledge needs
The knowledge needs of designers changes as they gain experience. Popovic (2004) classifies the designer expertise level in part according to how many design rules and constraints a designer can mentally manage at any one time. Hence, to improve the capacity of novice designers, it is beneficial to present design rules and constraints in an intuitive manner, that is, one that requires less mental effort to process. Although this will impact the complexity of design rules and constraints, the benefit is that designers are able to process more rapidly a larger scope of the total design model.
In addition to the cognitive aspects of the knowledge presentation, it is also necessary to consider the type of knowledge that designers require. Ahmed and Wallace (2004) report on empirical evidence quantifying the relative volumes of novice queries for specific types of design information. Of these queries, the two largest categories were related to company and design process. Clearly, these are considered important by the novice designers but as they are process related, these will not contain significant product knowledge. The next most significant set of queries relate more closely to product, and are classified under “how does it work,” “what are the trade-offs,” “what is a typical value,” and “what issues to consider.” This product type knowledge can be represented by the relationships between product design parameters and objectives.
2.3. Knowledge engineering management methods
Knowledge engineering methods are concerned with eliciting domain knowledge from experts for future use. This has two aspects: the acquiring specific knowledge, and the storage and structuring of this knowledge.
Eliciting specific knowledge is primarily concerned with the rationale and rules that generate designs (Blessing, 1994; Arciszewski, 1997; Smith & Morrow, 1999). Although these rules can provide more explicit guidance during design, a major challenge is to identify the appropriate rule at any given point in the design process. Examples of this are rule-based design systems, for example, Siddall (1986), Arafat et al. (1993), Thornton (1996), and Arciszewski (1997). Critically, a large investment is needed to elicit these rules. This typically involves interviewing design experts, and then encoding and structuring the rules so that they can be readily accessed (Modesitt, 1992). This approach tends to be expensive to implement (Ahmed, 2001).
The storage aspects extend beyond the physical nature and media that is used to record design knowledge. Assuming that some archival media is being used, there is the issue of structuring and retrieving the information. This must address the granularity of the design data to be stored and how this is to be structured. These issues are researched by product and project data management groups. Such databases can be used to populate a case-based reasoning design tool (Leake et al., 1999; Reich & Barai, 1999; Rosenman, 2000). This approach allows designers to identify the most similar previous designs. These designs are then used as starting points for new designs, provided the designer understands the effects of any modifications made. Such an approach provides no rationale about how such previous designs were reached, unless this is explicitly included. Hence, there is a need to link the storage with rationale used to create the design in the first instance.
The method introduced in this paper aims to exploit design databases that lack rationale. Through the analysis of such databases, explicit design knowledge is to be extracted, providing rationale for these designs. By providing explicit understanding of the relationships in the domain, it will also be possible to create new designs more rapidly. Further, there is the potential of discovering new domain rules that were overlooked by domain experts.
2.4. Induction methods
Induction methods are data driven as opposed to expert driven, which is the case with the knowledge engineering approaches. This provides an advantage in cases where expert availability is limited, but sufficient prior data is available to build a model of the product family. There are a number of induction methods, ranging widely in the transparency of the models they generate (Andrews et al., 1995; Heckerman, 1999; Maire, 1999; Hong et al., 2000; Hwang & Yang, 2002). A brief overview of a sample of these is provided, starting with neural networks, one of the least transparent approaches.
Neural networks have been shown to be able to learn complex mappings well (Lawrence et al., 1996). The benefits of using neural networks lies in the wide range of domains they can be applied to, and the speed at which they perform at once trained. These benefits are underpinned by a strong theoretical understanding of how they learn and the performance and accuracy that can be expected of neural networks. However, the internal structure of the trained network remains opaque. This is a problem, as it difficult to understand how the input and output variables are related. Without this understanding, all that can be done is to use the neural network in a trial and error mode, which is an inefficient search strategy. There has been work on extracting simple and intelligible rules from these networks (Corbett-Clark, 1998; Huang & Xing, 2002; Matthews, 2002). This is a posttraining process, which provides explicit rules that can then be validated by an expert, and potentially edited if necessary. This provides a combined strategy to gain insights into the domain. However, this is a more complex process than acquiring the rules directly from the data.
Data mining methods are a large collection of methods that, in general, generate association rules from large databases. In contrast to neural networks, these are explicit rules. However, the rules are difficult to interpret, and are most often used as part of some other algorithm, for example, credit card fraud detection (Michalski & Kaufman, 1997). Data mining is primarily used to classify accurately and efficiently new cases into previously determined categories. As these methods are commonly used for computer identification of, for example, fraud detection, importance is given to the statistical significance of data mining results. The understanding of the limits of data mining methods represents one of the major benefits of this approach. However, the rules generated by the data mining methods are rarely used to provide greater insight into the original problem domain.
Automated science discovery methods provide insights into a domain where only empirical evidence is available. These methods iteratively build and test rules on a given set of observations, guided by a set of functional operators (Żytkow, 1999, 2000). Several empirical applications are cited, including physics, chemistry, and astronomy. Langley et al. (1987) introduced an algorithm for building mathematical equations from a given set of observation variables. This algorithm searches for equations that result in constant values for given subsets of observations, and it uses these to build further equations until some equation remains constant for all observations. This final equation represents a law for the given domain. The science discovery methods represent an implementation of the scientific method, and therefore, inherit the rigor that this thorough approach provides. Unfortunately, these discovery methods tend to be exhaustive, and hence, computationally expensive. In addition, for the science discovery methods, it is assumed that all the necessary observations are included.
For further reference on machine learning techniques and methods, Michalski and Tecuci (1994) and Mitchell (1997) provide thorough overviews of the domain, and Arciszewski and Ziarko (1992) discuss a selection of methods from an engineering perspective.
2.5. Summary: Criteria for an HEM
Engineering design knowledge presents an interesting set of requirements: a designer must have an understanding of how the various design variables are interrelated, but at the same time seeks new areas that are likely to challenge this understanding. Therefore, to support a designer, it will be necessary to provide these relationships in a nonconstraining manner. A large single unifying model is likely to constrain. For this reason, this approach proposes to offer a set of small (micro) models representing certain aspects of the domain. These loosely related micromodels represent a set of heuristics to be used by a designer searching for a good concept that can then be further analyzed by more expensive tools. The micromodels will be simple enough that the engineering principles can be seen without compromising accuracy, providing domain understanding, and hence, the ability to search the design space intelligently.
3. EVOLUTIONARY SEARCH ALGORITHMS
Evolutionary search algorithms are in general “generate and test” beam searches (Mitchell, 1997). These are searches where a large number of potential solutions are considered, and the search for better solutions is biased in the direction of the current best set of solutions. Hence, the current “population” of solutions is used to generate the next population of solutions for consideration. The heuristic used to generate the new population members from the old population was inspired from Darwinian survival of the fittest theory. Solutions that are “fitter” are stochastically combined with each other to generate new solutions. The theory is that some of the new solutions will have been combined from (or inherited) “good” parts of their parents, and hence, will also be fitter. This is a stochastic process, and the combinations are performed randomly biased by the measured fitness of the parent solutions.
Genetic algorithms (GAs) are a successful and well-known implementation of this technique for numerical optimization problems where the problem representation is fixed (Goldberg, 1989). This approach has been shown to work well in domains where traditional gradient search-based tools perform poorly due to the cost of computing gradients (Jenkins, 1996; Gen & Cheng, 2000). After a number of generations, the solution population lies mainly in a region of good solutions. Clearly, there are two criteria needed for a domain to be suitable for this approach. First, solutions in the domain must be expressible in a fixed format, for example, a real-valued vector. Second, there must be a predetermined fitness function that can evaluate candidate solutions. It appears that the GA approach is suitable for a family of products, because they are all described using a fixed format, provided a suitable fitness function exists.
3.1. GP
GP is an evolutionary search algorithm (Koza, 1992; Koza et al., 1999). With GP, a more flexible solution representation is adopted. Instead of a fixed vectorlike structure, a tree structure is used. This allows the representation of functional forms (see Fig. 3). Functions are built up from primitive functional elements (e.g., addition and multiplication in algebra, or LISP functions). These functions form the nodes of a tree. The arguments of these functions are then subtrees, the terminal nodes being the function variables or constants. GP uses the same sexual recombination approach to generate the new solution space, but the operators are modified to apply to tree structures. This search results in identifying tree structures that provide good solutions, as evaluated by the provided fitness function. An example would be identifying an algebraic expression that curve fits the given dataset well. Unless there is some evolutionary pressure to keep these tree structures small, they are able to grow arbitrarily large if this improves their fitness score.

The creation of functional trees, using functional nodes for addition, squaring, and square root and terminal nodes a and b.
3.2. Island approach
As there is no great need in evolutionary computing searches for new candidate solutions to be generated synchronously, a number of evolutionary algorithms were developed for distributed computing environments. One of the earlier versions of this was applied to optimization of Walsh polynomials, distributing the solution populations to different independent GAs (Tanese, 1989). Two methods were compared, one where the GAs were left running independently of each other, and one where a small portion of the population was allowed to “migrate” between the otherwise independent GAs. Cohoon et al. (1987) defined a set of basic migration policies. These determine how members of different “islands” can migrate between islands: a mesh structure restricts migration between neighbors, a star allows migration through a central point, linear/circular is a one-dimensional mesh, and random removes any restriction to the inter-island migration. This island approach provided nearly linear acceleration when the processing was distributed between independent processors. Further studies demonstrated that this could be improved to superlinear acceleration by controlling the migration more carefully (Belding, 1995; Andre & Koza, 1996).
More practical applications of the island approach appear later. Potter et al. (1995) use the island approach to evolve a robot controller that has two competing strategies. The two strategies are evolved independently (one on each island); however, this application was sensitive to the initial seeding. Further work developed the island approach to string matching and neural networks (Potter, 1997; Potter & De Jong, 2000). This provided a better understanding of the behaviors of niches in the overall population, and how these niches can cooperate to provide some emergent behavior.
Wiegand et al. (2001) formalized the above approaches, and provided a general framework for cooperative coevolutionary algorithms. This work investigated more general questions about evaluating the collaborative nature between the islands and how many islands should be used.
3.3. Combining the EC elements
We have just described the core computational ideas that are to be adopted in the search for simple useful design relationships. As the aim is to search for arbitrary algebraic structures, the GP approach is the most suitable for this task. This will allow for the flexibility that can be achieved using algebraic structures that would not naturally occur if adopting the GA encoding method. As noted, the algebraic relationships can become arbitrarily large unless pressure is applied to keep them small. However, it is important to identify potential complex relationships. This will be achieved by using the island approach: individual solutions will be kept simple, and similar solutions will be developed on their own island. The interaction of these islands will represent the more complex behavior. Hence, it will be possible to report these complex behaviors by reporting the linkage between a pair of these islands that each represent a simple behavior. This linkage is identified through “collaborative” behavior between islands. The next section expands on these ideas.
4. SEARCHING FOR DESIGN RELATIONSHIPS
The GP approach is adapted in a novel manner to search for design relationships. As noted in the previous section, the island approach proved not only to accelerate the search, but also provided a wider variety of solutions. This is a key factor in developing and implementing the search method. The search method is divided into three major processes: islands creation, fitness measurement, and final reporting, and these are linked as shown in Figure 4. Each of these is now described, after first discussing the problem domain.

The overall process flow of the GP-HEM. Each iteration modifies the current population to provide the population for the next iteration.
4.1. Problem domain
The GP-HEM developed in this paper is based around real-valued design variables. This, in turn, provides a restriction on the type of design domain that can be analyzed fruitfully. The approach identifies simple algebraic relationships between subsets of design variables. Hence, it is necessary for the problem domain to be described using such components. In addition, the nature of the relationships being extracted is mostly continuous.3
Exceptions are of the form 1/(x − y), which is discontinuous along x = y.
As the design domain must be specified to this parametric granularity, this appears to be most applicable to the embodiment design phase. However, these algebraic rules can be interpreted as design guidelines, which provide a greater understanding of the design family. This understanding can then be applied at the earlier conceptual design stage, leading to better quality design concepts.
Because of the constraints on design representation, this approach appears to be most suited to mechanically oriented design domains. Similar approaches exist, for example, Ishino and Jin (2002) apply GP to understand designers' intent in a mechanical gear design domain. Such domains are more likely to be continuous in the design parameters, and hence, more suitable to this approach. There is evidence that a similar approach has also provided interesting results in chemical process engineering (Lakshminarayanan et al., 2000). It should be possible to apply this approach to other design domains, provided a sufficiently continuous problem area is being analyzed. Both these methods apply a GP to identify the mapping between the design parameters and a single design objective. Where designs have multiple objectives, this process is repeated independently for each objective.
Highly discontinuous domains are not expected to be successfully modeled by this approach, for example, in software design where very small design changes can result in large performance changes. In addition, the modeling of software design in a conceptual manner is a nontrivial task.
4.2. Assumptions
A number of assumptions are made on the nature of the design domain, the available data, and type of models that are to be extracted. First, it is assumed that the design domain is continuous (or no less than piecewise continuous) in the design variables. This assumption permits the search for algebraic models, rather than classification type models. It also allows simpler approximation functions to be created. This leads to the second assumption: the data is real valued and all present (no missing values). Thus, algebraic expressions constructed from the design variables can be directly evaluated as a real number. The third and final assumption is that micromodels provide a meaningful representation of the design domain. It is assumed that by combining micromodels, and thus in particular enabling direct relationships between subsets of design objectives, meaningful and interesting domain relationships will be identified with the GP-HEM.
4.3. Island creation
The islands GP approaches described in Section 3.2 simply distributed the solution population between processors arbitrarily. For the GP-HEM, each island represents a meaningful subset of design variables, and therefore there is a need for more careful distribution of the population between the islands. However, it is not known beforehand which design variables belong together. The approach adopted for the GP-HEM is to cluster the population of candidate solutions, and to treat each cluster independently as if it were a real island. This requires a metric to determine how the objects are to be clustered. This poses a challenge, because there are no inexpensive metrics for the functional space being searched by the GP. The following sections describe how this clustering can be achieved.
4.3.1. Clustering method
The partitioning around medoids (PAM) algorithm (Kaufman & Rousseeuw, 1990) was selected as the clustering algorithm, because it is simple and identifies a member of each cluster as a representative for its cluster. This representative element is called the cluster's medoid. Other clustering algorithms typically compute a prototypical point that represents a “truer” center; however, this is not possible to do with the functional forms. Each island then represents a particular “micromodel” class, and it is desired that these are to be as diverse as possible with respect to the design aspects they address. Therefore, the metric should be based on the contents of the functional form (i.e., the design variables that are being used in the function). Kusiak (2001) uses similar ideas with rough sets to allow for potentially overlapping rules.
4.3.2. Function space pseudometric
A pseudometric was developed to reflect these clustering requirements. This provides a means of measuring similarity between different algebraic expressions so that they can be clustered using PAM. It was also desired to be able to identify functionally identical expressions that occur commonly using the GP process. For example, the two distinct function trees representing x + y and x + y + y + x are seen as being identical, as they are equivalent by a multiplicative factor. The function space is projected into a fixed sized hash vector, to which the Euclidean distance metric can be applied. The hash vector is given by the proportion of each design parameter's presence in the function. In the example above, the two hash vectors would be (1, 1) and (2, 2), respectively. When these are normalized, the two hash vectors become equal, and therefore have zero distance between them.
The function hashes exist in a metric space and hence can be clustered by PAM, the clustering algorithm. PAM provides a set of clusters and medoids that are used as representatives for their associated cluster. These clusters are treated as the islands described previously. Further details of the PAM algorithms are given in Appendix A.
4.3.3. Inter-island migration policy
In addition to the generation of the islands it is necessary to define the policy on inter- and intracluster crossovers. The aim is to have most crossovers produced from within their own island (intra-island). In addition, a few inter-island crossovers are performed to promote a small degree of genetic variety within each island. These inter-island crossovers are done by taking all the medoids, treating them as a single island, and applying the intra-island crossover procedure to this set. The remaining genetic operators (mutation and injection) only involve single candidates, and so no special consideration is required. The final population is evaluated again for fitness, and the procedure repeated, generating a new set of islands. With the new set of islands, it is possible that the island boundaries are shifted. This allows for the nature of each island to evolve as well as the whole population.
4.4. The fitness function
The fitness function provides the bias that directs the GP search. This function must reflect the desired properties of the better solutions, and it is typically computed by a function independent of the solution set. The aim is for the GP-HEM to discover pairs of functions that contain different terminal nodes, but have a high covariance coefficient. This is because the method is based on a cooperating coevolutionary approach, where “halves” of the micromodels are generated by the GP. Such pairs describe interesting phenomena that are being observed within the dataset. However, this is based strictly on the current population as opposed to some external measurement. As a result, it is no longer possible to compare fitness values across generations.
The candidate solutions are clustered into different islands based on the symbols they contained, and within each island it is expected that candidates have a high covariance. The algorithm therefore does not compare the covariance of a candidate solution with that of other members of that solution's island. In a further runtime optimization measure, the candidate is only measured against the medoids of the other islands. This is because the medoid is the representative of the island, and it will have a high covariance between itself and its fellow island members.
The aim is to keep the functions simple. To achieve this, a penalty is given to longer functions. Hence, the desired properties of the fitness function for a given solution member (f) can be summarized as follows:
- the average covariance f has with the other islands' medoids must be high, because this suggests that f is a meaningful design expression when compared to the other medoids; and
- the number of terms used in f should be kept low, but not so low that trivial expressions are overly promoted, because this suggests that f is likely to be comprehensible.
Based on this, the fitness function is expressed as follows:

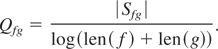
where M is the set of medoids; Sfg is the covariance between functions f and g; and len(f) is the length of function f, which is counted by the number of terminal nodes.
4.5. Termination and final report
Evolutionary computing algorithms are typically terminated when the maximum fitness score achieves a preset level. This requires the fitness scores to be comparable between generations, which is not the case with the GP-HEM. Hence, the termination criteria in this case are crudely set to terminate the GP search algorithm after a preset number of iterations.
On termination of the evolutionary search algorithm, the results are compiled into a final report. This report is effectively the user interface of the method, and hence, it is important to ensure this report is meaningful to designers. This is achieved by reporting the functions in the simplest version possible. The report identifies pairs of functions that are both highly correlated and quite different with respect to the terminal nodes they contain.
The first step of the reporting function is to take a final measurement of the fitness of all the candidate solutions. This is performed in the same manner as previously and thus requires the population to be clustered into islands one last time. The next step is to identify “high-quality” pairs of candidate solutions from the population. This quality is measured by the pairs that have high covariance; are short; and come from different islands. This is computed for the function pair (f, g), where f and g are from different islands, as follows:
Function pairs are then reported, starting with the associated pair that scored the highest quality measure. The report displays the two functional form, in standard algebraic format, and the quality score for that pair.
5. CASE STUDY: FLAT SCREEN DISPLAY
To test and illustrate the functionality of the GP-HEM a small design case study was developed. A flat screen display domain was created by defining a small set of relationships between the design parameters (aspects of the design determined by the designer) and objectives (aspects of the design determined by the parameters). These relationships were designed to be sufficiently complex that all the design objectives could not only be expressed in terms of the design parameters. As the relationships were known before the analysis, it was possible to measure how well the analysis method performs.
5.1. Design space definition
The design space of the panel was represented by four design parameters and four objective criteria, forming an eight dimensional space. The design parameters were: width (x), height (y), depth (d), and material (ρ), all of which were randomly sampled from a uniform distribution. The objective criteria were weight, cost, life expectancy, and sales volume. These were related as follows:


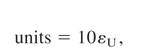
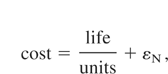
where εN and εU represent noise and are randomly sampled values from a normal and uniform distribution, respectively. Note that the number of units sold was modeled only by a random value. This represents the subjective nature of the customer population. A key aim of this case study was to find out an explicit relationship for this objective based on the remaining parameters. In addition, all objectives had a small amount of Gaussian noise added. This was supposed to represent the noise occurring in real-world domains due to other factors that this simple model did not include.
Finally, a database of 200 examples was created from this model. This represented the “past designs” that would form the basis of the analysis. The size of this database was set similar to other product databases that would be analyzed.
5.2. Domain analysis
In addition to supplying a database of previous examples, the GP-HEM has three running parameters that need to be supplied. These determine how the analysis will be performed:
- population size: how many relationships to hold for consideration during each iteration;
- number of clusters: how many islands to create; and
- number of iterations: number of generations to allow the search process to run.
For this case study, the parameters were as follows: the population size was set to 100, this population was to be split into 10 clusters, and the GP was allowed to run for 10 generations. After the run, the top 10 relationships (pairings) were reported as follows:

Although most of these relationships do not fully extract components of the original model, a number of useful design heuristics are reported. Further, this report illustrates how the quality function [Eq. (2)] scores the pairings.
The following paragraphs analyze the report with respect to each of the design objectives.
5.2.1. Weight-related relationships
This was the only relationship not to be fully discovered. Coarse approximations for weight are given in relationships 1, 9, and 10 (note that relationships 9 and 10 are effectively the same). The principal reason that the full relationship for weight is difficult to recover is that a total of five terms are required. The fitness and quality functions both penalize heavily on total expression length, which in this case is overly severe. Relationship 1 (i.e., the strongest according to the quality measure) does express that the thickness of the design has the strongest effect on the design weight. A more accurate version can be inferred from relationships 2 and 10, which is that weight is strongly dependent on the thickness times the material density (ρ).
Relationships 3 and 4 are of little meaning, as weight is repeated in both halves of the relationship. This has the effect of increasing the covariance, and hence the quality score artificially.
5.2.2. Life-related relationships
Life was directly linked to the material choice (ρ). This was introduced as a single trivial relationship to test if the method would be able to extract these. This was extracted in relationship 2. The fact that it was not rated as the top relationship in terms of quality is a reflection of the effect of added noise.
5.2.3. Units-related relationships
The units objective, designed to reflect the sales volume, was drawn from a uniformly random sample. This was done to reflect the subjective nature of this objective, at least to the degree that it could not be described by the design parameters alone. Relationships 5 and 8 accurately report on the relationships between units and the rest of the product description. Relationship 3 also involves units; however, this is only as part of a relationship between the weight and itself and thus should be discounted.
5.2.4. Cost-related relationships
The cost objective could only be derived from other design objectives. This was to demonstrate one of the motivating factors of this approach: the ability to identify design relationships not only derivable from design parameters. Such relationships are important in design, as they provide knowledge about the trade-offs that are made regarding a product's objectives. Although it is often feasible to infer such relationships from the design parameters, these tend to be difficult to identify.
In this case study, this relationship is reported twice in different, but equivalent, formats. This relationship was accurately reported in relationships 5 and 8. Again, the low positioning of these reflects how the quality function penalizes long expressions (they both have a total of three terms) and the effect of the added noise.
5.3. Method parameter sensitivity
The GP-HEM has four principal parameters: number of clusters to use, population size, crossover policy, and number of generations to run for before terminating. A series of independent experiments were run to investigate the sensitivity of the GP-HEM to each of these parameters. A common datum point is used throughout all the experiments as a reference point.
As discussed in Section 4.5, one drawback with the GP-HEM is the difficulty in measuring fitness independently of a given generation and cluster configuration. The development of the quality function [Eq. (2)] provides some independent measure of the final report, allowing different runs of the GP-HEM to be compared. In addition to this, an additional manual evaluation for the final report was used. Function pairs were classified into one of five different categories:
Perfect: the function pair is a complete representation of the design relationship;
Good: the function pair is sufficient to identify a trend in the design relationship;
Average: the function pair has a component of the design relationship, but would require some further analysis to identify the design trend;
Misleading: the function pair has a component of the design relationship, but expressed in a misleading manner; and
Wrong: the function pair is completely wrong.
Independent GP-HEM runs can be compared by the categorization profile of each run. Although it might appear to be ideal to extract perfect relationships, a designer is likely to prefer to identify trends in the design domain. As such, a desirable profile is one with a high number of good and average relationships and a low number of misleading and wrong relationships.
5.3.1. Number of islands
The number of islands, or clusters, determines how many different types of “half” relationships can be classified. Clearly, it is essential to set the number of clusters no lower than the number of half relationships that exist in the design domain. However, it is unlikely that this number is known a priori. Therefore, it is good practice to set the number of islands slightly higher than would be expected for the design domain.
The GP-HEM was executed using the flat screen display data set with a series of different clustering settings. The results are presented in Table 1 using the profiles and quality measures. From here, it is can be seen that k = 3 produces the “best” results, in terms of the total number of good and average relationships. An alternative view would be to consider that k = 10, the datum setting, is best in terms of minimizing wasted effort due to wrong or misleading relationships. It is worth noting that the quality range (min/max Q) is nearly constant for all k settings.
Classification profiles and quality ranges for cluster number experiments

5.3.2. GP policy
At the core of any GP algorithm lies the crossover policy. This defines what proportion of the next generation arises from sexual reproduction (crossover), mutation, elite retention, and random injection. The sum of these four must add up to 100% of the new population, and so there were 3 degrees of freedom for this set of experiments. The experiments explicitly changed the crossover, mutation, and elitism proportions allowing the random injection level to be determined by the remaining available population. Each parameter was tested at a low, medium, and high setting, the datum being all three parameters set at medium. Due to the time required to manually inspect each set of results, a subset of the total possible 27 experiments was drawn up. This experiment schedule is listed in Table 2, and the profile results are listed Table 3.
Experiment schedule for the GP cross-over policy

Profile results from the GP cross-over policy assessment

For more detailed analysis, the raw result table is reordered for each policy parameter. For each parameter, the table is presented in order of ascending value of that parameter. Trends for each policy parameter were identified in term of how the profile changed as each individual parameter was increased. From Table 4, we can note the following: a high elitism policy is better; a high crossover policy is better; and a low mutate policy is worst. In respect to the mutate policy, the better policy depends on if the object is to maximize the good and average relationships (in which case use high mutate), or minimize misleading and wrong (in which case use medium mutate).
Profile trends for GP policy parameters

5.3.3. Population
The population represents the number of relationships under consideration in the GP-HEM algorithm. As the relationships are algebraic, there are infinitely many distinct forms that can be created using the given design variables. However, as the aim is to identify simple relationships, this reduces the number of potential candidates. In the flat screen design domain, it would be feasible to enumerate and test all relationships consisting of up to five symbols. However, this approach would not scale to more complex domains. The population size was varied between 50 and 200, each time evaluating the final relationships.
Table 5 contains the results of these runs. From this table it can be seen that there is an optimal population at about n = 50. This is interesting, as it clearly demonstrates that large populations are detrimental to the quality of the final result. However, it is important to bear in mind that the number of clusters will also have an effect on the final outcome: for the smaller populations each cluster will hold few members and for the large population each cluster will hold many members that potentially should not be in the same cluster.
Varying the population size used by GP-HEM

5.3.4. Number of design variables
The GP-HEM uses the design variables as the building blocks for the algebraic relationships. Increasing the number of variables represents an increase in the domain complexity. For this experiment, redundant variables were added. These variables took on random values that had no relationship either to the rest of the design or to each other. Therefore, it was not expected that these variables should appear in meaningful design relationships. However, it must be noted that although the number of variables was increased, there was no similar increase in the number of islands. As a result, each island “contained” more variables on average.
Table 6 contains the results of this these runs. The results show that the GP-HEM is relatively robust to a small increase in the number of (redundant) variables. When the increase becomes large (v = 12 and 16), numerous completely wrong relationships are being reported. However, this will be partly biased due to the number of islands remaining fixed.
Applying the GP-HEM to the design domain with redundant design variables added

5.3.5. Sensitivity to data sample size
An important aspect of any machine learning approach is the volume of data required to obtain “good” results. This set of runs illustrates how the GP-HEM performs with varying amounts of data from which to learn the relationships. The data sample size was varied between 50 and 600 data points.
Table 7 contains the results for these runs. Overall, there is relatively little change in the profile of the results and the range of quality scores. However, with fewer points, there will be a more significant change in the confidence in the relationships. In addition, this set of runs also illustrates how the computational time increases with the increased sample size.
Varying the sample size used by the GP-HEM

5.3.6. Sensitivity to noise
In addition to the sensitivity to sample size, it is important to consider how well a machine learning algorithm handles noisy data sets. In this set of runs, a controlled amount of noise was added to the sample generated from the domain model, ranging from σ = 0 to 1.0.
Table 8 contains the results for these runs. Interestingly, there is very little difference in the profile of the relationships extracted. The main difference in the results between the various noise levels is given by the reduced quality measurements. This is to be expected, as the quality score is based on the covariance between the relationships that will be reduced as a result of adding noise to the original data.
Varying the added noise level to the data

5.3.7. Convergence and termination criteria
The GP-HEM adopted the simple termination criteria of halting after a predetermined number of generations. A set of experiments was run to identify the trends in the performance of GP-HEM with varying the run length from 1 generation through to 20 generations.
Table 9 contains the relationship profiles for all the runs of varying lengths. The primary interest is in the relationships that are classified under good and average. The results show that this stabilizes at nine relationships in total from five generations onward. The poorest two relationship classes, misleading and wrong, remain stable throughout. The perfect relationships reduce rapidly from a relatively high count early in the run through to a stable count of two in later generations.
Relationship profiles after varying number of generations

5.3.8. Computational complexity and scalability issues
The code was written as a set of Matlab functions. This provided a good code developing and testing environment at the cost of execution speed. The bottleneck within this environment lies in the evaluation of the population against the design data. Each relationship is evaluated for each data point, mapping it onto a real value using the Matlab eval procedure. The amount of time required for this operation is primarily a function of the complexity of the relationship. By the nature of the GP-HEM's aims, this function complexity is bounded stochastically through the fitness function, and hence, for the purposes of this complexity analysis it shall be assumed to be constant. If there is a population of N expressions and a total of d data points, the total computational complexity in terms of function evaluations is O(Nd) per generation. In addition to this, the data resulting from the expression evaluations is used to compute the covariance between each pair of expressions, which has complexity O(N2). The run times on all the experiments with the flat screen display (v = 8 design variables, d = 200 data points, and N = 100 expressions) ranged between 120 and 2000 s, with the datum point taking about 350 s. The greatest variance in run time arose through varying the relationship population size. This time variance is due to the variance arising in the length of the individual expressions, which is a stochastic variable. However, with each generation, the potential maximum complexity of the relationships increases. These results were obtained running Matlab on a single 2.8-GHz Intel-based processor with 1 GB of RAM available.
The second computational bottleneck lies in the clustering algorithm. The clustering algorithm is supplied with pairwise distances between all the population members, and then it greedily identifies the best clustering of these (see Appendix A). In addition, this is only weakly dependent on how many design variables there are. The term weakly is used in this case as the Matlab evaluation function in this case appears to be near constant with respect to the number of variables. The number of design variables only comes into effect when computing the pairwise distance between two relationships using the hash function described in Section 4.3.2, and then only has a small effect on the total computation time for that function. The complexity of the PAM algorithm is O(N2), which dominates the O(Nv) complexity of the hashing functions (where v is the number of design variables) as it is expected that v < N.
The computational complexity of the GP operations will be O(N), as there is one operation per new population member. The complexity of the termination decision is constant under this implementation: it is simply a check on how many generations have been produced. Finally, the computational complexity of the final report generation is similar to the fitness evaluation, namely O(N2) + O(Nd).
In addition to the computational complexity issues, the data volume needed for trustworthy results also needs to be considered. Effectively, this asks the question: how small a (data) scale can be meaningfully processed with the GP-HEM? This is dependent on how noisy the data set is. The majority of the experiments run for this paper had a relatively small amount of noise added (σ = 0.1), and used a total of 200 data points. This proved to be ample data, and similar results were obtained using both noisier data sets and smaller data sets. The GP-HEM scales well in terms of number of design variables, provided the number of islands used is also scaled. Trials with extra independent variables were run, with little effect to the final outcome. The number of islands effectively controls the complexity: increasing the number of islands decreases the complexity of the expressions in the population. However, with more islands to spread the population (and complexity) across will require the generation of a lengthier final report.
The only aspect that has not been considered when scaling the problem domain is the interpretation of the results. With a more complex domain, the extracted relationships will also be more complex. In this paper, a simple case study is used to demonstrate and test the approach. The relationships are easily evaluated by a “domain expert.” The next development phase for the GP-HEM requires testing in more complex domains, and reviewing how this affects the time required by the domain experts to review the interim results.
5.4. Discussion
The analysis of this design case study has illustrated the nature of the relationships that can be extracted, along with some of the weaknesses of the implementation. A significant number of design heuristics were extracted that provide an understanding of how the design variables are related through trade-offs. These were not only based on design parameters, but they also could provide an understanding of how the design characteristics were related.
The principal weakness is evident in the scoring functions, both fitness [Eq. (1)] and quality [Eq. (2)]. It is not possible to compare fitness function score directly between population generations. This is important to enable measuring of how well the population is improving overall between generations and to provide a more intelligent stop criteria. The quality scoring function has two drawbacks: first, it penalizes important long expression too heavily, and second it scores tautological relationships too highly (e.g., relationship 3). The first issue should be able to be rectified by modifying the nature of the length penalty. The second issue will require an extra penalty component to the quality function reflecting on the amount of overlap in design variables between the two halves of the relationship.
6. CONCLUSIONS
The GP-HEM introduced in this paper is a novel means for extracting simple rules from a database of previous designs. This provides a means for more rapidly documenting the design domain by providing relationships between the key design variables. Once this documentation exists, it can be used by a larger population of designers, in particular where the design of the product is possibly being undertaken by nonexperts. It is important that their creativity is kept within feasible design constraints and that the best estimates are provided for the objective functions. This is to provide high-quality feedback rapidly to designers, potentially through an expert systemlike interface. As such, the quantitative rules are effectively transformed into qualitative design heuristics. This allows designers to explore rapidly the conceptual design space intelligently, with minimal restriction on creativity.
6.1. Comparison of GP-HEM with other data mining approaches
Data mining, and more specifically, methods for gaining rule-based understanding of data sets, has been of interest since computational resources have become readily accessible. There are two independent drivers for this research: ever larger databases require digesting to present a manageable overview of the data, and to provide computationally simpler versions of complex models using data samples taken from the complex models. This paper has been primarily concerned with the second driver.
Model induction methods can be broadly divided into two categories: classifiers and regression models. Classifiers provide a true/false test that a given data point belongs to a specific class. These classifiers are analyzed and characterized according to their prediction strength. This provides a good understanding of how well any classifier performs. As described in Section 2.4, neural networks can be trained to classify and these can then be examined to extract the classification rules (Corbett-Clark, 1998; Huang & Xing, 2002). Although these rules do provide transparency to the neural network, they do not provide comprehensibility. More recently, Johansson et al. (2004) and Duch et al. (2004) identify with this need for comprehensibility. Both papers report on methods for generating comprehensible classifier rules. Johansson et al. (2004) use GP techniques for identifying comprehensible propositional logic statements that encode classification rules. These are evaluated based on their accuracy and comprehensibility, effectively trading accuracy for comprehensibility. Unfortunately, no details are provided on the nature of these metrics. Duch et al. (2004) also extract propositional classification rules, but optimizes the extracted rules using a specific set of rule transformations that trade rule accuracy against simplicity.
Regression rules provide mappings between continuous input variables and output variables. The nature of the mapping will be determined in part by the regression model and its parameter settings. In general terms, the aim is to identify suitable models such that the error in mapping of a known dataset is minimized (Wegkamp, 2003). However, even when constraining the complexity, the space of all models is huge. Early “science discovery” methods used exhaustive search algorithms to greedily search the model space (Langley et al., 1987); however, this approach does not take model comprehensibility into account. Support vector machines (SVMs) provide another type of regression model. The SVM has the ability to approximate more complex models using direct summation of a small number of basis functions. The SVM approach has been applied in a wide range of engineering domains and compares well to other metamodeling techniques (Nair et al., 2002; Clarke et al., 2003). However, although SVMs perform well in terms of error minimization, they do not provide comprehensible models that can be readily understood by designers. A review of a number of other metamodeling methods for engineering design is provided by Simpson et al. (2001). This review does stress the importance of comprehensibility, and highlights the challenges when multiple objectives are to be taken into account.
The GP-HEM identifies simple regression models with a critical difference to the above methods: all the above reported methods treat design parameters and objectives differently. They aim to identify a set of independent regression models oi = fi(x) for each design objective, oi. This is a natural approach, as it provides explicit models for each design objective independently. However, designers also benefit from understanding the trade-offs made between objectives. Identifying relationships between objectives thus provides the designer with a clear holistic understanding of the product's behavior. An example of this is given by relationship 5 (life/cost and units), relating the three design objectives (Section 5.2.3).
The GP-HEM identification method is based on a novel implementation of the islands approach from the well-known GP methodology. This simple addition to the GP methodology greatly extends the nature of the rules that are reported. As noted previously, “traditional” regression model identification methods search for equations for each objective function independently, using only the design parameters as terminal nodes for the function trees. The approach adopted in this paper removes that restriction. As demonstrated in the case study (Section 5), there are relationships that cannot be described using only design parameters. These frequently represent some behavior external to the design, for example, the customer population's subjectivity. However, these are very important relationships to extract and use when designing products.
The weakness of with the GP-HEM is that there is little direct control over the accuracy of the micromodels. Partial control is exerted through the fitness function, which promotes accurate micromodels through measuring how well the models correlate given the data sample taken from the domain. The comprehensibility is similarly controlled by promoting smaller micromodels. However, as the evolutionary algorithm is stochastic, it is not possible to predict exactly how the models progress. This is a significant difference to the deterministic approaches used by most other methods described in Section 2.4.
The empirical results demonstrate that simple relationships are being successfully extracted. These relationships tend to require expert interpretation to provide understanding of the domain, as they are not necessarily extracted in the most meaningful form. However, these are still helpful in providing insight into the trends and trade-offs between sets of parameters. Such relationships can be used to direct designers towards how to modify designs to match new design requirements.
6.2. Future work
There are aspects of this approach that require further work. As with all evolutionary approaches, the key element is the fitness function. The empirical evidence presented in the examples and the case study indicates that the parsimony bias is too strong, thus preventing the more complex solutions from being reported. Further, a major difficulty in this implementation is the lack of population-independent fitness metrics. As the current fitness metric [Eq. (1)] is based on the current population, it is impossible to track the overall performance of the search between generations. One possible technique to be explored is replacing the current single fitness function by a set of competing fitness functions and to use Pareto ranking to determine an individual's relative fitness compared to the rest of the population.
In addition, there are other GP techniques that could improve the performance, for example, encapsulation (Koza et al., 1999). This identifies useful subtrees that should be treated as atomic nodes by introducing them as new terminal nodes during the evolutionary process. However, there is little research available to help identify these subtrees. Further work relating to the use of GP should also consider seeding the initial population with likely first order estimates of candidate solutions that could be obtained from techniques such as principal components analysis.
This work represents ongoing research to address these issues. The aim is to provide a toolkit for examining databases of prior products and provide concise and readily interpretable relationships governing the product family.
ACKNOWLEDGMENTS
This work was undertaken while the corresponding author was fully funded by the University Technology Partnership, a collaborative research project between the Universities of Cambridge, Sheffield, and Southampton; and with industrial partners BAE Systems and Rolls-Royce, PLC. The authors thank the anonymous referees for their comments.
APPENDIX A: PAM CLUSTERING ALGORITHM
The GP-HEM method uses clustering to separate individual candidate solutions into sets of “similar” solutions. As with all clustering algorithms, each cluster is given a representative description. For most clustering algorithms, this representative is computed from the cluster members (e.g., taking the average value of numerical parameters representing the clustered objects). In the GP-HEM algorithm, this is not possible as the space is not continuous. Instead, it is necessary to identify a member from each cluster to represent the cluster.
The PAM algorithm is based around searching for a predetermined set of representative objects (medoids) from a given set (Kaufman & Rousseeuw, 1990). Briefly, the algorithm operates as follows to identify k medoids from a data set:
- Initially, k distinct objects are chosen arbitrarily as medoids.
- For each object, the nearest medoid is identified and its distance noted.
- The total distance between objects and their medoids is then summed for this configuration. A greedy algorithm then searches for the best set of medoids.
- Each medoid is individually swapped for each nonmedoid, and the total distance is measured each time (similar to steps 2 and 3).
- The swap that results in the minimum total distance is kept. This process is repeated from step 2 until no further swaps result in a lower total distance.
The results of this algorithm are the k medoids. Cluster membership is then determined according to which medoid is nearest.
A.1. Illustration
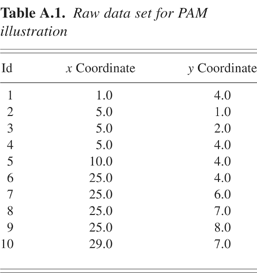
This example is taken from Kaufman and Rousseeuw (1990). Table A.1 contains the coordinates of 10 objects, which have been plotted in Figure A.1. From this data, the euclidean distances are computed between all pairs of points. If k = 2 clusters are to be identified, then the algorithms starts be arbitrarily choosing two medoid candidates, say points 1 and 5. A new table can be drawn up, for each point computing the distance to point 1 and point 5. Table A.2 contains this information and also identifies the clusters for this case. Clearly, this is not a very good clustering. At the final iteration, the medoids are points 4 and 8. Table A.3 is the distance table for this case. Figure A.2 illustrates these two clustering configurations.
Raw data set for PAM illustration
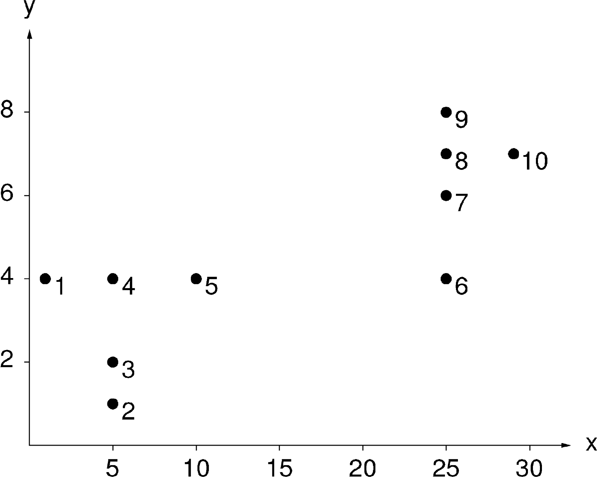
A two-dimensional data plot of 10 objects.
Distance and clusters for first iteration

Table A.3: Distance and clusters for last iteration


The clustering of the first and last iteration.
References
REFERENCES
Ahmed, S.
(2001).
Understanding the use and reuse of experience in engineering
design.
PhD Thesis.
University of Cambridge, Engineering Department.
Ahmed, S. &
Wallace, K.M.
(2004).
Understanding the knowledge needs of novice designers in the
aerospace industry.
Design Studies 25(2),
155–173.CrossRefGoogle Scholar
Andre, D. &
Koza, J.
(1996).
A parallel implementation of genetic programming that achieves
super-linear performance.
Proc. Int. Conf. Parallel and Distributed Processing Techniques
and Applications
(Hamid, R., Ed.),
Vol. 3, pp.
1163–1174,
Athens, GA.
Andrews, R.,
Diederich, J., &
Tickle, A.B.
(1995).
Survey and critique of techniques for extracting rules from trained
artificial neural networks.
Knowledge-Based Systems 8(6),
373–389.CrossRefGoogle Scholar
Arafat, G.H.,
Goodman, B., &
Arciszewski, T.
(1993).
Ramzes: a knowledge-based system for structural concepts
evaluation.
Computing Systems in Engineering 4(2–3),
211–221.CrossRefGoogle Scholar
Arciszewski, T.
(1997).
Engineering semantic evaluation of decision rules.
Journal of Intelligent and Fuzzy Systems 5(3),
285–295.Google Scholar
Arciszewski, T. &
Ziarko, W.
(1992).
Knowledge Acquisition in Civil Engineering, pp.
50–68.
New York:
American Society of Civil Engineers.
Belding, T.C.
(1995).
The distributed genetic algorithm revisited.
Proc. Sixth Int. Conf. Genetic Algorithms
(Eshelman, L., Ed.), pp.
114–121.
San Francisco, CA:
Morgan Kaufmann.
Blessing, L.T.M.
(1994).
A process-based approach to computer-supported engineering
design.
PhD Thesis.
University of Twente.
Clarke, S.M.,
Griebsch, J.H., &
Simpson, T.W.
(2003).
Analysis of support vector regression for approximation of complex
engineering analyses.
Proc. ASME 2003 Design Engineering Technical Conf.,
Paper No. DETC2003/DEC48759,
Chicago.CrossRef
Cohoon, J.P.,
Hegde, S.U.,
Martin, W.N., &
Richards, D.
(1987).
Punctuated equilibria: a parallel genetic algorithm.
Proc. Second Int. Conf. Genetic Algorithms and Their
Application, pp.
148–154.
Hillsdale, NJ:
Erlbaum.
Corbett-Clark, T.A.
(1998).
Explanation from neural networks.
PhD Thesis.
Oxford University, Department of Engineering Science.
Duch, W.,
Setiono, R., &
Żurada, J.M.
(2004).
Computational intelligence methods for rule-based data
understanding.
Proceedings of the IEEE 92(5),
771–805.CrossRefGoogle Scholar
Eastman, C.M.,
Bond, A.H., &
Chase, S.C.
(1991).
A formal approach for product model information.
Research in Engineering Design 2(2),
65–80.CrossRefGoogle Scholar
Gen, M. &
Cheng, R.
(2000).
Genetic Algorithms and Engineering Optimization.
New York:
Wiley.
Goldberg, D.E.
(1989).
Genetic Algorithms in Search, Optimization and Machine
Learning.
Reading, MA:
Addison–Wesley.
Green, G.
(1997).
Modelling concept design evaluation.
Artificial Intelligence for Engineering Design, Analysis and
Manufacturing 11(3),
211–217.CrossRefGoogle Scholar
Heckerman, D.
(1999).
A tutorial on learning with Bayesian networks. In
Learning in Graphical Models
(Jordan, M.I., Ed.), pp.
301–354.
Cambridge, MA:
MIT Press.
Hong, T.P.,
Wang, T.T.,
Wang, S.L., &
Chien, B.C.
(2000).
Learning a coverage set of maximally general fuzzy rules by rough
sets.
Expert Systems with Applications 19(2),
97–103.CrossRefGoogle Scholar
Huang, S.H. &
Xing, H.
(2002).
Extract intelligible and concise fuzzy rules from neural
networks.
Fuzzy Sets and Systems 132(2),
233–243.CrossRefGoogle Scholar
Hwang, S.Y. &
Yang, W.S.
(2002).
On the discovery of process models from their instances.
Decision Support Systems 34(1),
41–57.CrossRefGoogle Scholar
Ishino, Y. &
Jin, Y.
(2002).
Estimate design intent: a multiple genetic programming and
multivariate analysis approach.
Advanced Engineering Informatics 16(2),
107–125.CrossRefGoogle Scholar
Jenkins, W.M.
(1996).
A genetic algorithm for structural design optimization.
Proc. NATO Advanced Science Institutes. Series F: Computer and
Systems Sciences. Emergent Computing Methods in Engineering Design:
Applications of Genetic Algorithms and Neural Networks,
Vol. 149, pp.
30–52.
Berlin:
Springer–Verlag.CrossRef
Johansson, U.,
Niklasson, L., &
König, R.
(2004).
Accuracy vs. comprehensibility in data mining models.
Proc. Seventh Int. Conf. Information Fusion
(Svensson, P. &
Schubert, J., Eds.), Vol. 1, pp.
295–300, Mountain View, CA.
Kaufman, L. &
Rousseeuw, P.J.
(1990).
Finding Groups in Data: An Introduction to Cluster Analysis,
Probability and Mathematical Statistics.
New York:
Wiley.CrossRef
Koza, J.R.
(1992).
Genetic Programing: On the Programming of Computers by Means of
Natural Selection, Complex Adaptive Systems.
Cambridge, MA:
MIT Press.
Koza, J.R.,
Bennet, F. H., III,
Andre, D., &
Keane, M.A.
(1999).
Genetic Programming III: Darwinian Invention and Problem
Solving.
San Francisco, CA:
Morgan Kaufmann.
Kusiak, A.
(2001).
Rough set theory: a data mining tool for semiconductor
manufacturing.
IEEE Transactions on Electronic Packaging Manufacturing 24(1),
44–50.CrossRefGoogle Scholar
Lakshminarayanan, S.,
Fujii, H.,
Grosman, B.,
Dassau, E., &
Lewin, D.R.
(2000).
New product design via analysis of historical databases.
Computers and Chemical Engineering 24(2),
671–676.CrossRefGoogle Scholar
Langley, P.,
Simon, H.A.,
Bradshaw, G.L., &
Żytkow, J.M.
(1987).
Scientific Discovery: Computational Explorations of the Creative
Processes.
Cambridge, MA:
MIT Press.
Lawrence, S.,
Tsoi, A.C., &
Back, A.D.
(1996).
Function approximation with neural networks and local methods: Bias,
variance and smoothness.
Proc. Australian Conf. Neural Networks
(Bartlett, P.,
Burkitt, A. &
Williamson, R., Eds.), pp.
16–21, Australian National University.
Leake, D.B.,
Birnbaum, L.,
Hammond, K.,
Marlow, C., &
Yang, H.
(1999).
Case-Based Reasoning Research and Development 1999.
Lecture Notes in Artificial Intelligence,
Vol. 1650, pp.
482–496.
Berlin:
Springer–Verlag.
Maire, F.
(1999).
Rule-extraction by backpropagation of polyhedra.
Neural Networks 12(4–5),
717–725.CrossRefGoogle Scholar
Malmqvist, J. &
Schachinger, P.
(1997).
Towards an implementation of the chromosome model—Focusing the
design specification.
Proc. 11th Int. Conf. Engineering Design
(Riitahuhta, A., Ed.),
Vol. 3, pp.
203–212,
Tampere University of Technology.
Matthews, P.C.
(2002).
The application of self organizing maps in conceptual design.
PhD Thesis.
University of Cambridge, Engineering Department.
Michalski, R.S. &
Kaufman, K.A.
(1997).
Data mining and knowledge discovery: a review of issues and a
multistrategy approach. In
Machine Learning and Data Mining: Methods and Applications
(Michalski, R.S.,
Bratko, I. &
Kubat, M., Eds.), pp.
71–112.
Chichester:
Wiley.
Michalski, R.S. &
Tecuci, G., Eds.
(1994).
Machine Learning: A Multistrategy Approach,
Vol. IV.
San Francisco, CA:
Morgan Kaufmann.
Mitchell, T.M.
(1997).
Machine Learning.
New York:
McGraw–Hill.
Modesitt, K.L.
(1992).
Basic principles and techniques in knowledge acquisition.
In
Knowledge Acquisition in Civil Engineering, pp.
11–49.
New York:
American Society of Civil Engineers.
Nair, P.B.,
Choudhury, A., &
Keane, A.J.
(2002).
Some greedy learning algorithms for sparse regression and
classification with Mercer kernels.
Journal of Machine Learning Research, 3,
781–801.Google Scholar
Popovic, V.
(2004).
Expertise development in a product design—Strategic and
domain-specific knowledge connections.
Design Studies 25(5),
527–545.CrossRefGoogle Scholar
Potter, M.A.
(1997).
The design and analysis of a computational model of cooperative
coevolution.
PhD Thesis.
George Mason University.
Potter, M.A. &
De Jong, K.A.
(2000).
Cooperative coevolution: an architecture for evolving coadapted
subcomponents.
Evolutionary Computation 8(1),
1–29.CrossRefGoogle Scholar
Potter, M.A.,
De Jong, K.A., &
Grefenstette, J.J.
(1995).
A coevolutionary approach to learning sequential decision
rules. In
Proc. Sixth Int. Conf. Genetic Algorithms
(Eshelman, L., Ed.), pp.
366–372.
San Francisco, CA:
Morgan Kaufmann.
Reich, Y. &
Barai, S.V.
(1999).
Evaluating machine learning models for engineering problems.
Artificial Intelligence in Engineering 13(2),
257–272.CrossRefGoogle Scholar
Rosenman, M.
(2000).
Case-based evolutionary design.
Artificial Intelligence for Engineering Design, Analysis and
Manufacturing 14(1),
17–29.CrossRefGoogle Scholar
Shadbolt, N.R. &
Milton, N.
(1999).
From knowledge engineering to knowledge management.
British Journal of Management 10(4),
309–322.CrossRefGoogle Scholar
Siddall, J.N.
(1986).
Probabilistic modelling in design.
ASME Journal of Mechanisms, Transmissions, and Automation in
Design 108(3),
330–335.CrossRefGoogle Scholar
Simpson, T.W.,
Peplinski, J.D.,
Koch, P.N., &
Allen, J.K.
(2001).
Metamodels for computer-based engineering design: survey and
recommendations.
Engineering with Computers 17(2),
129–150.CrossRefGoogle Scholar
Smith, R.P. &
Morrow, J.
(1999).
Product development process modeling.
Design Studies 20(3),
237–261.CrossRefGoogle Scholar
Tanese, R.
(1989).
Distributed genetic algorithms for function optimization.
PhD Thesis.
University of Michigan.
Thornton, A.C.
(1996).
The use of constraint-based design knowledge to improve the search
for feasible designs.
Engineering Applications of Artificial Intelligence 9(4),
393–402.CrossRefGoogle Scholar
Wegkamp, M.
(2003).
Model selection in nonparametric regression.
The Annals of Statistics 31(1),
252–273.CrossRefGoogle Scholar
Wiegand, R.P.,
Liles, W.C., &
De Jong, K.A.
(2001).
An empirical analysis of collaboration methods in cooperative
coevolutionary algorithms.
Proc. Genetic and Evolutionary Computation Conf.
(GECCO2001)
(Spector, L.,
Goodman, E.D.,
Wu, A.,
Langdon, W.B.,
Voigt, H.-M.,
Gen, M.,
Sen, S.,
Dorigo, M.,
Pezeshk, S.,
Garzon, M.H. &
Burke, E., Eds.), pp.
1235–1242.
San Francisco, CA:
Morgan Kaufmann.
Żytkow, J.M.
(1999).
The melting pot of automated discovery: principles for a new
science. In
Discovery Science: Second Int. Conf. Lecture Notes in Artificial
Intelligence,
Vol. 1721, pp.
1–12.
Berlin:
Springer–Verlag.
Żytkow, J.M.
(2000).
Automated discovery: a fusion of multidisciplinary
principles. In
Advances in Artificial Intelligence. Lecture Notes in Artificial
Intelligence,
Vol. 1822, pp.
443–448.
Berlin:
Springer–Verlag.

The overall procedure for generating the design relationship report. This paper concentrates on the right-hand side of the figure.

The interaction between the components: the algorithm iterates between the GP and the micromodels components until termination, when the report generation module is used.
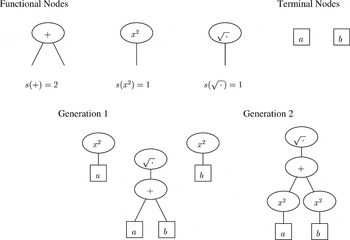
The creation of functional trees, using functional nodes for addition, squaring, and square root and terminal nodes a and b.

The overall process flow of the GP-HEM. Each iteration modifies the current population to provide the population for the next iteration.
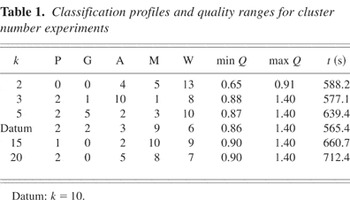
Classification profiles and quality ranges for cluster number experiments
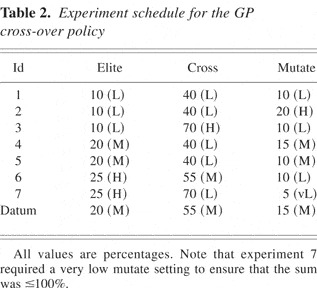
Experiment schedule for the GP cross-over policy
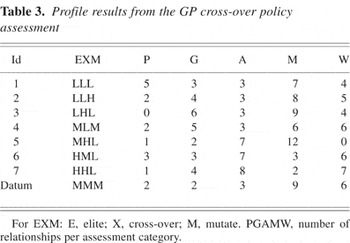
Profile results from the GP cross-over policy assessment
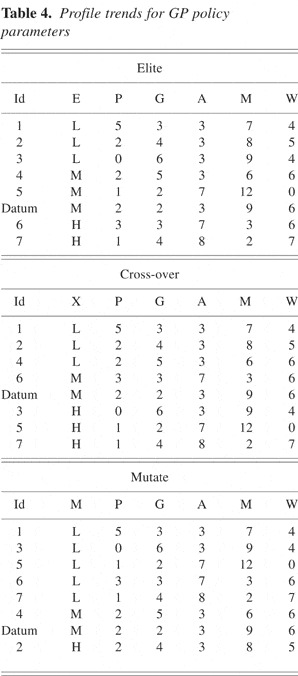
Profile trends for GP policy parameters
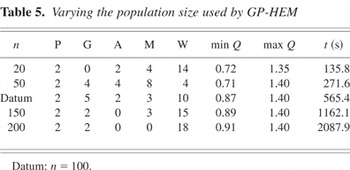
Varying the population size used by GP-HEM
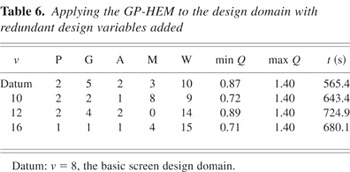
Applying the GP-HEM to the design domain with redundant design variables added
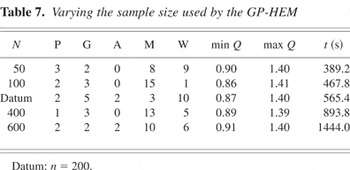
Varying the sample size used by the GP-HEM
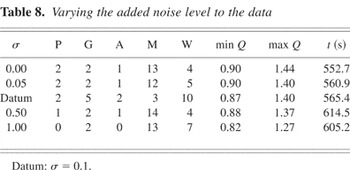
Varying the added noise level to the data
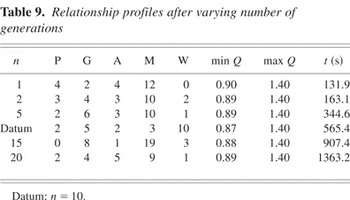
Relationship profiles after varying number of generations
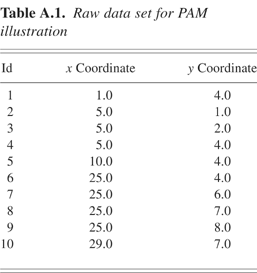
Raw data set for PAM illustration
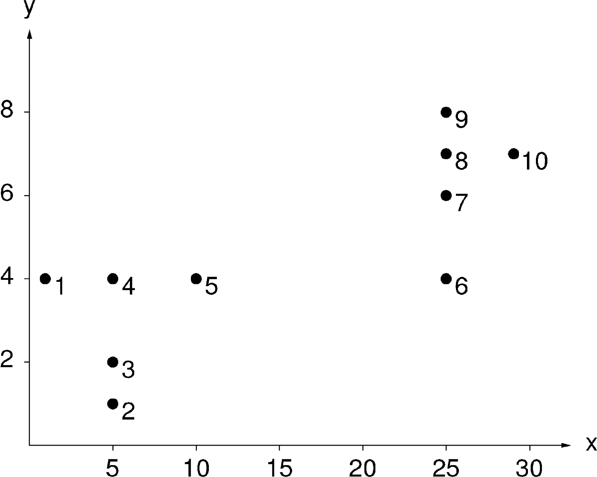
A two-dimensional data plot of 10 objects.
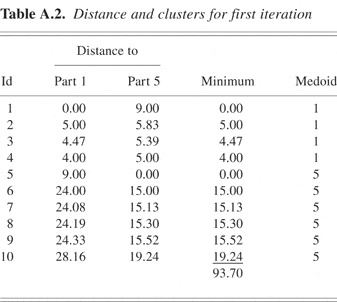
Distance and clusters for first iteration
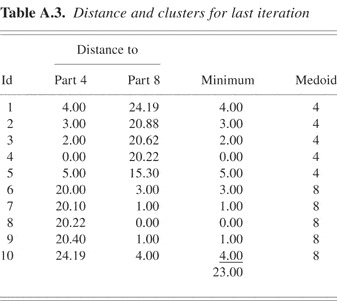
Table A.3: Distance and clusters for last iteration
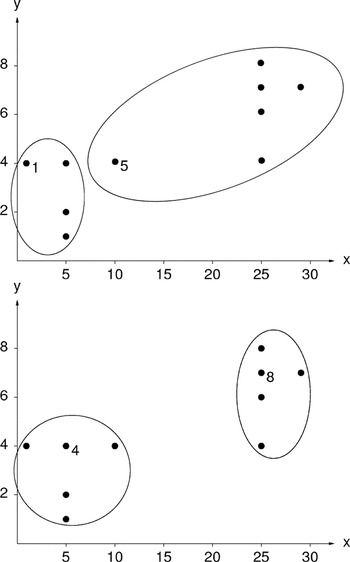
The clustering of the first and last iteration.
 You have
Access
- 3
- Cited by