Polyphenols are a group of bioactive phytochemicals widely present in plant-based foods, including fruits, vegetables, whole grains, tea, coffee and wine(Reference Carnauba, Sarti and Hassimotto1). Dietary polyphenols comprise several main subclasses, including flavonoids, phenolic acids and lignans(Reference Durazzo, Lucarini and Souto2). Animal studies suggested that polyphenols exhibit multiple health-promoting properties, particularly their anti-inflammatory, antioxidant, antitumour and oestrogenic-like effects (Reference Moorthy, Sundralingam and Palanisamy3,Reference Maleki, Crespo and Cabanillas4) .
Emerging epidemiological studies focus on the health benefits of polyphenols, yet findings remain inconsistent(Reference Durazzo, Lucarini and Souto2). While many studies report inverse associations between the intake of total dietary polyphenols or their subclasses and the risk of certain cancers (Reference Gardeazabal, Romanos-Nanclares and Martínez-González5,Reference Fike, Munro and Yu6) , CVD (Reference Li, Xu and Ma7,Reference Rubín-García, Vitelli-Storelli and Álvarez-Álvarez8) and mortality (Reference Chen, Qian and Hu9,Reference Mérida, Vitelli-Storelli and Moreno-Franco10) , others have failed to observe such relationships (Reference Hertog, Sweetnam and Fehily11,Reference Godos, Vitale and Micek12) . These discrepancies may be partly attributable to differences in dietary assessment methods(Reference Xu, Le Sayec and Roberts13). Most studies (Reference Gardeazabal, Romanos-Nanclares and Martínez-González5–Reference Godos, Vitale and Micek12) utilised FFQ to estimate dietary polyphenol intake, yet only a limited number have validated FFQ for measuring total polyphenols (Reference Burkholder-Cooley, Rajaram and Haddad14,Reference Hoge, Guillaume and Albert15) and their subclasses (Reference Kent and Charlton16,Reference Yue, Petimar and Willett17) . Given the diverse dietary sources of polyphenols, FFQ with restricted food items may lead to incomplete intake assessment. In contrast, 24-h dietary recalls (24HDR) allow detailed reporting of specific foods and portion sizes, enabling a more comprehensive estimation of polyphenol intake without imposing high literacy demands. Consequently, 24HDR are increasingly employed in large-scale epidemiological studies and national nutrition surveys(Reference Okada, Nakade and Hanzawa18), with a growing number of studies using them to assess total polyphenols and their subclasses(Reference Lanuza, Zamora-Ros and Bondonno19–Reference Zhao, Gao and Ding21). However, a single or limited number of recalls may not adequately capture long-term dietary habits, whereas excessive recalls can increase participant burden, reduce compliance and compromise data reliability(Reference Huang, Zhao and Fang22,Reference Willett23) . Therefore, there is a need to identify the optimal number of 24HDR required for reliably estimating habitual intake of total polyphenols and their subclasses in epidemiological research. Although a few studies have investigated the reproducibility and/or validity of 24HDR for assessing meal timing, nutrients, foods, energy intake and several dietary pattern scores(Reference Peterson, Lee and Huybrechts24–Reference Li, Li and Yin30), to our knowledge, no study to date has specifically evaluated the performance of 24HDR in measuring total dietary polyphenols and their major subclasses.
Herein, we examined the reproducibility and relative validity of 24HDR-based assessments of total polyphenols, flavonoids, phenolic acids and lignans to determine the practical number of recalls needed in epidemiological settings. To account for the day-to-day variation in diet (e.g., day of the week and seasonal effect), we used the average of twelve 24HDR (i.e. 4 quarterly 3 consecutive 24HDR, 2 weekdays and 1 weekend day) over 1 year as the reference method. We also investigated whether age, sex, BMI, day of the week and season of 24HDR administration may influence the performance of 24HDR.
Methods
Study population
The Anhui Liver Diseases Study (ALDS) is an ongoing community-based cohort started in 2020, recruiting approximately 6200 free-living adults aged 18 years or older from the two cities (Lu’an and Ma’anshan) in Anhui Province, central-eastern China. Details of the ALDS design were described previously(Reference Huang, Zhang and Zhang31,Reference Pan, Yang and Peng32) . To validate dietary and lifestyle questionnaires used in the ALDS and other cohorts in Anhui, the Anhui Lifestyle Validation Study (ALVS) was conducted from July 2021 to July 2022(Reference Li, Sun and Han29,Reference Li, Li and Yin30,Reference Zhang, Liang and Sun33) . A total of 892 participants including 754 from the ALDS and 138 volunteers from other cities in Anhui were enrolled in the ALVS. Dietary data were collected by FFQ at baseline and again after 1 year. During the FFQ assessments, we performed 12-d dietary recalls that consisted of four quarterly three consecutive 24HDR (i.e. 2 weekdays and 1 weekend) while accounting for the day of the week and seasonal effects in dietary assessment.
For the present analysis, all participants were drawn from the ALVS cohort, specifically the 754 individuals originally recruited from the ALDS. We excluded those who did not complete any 24HDR (n 295) or had implausible energy intake (n 27), defined as values below the 2·5th percentile or above the 97·5th percentile. Thus, the final analytical sample comprised 432 participants (Supplementary Fig. 1). The study protocol was approved by the Ethics Committee of Anhui Medical University (protocol number: 20210730), and all participants signed an informed consent form before enrolment.
Assessment of dietary polyphenols
All 24HDR were administered by trained and experienced interviewers via telephone, following the USDA Automated Multiple-Pass Method (AMPM)(Reference Rhodes, Murayi and Clemens34), under the supervision of two registered dietitians. The interviewers manually recorded all dietary data during the calls without utilising automated dietary software. The AMPM is designed to improve completeness and accuracy of dietary reporting while minimising respondent burden. Participants were asked to recall all foods and beverages consumed during the previous 24 h, including details on timing, eating occasions and portion sizes. Given the variability in household recipes across the study area, participants also reported the ingredients and approximate proportions of mixed dishes. A food-amount booklet was used during interviews to assist with portion-size estimation.
To account for seasonal variation, each participant completed four quarterly sets of three consecutive 24HDR (2 weekdays and 1 weekend day) in October 2021 (Autumn), January 2022 (Winter), April 2022 (Spring) and June 2022 (Summer). Within each season, one of two predefined recall sequences, including Thursday to Saturday and Sunday to Tuesday, was randomly assigned to each participant to capture potential weekday–weekend differences in dietary intake.
Daily polyphenol intake (mg/d) was calculated by using the daily food intake (g/d) multiplied by its polyphenol content (mg/100g) and divided by 100. Polyphenol content data were sourced from the Phenol-Explorer database (www.phenol-explorer.eu). The subclass of stilbenes was excluded from total polyphenol intake calculations due to its typically low daily consumption (average <0·01 mg/d) in this population.
Food items reported in the 24HDR were matched to Phenol-Explorer entries based on food name and food group similarity, supplemented by the Chinese Food Composition Table when necessary. For food items without available polyphenol content values, we adopted a conservative approach and assigned a value of zero contribution to the corresponding polyphenol subclass. We did not apply retention factors for cooking and processing, as our estimates were based on the polyphenol content of raw or unprocessed foods from the Phenol-Explorer database.
Assessment of covariates
We used a self-reported questionnaire to collect demographic and lifestyle information at baseline, including age, sex, marital status, education level, annual household income, smoking, alcohol consumption and physical activities. Participants’ height and weight were measured a single time by trained investigators using calibrated Meile Health MG001 height–weight scales, following standard operating procedures in accordance with the Anthropometric Methods for Population Health Surveillance ( WS/T 424–2013 ) issued by the Ministry of Health of China. BMI was calculated by dividing body weight (kg) by squared height (m2). Physical activity was quantified as metabolic equivalent tasks (MET) in hours per week. Total energy intake was assessed as kilocalories per day.
Statistical analysis
To simulate real-world dietary recall practices, we randomly selected six sets of non-consecutive recalls (1 to 6 d) from the 12-d records. For each participant and recall number (2 to 6 d), one eligible non-consecutive combination was retained per recall number; if any selected days were consecutive, the random numbers were regenerated until the requirement was satisfied. The intraclass correlation coefficient (ICC) for each recall number was calculated from this single combination per participant and was not averaged across repeated selections; the 1000 bootstrap iterations were instead used to estimate the bootstrap mean and 95 % CI of the ICC. Reproducibility was evaluated using ICC for estimates derived from 2 to 6 non-consecutive 24HDR(Reference Shrout and Fleiss35). In this study, ‘reproducibility’ refers to the consistency of repeated 24HDR-based dietary intake measurements within individuals over time (i.e. within-person reliability)(Reference Willett23). Relative validity was assessed by comparing these estimates against internal reference, defined as the average intake from the twelve 24HDR (four quarterly sets of three consecutive days, covering two weekdays and one weekend day per season over 1 year). This analysis reflects agreement with an internal reference rather than true criterion validity because the test and reference measures were derived from the same dietary assessment method and therefore shared overlapping observations. Bootstrapping with 1000 iterations was used to calculate 95 % CI for both reproducibility and validity coefficients. For subgroup analyses, ICC are reported as point estimates without bootstrapping due to smaller sample sizes. We also calculated r c and 95 % CI that were deattenuated for random measurement errors in the twelve 24HDR(Reference Beaton, Milner and McGuire36,Reference Rosner and Willett37) . For a single randomly sampled 24HDR, r c was calculated using the following formula(Reference Al-Shaar, Yuan and Rosner38):
 ${r_c}\, = \,{r_o}\sqrt {1 + \lambda /k}$
where r o is the observed correlation, λ is the ratio of within- to between-person variance, and k is the number of replicates of the reference method (here, k = 12). For 2 to 6 recalls, the formula extended to:
 ${r_c} = {r_o}\sqrt {(1 + {\lambda _x}/{k_x})(1 + {\lambda _y}/{k_y})}$
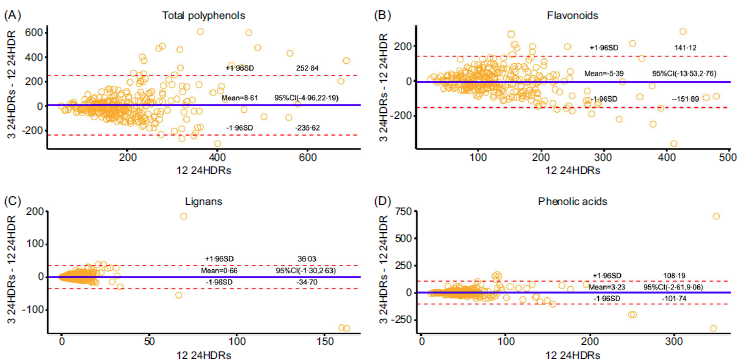
where r c is the deattenuated correlation coefficient, r o is the observed correlation coefficient, x and yare the ratios of within-subject to between-subject variance for the two variables, respectively, and k x and k y are the number of repeated measurements for the two variables (12 d for the reference variable in this study). Correlation strength was categorised as weak (<0·40), moderate (0·40–0·69), strong (0·70–0·89) or very strong (≥0·90)(Reference Schober, Boer and Schwarte39). It should be noted that, during the calculation, validity coefficients or the upper 95 % CI limits might >1 (Heywood cases)(Reference Ocké and Kaaks40); if this occurred, they were set to 1·00. Agreement between estimates from three recalls and the 12-d reference was further examined using Bland–Altman plots, with 95 % limits of agreement (LOA) calculated as the mean difference ± 1·96 sd (Reference Moghames, Hammami and Hwalla41).
To evaluate whether the results were sensitive to the specific recall-day combinations selected, we also calculated ICC using consecutive 2-d and 3-d 24HDR. We additionally performed analyses using energy-adjusted polyphenol intakes (nutrient density) to examine whether the results were influenced by total energy intake.
Subgroup analyses evaluated whether age (<45 v. ≥45 years), sex, BMI (<24 v. ≥24 kg/m2), recall timing (weekday v. weekend) and season (autumn/winter v. spring/summer) influenced the performance of the 3-recall method for polyphenol assessment(Reference Zhou42). All analyses were conducted using SAS (version 9.4), R (version 4.3.3) and its packages including ggplot2, boot, plm, irr, lpSolve and cor function. A two-sided P < 0·05 was considered statistically significant.
Results
Characteristics of participants
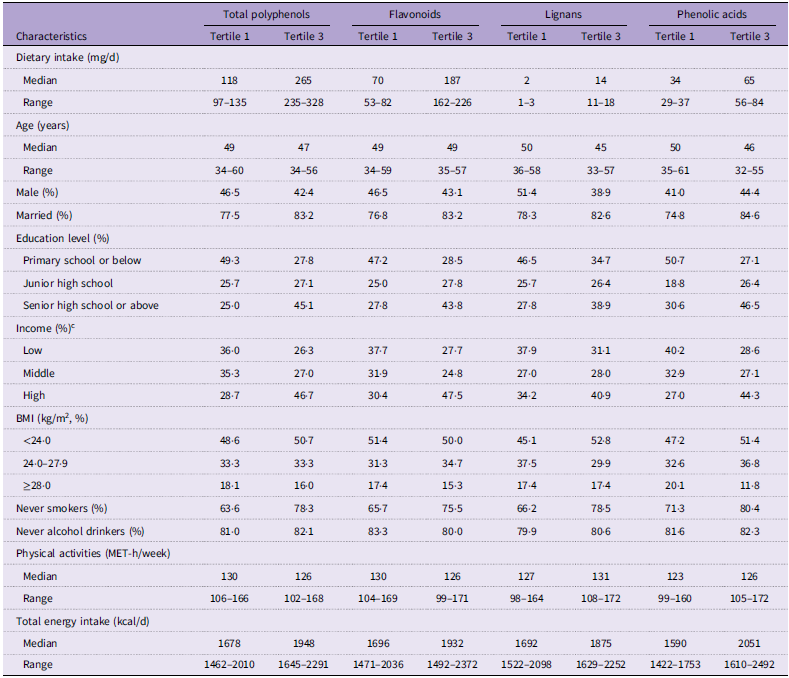
A total of 432 participants (247 females and 185 males) were included in the analysis, with a median age of 48 years (interquartile range: 34–58 y). Participants with higher intake of these four polyphenol categories were more likely to be married, never smokers, better educated, have higher household incomes and report greater total energy intake (Table 1). Median intake estimates for these four polyphenol categories estimated from different number of 24HDR were similar to that from the 12-d reference method (Supplementary Table S1). Compared with excluded participants, those included tended to be older, more likely to be female and married, had higher education levels and were more likely to be never smokers, whereas the two groups were similar with respect to BMI, income and alcohol drinking status (Supplementary Table S2).
Characteristics of the study population (n 432) according to tertiles of dietary polyphenol and subclass intake in the ALVS (2021–2022) a , b

Table 1. Long description
A table comparing dietary intake and characteristics of a study population based on polyphenol consumption. The table has 18 rows and 12 columns. Column headers include Total polyphenols, Flavonoids, Lignans, and Phenolic acids, each with Tertile 1 and Tertile 3 subheaders. Row labels include Dietary intake (mg/d), Age (years), Male (%), Married (%), Education level (%), Income (%), BMI (kg/m2, %), Never smokers (%), Never alcohol drinkers (%), Physical activities (MET-h/week), and Total energy intake (kcal/d). Each row provides median and range values for the respective characteristics across the tertiles. Notable trends include higher median dietary intake values in Tertile 3 compared to Tertile 1 for all polyphenol categories. The table also shows variations in demographic and lifestyle characteristics across the tertiles.
ALVS, Anhui Lifestyle Validation Study; METs, metabolic equivalent tasks.
a Dietary intake estimates of total polyphenols, flavonoids, lignans and phenolic acids were derived from 24-h dietary recalls.
b Continuous variables were expressed as the mean ± sd or median according to the distribution of the variables, while categorical variables are presented as %. Values of polytomous variables may not sum to 100 % due to missing values or rounding.
c Low: 10 000 Yuan per person per year or less; middle: 10 000–19 999 Yuan per person per year; high: 20 000 Yuan per person per year or more.
The reproducibility of two to six 24-h dietary recalls
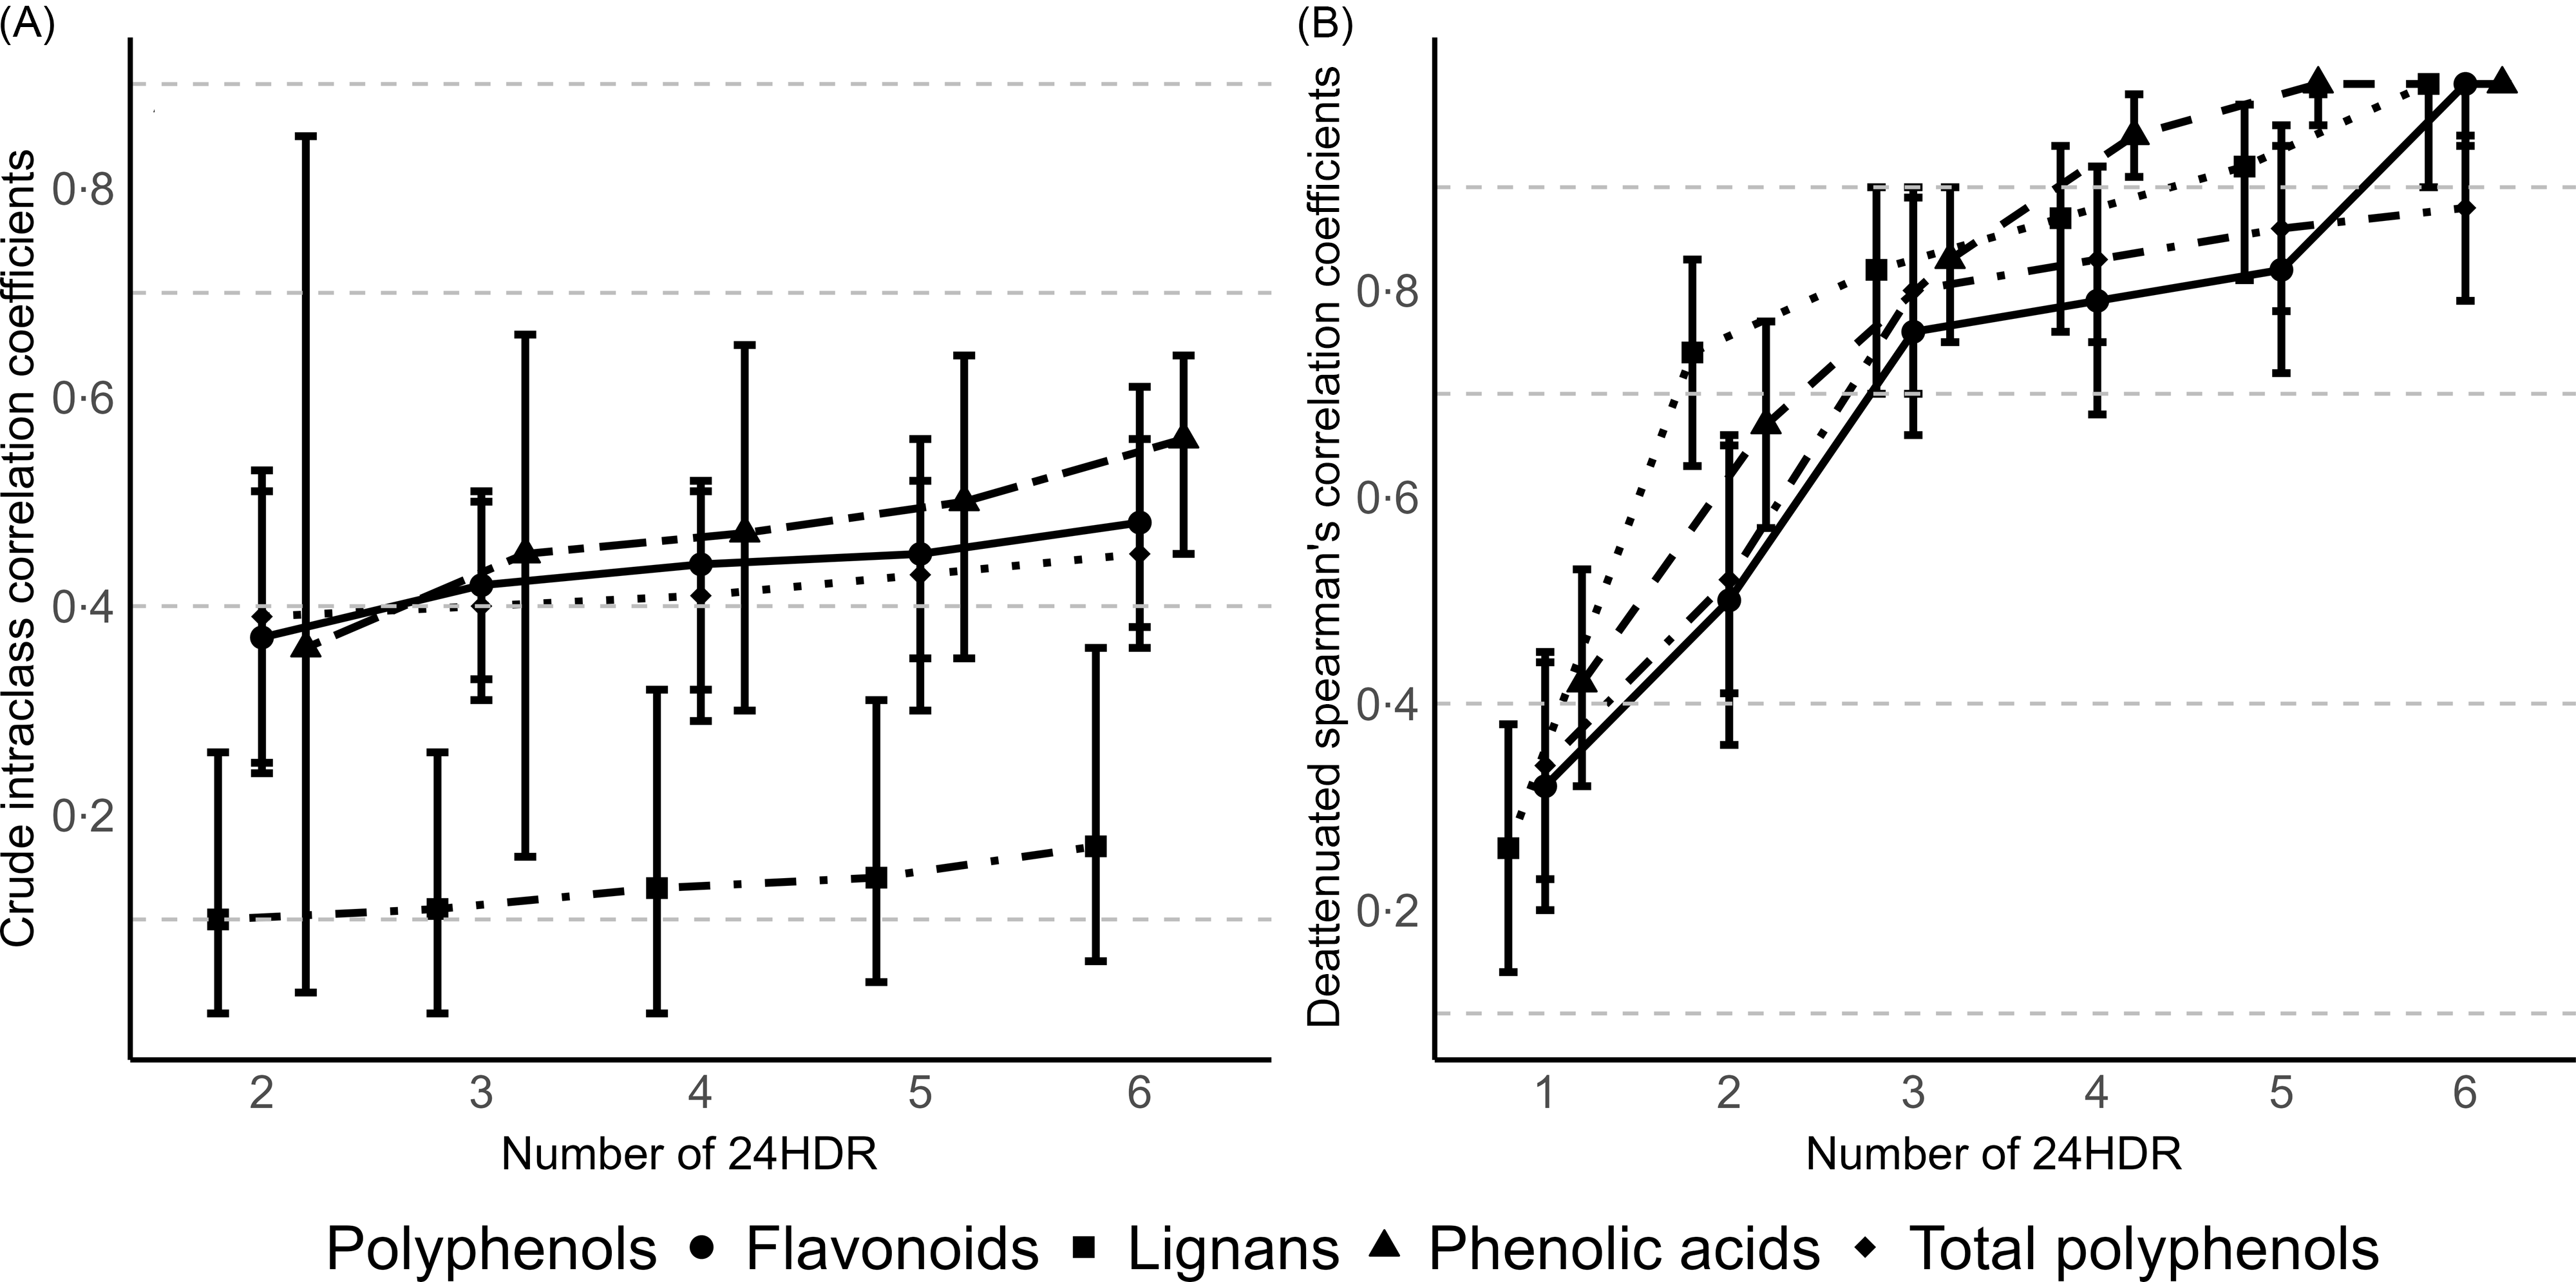
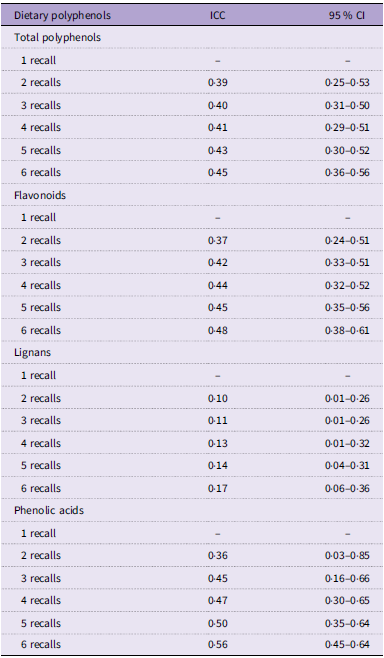
In the main analysis based on non-consecutive recalls, the reproducibility coefficients of these four polyphenol categories generally increased with the escalating number of 24HDR (Figure 1 and Table 2). Estimates based on two non-consecutive 24HDR showed weak reproducibility for all polyphenol categories (ICC: 0·10–0·39). With three recalls, reproducibility reached a moderate level for total polyphenols (ICC = 0·40; 95 % CI 0·31, 0·50), flavonoids (0·42; 0·33, 0·51) and phenolic acids (0·45; 0·16, 0·66) but remained weak for lignans (0·11; 0·01, 0·26). Extending the number of recalls to 4–6 d did not substantially improve reproducibility further (ICC range: 0·41–0·56 for total polyphenols, flavonoids and phenolic acids; 0·13–0·17 for lignans). To assess whether the results were sensitive to the specific recall-day combinations selected, we additionally calculated ICC using consecutive 2-d and 3-d 24HDR, which showed a generally similar pattern to those from the main analysis (Supplementary Table S3), suggesting that our main conclusions were not substantially influenced by the recall-day arrangement.
Reproducibility and validity of dietary polyphenol intake by number of 24-h dietary recalls (24HDR) in the Anhui Lifestyle Validation Study (ALVS, 2021–2022). (A) Reproducibility, expressed as intraclass correlation coefficients (ICC). (B) Validity, expressed as deattenuated Spearman’s correlation coefficients (r c ). Bootstrap means and 95 % CI are shown. The dashed lines indicate classification thresholds: weak (<0·40), moderate (0·40–0·69), strong (0·70–0·89) and very strong (≥0·90).

Bootstrap mean and 95 % CI of reproducibility coefficient (ICC) for dietary polyphenols and subclasses assessed by different numbers of non-consecutive 24-h dietary recalls (24HDR) in the ALVS (2021–2022) a

Table 2. Long description
A table comparing the reproducibility coefficients (ICC) for dietary polyphenols and their subclasses assessed by different numbers of non-consecutive 24-h dietary recalls. The table has 21 rows and 3 columns. The columns are labeled ‘Dietary polyphenols’, ‘ICC’, and ‘95 % CI’. The rows are grouped by polyphenol categories: Total polyphenols, Flavonoids, Lignans, and Phenolic acids. Each category lists ICC values for 1 to 6 recalls. For Total polyphenols, ICC values range from 0.39 to 0.45. For Flavonoids, ICC values range from 0.37 to 0.48. For Lignans, ICC values range from 0.10 to 0.17. For Phenolic acids, ICC values range from 0.36 to 0.56. The 95 % CI values vary accordingly for each recall count and polyphenol category.
ICC, intraclass correlation coefficient; ALVS, Anhui Lifestyle Validation Study.
a The reproducibility of total polyphenol, flavonoid, lignan and phenolic acid intake derived from 2, 3, 4, 5 and 6 non-consecutive 24HDR was assessed by ICC.
The relative validity of one to six non-consecutive 24-h dietary recalls
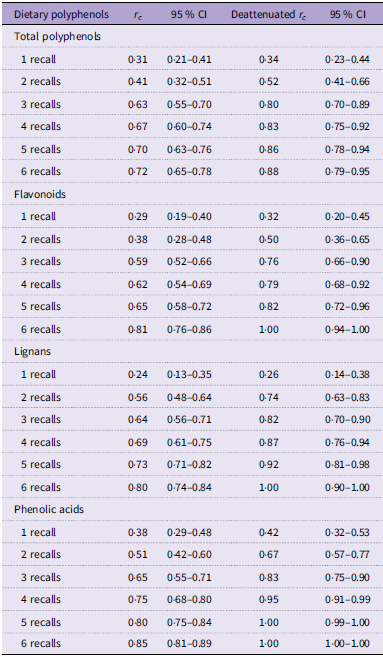
The relative validity coefficients of these four polyphenol categories increased with the number of 24HDRs (Figure 1 and Table 3). After deattenuating for random measurement errors, a single 24HDR showed weak to moderate relative validity (r c : 0·26–0·42). With two recalls, agreement improved to moderate or strong levels (r c : 0·50–0·74). Three or more recalls yielded high levels of relative validity coefficients (r c : 0·76–1·00).
Bootstrap mean and 95 % CI of validity coefficients (crude and deattenuated r c ) for dietary polyphenols and subclasses measured by different numbers of non-consecutive 24HDR in the ALVS (2021–2022) a

Table 3. Long description
A table comparing the validity coefficients for dietary polyphenols and subclasses measured by different numbers of non-consecutive 24-hour dietary recalls (24HDR) in the ALVS (2021-2022). The table has 5 rows and 8 columns. Column headers are: Dietary polyphenols, r_c, 95% CI, Deattenuated, r_c, 95% CI. Row labels include Total polyphenols, Flavonoids, Lignans, and Phenolic acids. Each row further breaks down into 1 recall, 2 recalls, 3 recalls, 4 recalls, 5 recalls, and 6 recalls. The table lists the mean and 95% confidence intervals (CI) for crude and deattenuated validity coefficients (r_c) for each category and number of recalls. Notable trends include increasing validity coefficients with the number of recalls and higher coefficients for deattenuated values compared to crude values.
24HDR, 24-h dietary recall; ALVS, Anhui Lifestyle Validation Study; r c , Spearman’s correlation coefficients.
a The validity was evaluated by comparing the estimates from the different number of 24HDR against those from the average of 4 quarterly 3 consecutive 24HDR (2 weekdays and 1 weekend day in each season) in 1-year using crude and deattenuated Spearman’s correlation coefficients. Validity coefficients and CI limits above 1 were set to 1.00.
Bland–Altman analysis indicated reasonable agreement between estimates from three 24HDR and the 12-d reference (Figure 2). Mean differences were small: 8·61 mg/d (95 % LOA: –235·62, 252·84) for total polyphenols, –5·39 mg/d (–151·89, 141·12) for flavonoids, 0·66 mg/d (–34·70, 36·03) for lignans and 3·23 mg/d (–101·74, 108·19) for phenolic acids. Most data points lay within the 95 % LOA and were distributed closely around the line of zero difference.
Bland–Altman plot illustrating the agreement between polyphenol intake estimates from three randomly selected non-consecutive 24-h dietary recalls (24HDR) and the reference method (mean of twelve recalls collected over 1 year) in the Anhui Lifestyle Validation Study (ALVS, 2021–2022). The solid line represents the mean difference, and the dashed lines indicate the 95 % limits of agreement (mean difference ± 1·96 sd). (A) Total polyphenols; (B) flavonoids; (C) lignans; (D) phenolic acids.

Sensitivity analyses using energy-adjusted polyphenol intakes yielded similar conclusions, with three recalls still demonstrating reasonable performance for total polyphenols, flavonoids and phenolic acids, although ICC were generally slightly lower than those from the unadjusted analyses (Supplementary Table S4).
The performance of three non-consecutive 24-h dietary recall by individual characteristics
Exploratory subgroup analyses indicated that the reproducibility of flavonoid intake estimated from three 24HDR was higher among older (≥45 years) and male participants, whereas that of phenolic acids was lower in these subgroups (Supplementary Table S5). Total polyphenol intake showed higher reproducibility in older individuals. All three polyphenol categories exhibited higher reproducibility in participants with BMI < 24 kg/m2, on weekdays and during spring/summer seasons, compared with their respective counterparts. In contrast, exploratory subgroup analyses for validity did not reveal consistent differences across subgroups (Supplementary Table S6).
Discussion
In this 1-year longitudinal validation study, we evaluated the reproducibility and validity of the dietary intake of total dietary polyphenols and key subclasses, including flavonoids, lignans and phenolic acids, derived from varying numbers of 24HDR. Our findings indicate that three non-consecutive 24HDR offer reasonable reproducibility and relative validity for assessing total polyphenol, flavonoid and phenolic acid intake, whereas lignan intake was poorly reproducible even with up to 6-d recalls. Increasing the number of recalls beyond 3 did not meaningfully improve reproducibility for most polyphenol categories.
To our knowledge, no prior study has specifically examined the reproducibility of 24HDR-based polyphenol assessments. Flavonoids are primarily obtained from fruits and vegetables(Reference Zheng, Zhang and Zeng43), while phenolic acids are largely derived from coffee and vegetables(Reference Kumar and Goel44). Previous studies have reported moderate reproducibility for fruit and vegetable intake (ICC range: 0·32–0·36) with three 24HDR(Reference St George, Van Horn and Lawman45) and high reproducibility for coffee intake with only 1–2 recall days (ICC > 0·85)(Reference Singh, Verest and Salathé46). Our results align with these observations, showing moderate reproducibility for flavonoids (ICC = 0·42) and phenolic acids (ICC = 0·45) using three 24HDRs. In contrast, lignans exhibited consistently low reproducibility across all recall numbers (ICC ≤ 0·17). This may be explained by their low habitual intake in our population (median = 9·41 mg/d), which amplifies the relative impact of day-to-day variation(Reference Bailey47). Furthermore, lignans are concentrated in a limited number of foods, such as flaxseeds, whole grains and certain vegetables, whose sporadic consumption may be underreported in short-term recalls, further increasing within-person variation(Reference Willett23). Thus, for lignan assessment, combining 24HDR with a brief FFQ targeting lignan-rich foods or with objective biomarkers may improve reliability.
The ICC for total polyphenols, flavonoids and phenolic acids using three 24HDR ranged from 0·40 to 0·45. According to relevant research(Reference Schober, Boer and Schwarte39), values in this range are considered to indicate moderate reliability. In nutritional epidemiology, this level is generally acceptable for ranking individuals by habitual intake – a common objective in cohort studies – but is insufficient for individual-level precision or clinical applications(Reference Willett23). Importantly, measurement error of this magnitude may attenuate observed diet–disease associations, underscoring the need for appropriate error-correction methods, such as regression calibration, in future diet–disease analyses(Reference Freedman, Schatzkin and Midthune48). It should be noted, however, that the CI for some ICC estimates were relatively wide, particularly for phenolic acids based on two recalls (95 % CI 0·03–0·85). This imprecision likely reflects the inherently higher day-to-day variability of phenolic acid intake in our population. In our study, the median intake of phenolic acids (approximately 55 mg/d) is lower than that of flavonoids (approximately 136 mg/d) and total polyphenols (approximately 204 mg/d). Unlike macronutrients, which tend to have more stable daily intakes, phenolic acids are derived from a wide variety of foods such as coffee, tea, vegetables and fruits, whose consumption frequency varies considerably across individuals, leading to greater within-person variability and consequently less stable reproducibility estimates. When sample correlations are low, imprecision in reliability estimates is to be expected(Reference Bailey47,Reference Giraudeau and Mary49) . Nevertheless, the overall pattern of increasing ICC with more recalls and narrowing CI suggests that the reliability estimates are interpretable at the group level.
Several studies have used the method of triads to examine the validity of polyphenol estimates from 24HDR or food records, generally reporting high validity coefficients (0·61–1·00)(Reference Burkholder-Cooley, Rajaram and Haddad14,Reference Hoge, Guillaume and Albert15) . Our validity estimates are consistent with these reports, although it should be noted that using the mean of twelve 24HDR as the reference may share methodological errors with the test method, potentially inflating validity coefficients. As expected, validity improved with increasing recall days, a pattern commonly observed in dietary validation research(Reference Peterson, Lee and Huybrechts24,Reference St George, Van Horn and Lawman45) . However, the magnitude of improvement varied across the number of recalls. The largest gains in both reproducibility and relative validity occurred when increasing from 2 to 3 recalls, whereas additional recalls beyond 3 provided only modest incremental improvements. For example, the ICC for total polyphenols increased from 0·39 with two recalls to 0·40 with three recalls but further increased to only 0·45 with six recalls; similarly, the deattenuated r c increased from 0·52 with two recalls to 0·80 with three recalls but reached only 0·88 with six recalls. A similar pattern was observed for flavonoids and phenolic acids. These diminishing returns suggest that three recalls represent a practical threshold beyond which the additional gain in measurement precision may not justify the added participant burden and logistical complexity. Nevertheless, excessively long recall protocols can reduce participant compliance and limit feasibility in large-scale studies(Reference Huang, Zhao and Fang22,Reference Willett23) . In epidemiological settings, poor measurement reproducibility and validity can attenuate true diet–disease associations(Reference Freedman, Schatzkin and Midthune48,Reference Gibson, Charrondiere and Bell50) . We found that three non-consecutive 24HDR achieve a reasonable balance between practicality and accuracy for most polyphenol subclasses.
The reproducibility of total polyphenols and flavonoids – which are consumed in larger quantities – was less influenced by participant characteristics or survey timing. In contrast, phenolic acid estimates were more variable across subgroups, showing lower reproducibility in older adults (≥45 years), possibly due to age-related memory decline affecting recall accuracy(Reference Quandt, Vitolins and Smith51). However, since an alternative method for assessing dietary intake was not utilised to verify recall accuracy, this lower reproducibility could also be explained by a higher day-to-day variability in the diet of older individuals(Reference Borrelli, Simonetti and Fidanza52). Women exhibited higher reproducibility for phenolic acids than men, which may reflect more consistent vegetable consumption patterns among females(Reference Dehghan, Akhtar-Danesh and Merchant53,Reference Küçük, Urak and Bilgic54) . Reproducibility was generally higher on weekdays and during spring/summer compared with weekends and autumn/winter, likely due to more structured eating patterns on weekdays and greater vegetable intake in warmer seasons(Reference Shahar, Yerushalmi and Lubin55,Reference Esposito, Sanmarchi and Marini56) . Weekend diets tend to be more irregular, often featuring delayed meals, skipped eating occasions and higher intake of energy-dense foods(Reference Say, Nordin and Ng57,Reference Dashti, Scheer and Saxena58) , which may reduce the stability of polyphenol intake. However, these subgroup findings should be interpreted with caution, as the analyses were exploratory and involved multiple comparisons without adjustment for multiplicity. Confirmation in independent studies is warranted before drawing firm conclusions.
A key strength of this study is the use of 12 recall days as the reference method, which accounts for both weekday–weekend and seasonal variation. Furthermore, we evaluated multiple polyphenol subclasses, including the rarely studied lignans and phenolic acids. However, our study also has limitations. First, the generalisability of our findings may be limited both externally and internally. Participants were recruited from central-eastern China, which may limit applicability to populations with different dietary patterns, and a substantial proportion (39 %) were excluded due to incomplete 24HDR data. Compared with those included, excluded participants were more likely to be male, younger and of lower socio-economic status, suggesting that non-completion was associated with certain demographic factors. However, the observed relationships between recall days and measurement performance are unlikely to be materially affected by this selection bias.
Second, because the test estimates and the reference mean were derived from the same 24HDR data, they shared overlapping observations and thus correlated measurement errors. Consequently, a positive correlation between the random errors of the test and reference methods will overestimate validity coefficients for both(59). Accordingly, our reported deattenuated validity coefficients should be interpreted as optimistic upper-bound estimates rather than true criterion validity. Ideally, future validation studies should employ non-self-report reference standards, such as dietary biomarkers or AI-enhanced image-based dietary assessment methods, whose measurement errors are more likely to be independent of those in self-reported instruments. Third, our recommendation of three recalls is to some extent arbitrary, as it was not derived from formal statistical comparison of all possible recall-day combinations, and the optimal number may vary across populations.
In conclusion, three non-consecutive 24HDR show acceptable reproducibility and relative validity for assessing habitual intake of total polyphenols, flavonoids and phenolic acids. However, for lignans, whose low intake and sporadic consumption patterns in our population may reflect dietary characteristics rather than a methodological limitation of the 24HDR approach, additional assessment tools may be needed. Future validation studies in diverse populations are warranted to confirm or refine our findings, ideally incorporating more independent reference standards such as dietary biomarkers or AI-enhanced image-based dietary assessment methods.
Data availability statement
Data described in the manuscript, code book and analytic code will be made available upon request pending application.
Supplementary material
To view supplementary material for this article, please visit https://doi.org/10.1017/S0007114526108174
Acknowledgements
The authors would like to thank the participants and staff of the Anhui Lifestyle Validation Study for their valuable contributions.
Author contributions
Guobing Sun: Conceptualisation-Equal, Data curation-Lead, Formal analysis-Lead, Funding acquisition-Equal, Investigation-Lead, Validation-Equal, Visualisation-Lead, Writing – original draft-Lead; Meiling Li: Investigation-Equal, Validation-Equal, Visualisation-Equal; Jiawei Zhang: Investigation-Equal, Project administration-Equal, Supervision-Equal; Junyi Zhang: Funding acquisition-Equal, Investigation-Equal, Supervision-Equal; Hongjuan Cao: Investigation-Equal; Young Lyu: Investigation-Equal; Xinghao Ma: Investigation-Equal; Yu Han: Investigation-Equal; Xinsheng Qin: Investigation-Equal; Zhuang Zhang: Conceptualisation-Equal, Funding acquisition-Equal, Methodology-Equal, Writing – original draft-Supporting; Wanshui Yang: Conceptualisation-Lead, Funding acquisition-Lead, Resources-Lead, Supervision-Lead, Writing – original draft-Equal, Writing – review and editing-Lead.
Financial support
This work was supported by the National Key Research and Development Program of China (grant number 2023YFA1800800), the National Natural Science Foundation of China (grant number 82373673), Major Projects in Natural Science of Higher Education Institutions in Anhui Province (grant number 2024AH040104), the Nutrition Science Foundation of Chinese Nutrition Society (grant number CNS-NCL2025–98) and Postgraduate Innovation Research and Practice Program of Anhui Medical University (grant numbers YJS20240007, YJS20240057). The funders had no role in design and conduct of the study; collection, management, analysis and interpretation of the data; and preparation, review or approval of the manuscript.
Competing interests
The authors declare that they have no conflicts of interest.