While the clinical hallmark of Alzheimer’s disease (AD) is a deficit in episodic memory related to pathology in mesial temporal lobe structures (e.g., hippocampus, entorhinal cortex; Hyman et al., Reference Hyman, Van Hoesen, Damasio and Barnes1984), impaired semantic memory with resulting word-finding difficulty is also evident early in the disease (Barbeau et al., Reference Barbeau, Didic, Joubert, Guedj, Koric, Felician, Ranjeva, Cozzone and Ceccaldi2012). Patients with AD often report word-finding difficulty for names of people, places, and objects, and are impaired on formal tests of confrontation picture naming. Studies using the Boston Naming Test (BNT; Kaplan et al., Reference Kaplan, Goodglass and Weintraub1983), for example, have shown impaired picture naming in patients with AD dementia (Williams et al., Reference Williams, Mack and Henderson1989) or Mild Cognitive Impairment (MCI), a condition that is often a prodromal stage of AD (Willers et al., Reference Willers, Feldman and Allegri2008; but see Balthazar et al., Reference Balthazar, Martinelli, Cendes and Damasceno2007). Research findings generally suggest that the picture-naming deficit in AD and MCI results from semantic network degradation that causes difficulty accessing knowledge of concepts (Garrard et al., Reference Garrard, Lambon Ralph, Patterson, Pratt and Hodges2005; Hodges et al., 1991, Reference Hodges, Salmon and Butters1992; Huff et al., Reference Huff, Corkin and Growdon1986; Lukatela et al., Reference Lukatela, Malloy, Jenkins and Cohen1998; Mulatti et al., Reference Mulatti, Calia, De Caro and Della Sala2014). However, decline in attention, working memory, lexical retrieval, or the ability to ignore interference from a previous response may also contribute (Balota & Duchek, Reference Balota and Duchek1991; Rogers et al., Reference Rogers, Ivanoiu, Patterson and Hodges2006).
Findings regarding the impact of normal aging on naming ability are mixed—some studies suggest that naming remains relatively stable throughout the lifespan (Hashimoto et al., Reference Hashimoto, Johnson and Peterson2016; LaBargeet al., Reference LaBarge, Edwards and Knesevich1986) while others show a decline in naming performance with aging (Au et al., Reference Au, Joung, Nicholas, Obler, Kass and Albert1995; Ivnik et al., Reference Ivnik, Malec, Smith, Tangalos and Petersen1995; Mitrushina & Satz, Reference Mitrushina and Satz1995; Van Gorp et al., Reference Van Gorp, Satz, Kiersch and Henry1986). Studies that show a decline have attributed it to an age-related decrease in efficiency of lexical access (e.g., Barresi et al., Reference Barresi, Nicholas, Tabor Connor, Obler and Albert2000; Burke & Shafto, Reference Burke and Shafto2004; Kavé et al., Reference Kavé, Knafo and Gilboa2010) or phonological processing (Rizio et al., Reference Rizio, Moyer and Diaz2017). A meta-analysis that included eleven published studies of picture naming supported this possibility, concluding that there is an age-related decline in lexical retrieval that begins after age 70 (Feyereisen, Reference Feyereisen1997; see also MacKay et al., Reference Mackay, Connor, Albert and Obler2002; Zec et al., Reference Zec, Markwell, Burkett and Larsen2005 for similar findings). A second meta-analysis, in contrast, determined that no strong conclusions could be drawn regarding age-related decline in naming ability or lexical retrieval due to methodological limitations of most of the studies such as small sample sizes and differences in age ranges, tasks, study designs, and statistical analyses (Goulet et al., Reference Goulet, Ska and Kahn1994; for a review of these issues see Connor et al., Reference Connor, Spiro, Obler and Albert2004).
The dysnomia that often characterizes early AD makes picture naming an integral component of neuropsychological assessment of aging, MCI, and AD dementia. Many picture naming tasks are designed with an ascending difficulty of items. This design enhances the efficiency of test administration, but makes it inappropriate to use a direct translation into a language different from the one in which the test was developed since the features that determine item difficulty, such as familiarity, frequency of use, and the meaning of items and their names, differ across languages and cultures. To broaden the ability to detect naming ability across various languages, the Multilingual Naming Test (MINT; Gollan et al., Reference Gollan, Weissberger, Runnqvist, Montoya and Cera2012) was developed for use in a number of languages (e.g., English, Spanish, Mandarin, Hebrew) with roughly equivalent overall difficulty of items across languages. Several studies have validated the MINT as a bilingual proficiency measure (i.e., by testing with the MINT in both languages) in cognitively normal Chinese–English children (Sheng et al., Reference Sheng, Lu and Gollan2014), young adult Spanish–English and Chinese–English bilinguals (Gollan et al., Reference Gollan, Weissberger, Runnqvist, Montoya and Cera2012; Tomoschuk et al., Reference Tomoschuk, Ferreira and Gollan2018) and older Spanish–English bilinguals (Gollan et al., Reference Gollan, Weissberger, Runnqvist, Montoya and Cera2012). Clinical validation of the MINT was carried out in one study which showed that an abbreviated (32-item) version of the MINT, which mainly includes only the more difficult items from the full version, detected mild dysnomia in English monolingual patients with MCI or mild-to-moderate AD dementia, and provided evidence that the loss was semantic in nature (Ivanova et al., Reference Ivanova, Salmon and Gollan2013). This same study also found that the MINT detected naming impairments in Spanish–English bilinguals with AD, but only when they were tested in their dominant language.
The abbreviated (32-item) MINT recently replaced the short (30-item) version of the BNT in the National Alzheimer’s Disease Coordinating Centers’ (NACC) Uniform Data Set (UDS) neuropsychological test battery. A cross-walk study that included both measures showed that the MINT and BNT were highly correlated (r = 0.76; Monsell et al., Reference Monsell, Dodge, Zhou, Bu, Besser, Mock, Hawes, Kukull and Weintraub2016). Preliminary normative data for the MINT have been recently published for the UDS (v.3) (Weintraub et al., Reference Weintraub, Besser, Dodge, Teylan, Ferris, Goldstein, Giordani, Kramer, Loewenstein, Marson, Mungas, Salmon, Welsh-Bohmer, Zhou, Shirk, Atri, Kukull, Phelps and Morris2018 see https://www.alz.washington.edu/WEB/npsych_means.html), but the ability of the MINT to capture impairments in language abilities across the various stages of cognitive impairment associated with AD has not been determined. In addition, it has not been determined if the MINT, like the BNT and other naming tests (Ashaie & Obler, Reference Ashaie and Obler2014; Welch et al., Reference Welch, Doineau, Johnson and King1996; but see Connor et al., Reference Connor, Spiro, Obler and Albert2004), is subject to an age-by-education interaction effect in which naming scores decrease the most in the oldest-old with the lowest level of education. Thus, the goals of the present study were to (1) examine group differences on the MINT across increasing levels of cognitive impairment in a large sample of patients with MCI or dementia presumably due to AD, and cognitively healthy controls (>5,000 participants) and (2) assess the effects of sex, age, race, and education on MINT scores in normal aging, MCI, and AD dementia.
Methods
Participants and Inclusion/Exclusion Criteria
Participants were tested on the MINT during their approximately annual UDS evaluation as part of their participation in longitudinal studies of AD at one of approximately 29 NIA-funded Alzheimer’s Disease Centers (ADCs) across the United States. Our analyses included data from March 2015 through May 2017 and included only the first administration of version 3 of the UDS.
The sample was restricted to individuals clinically diagnosed as cognitively normal or with MCI or dementia due to AD based upon diagnostic research criteria (Albert et al., Reference Albert, DeKosky, Dickson, Dubois, Feldman, Fox, Gamst, Holtzman, Jagust, Petersen, Snyder, Carrillo, Thies and Phelps2011; McKhann et al., Reference McKhann, Knopman, Chertkow, Hyman, Jack, Kawas, Klunk, Koroshetz, Manly, Mayeux, Mohs, Morris, Rossor, Scheltens, Carrillo, Thies, Weintraub and Phelps2011). Within each of the three clinically diagnosed groups, dementia severity was further stratified using the Clinical Dementia Rating (CDR), a semi-structured clinical interview to rate cognitive and functional performance (Morris, Reference Morris1993). Participants with AD dementia were grouped into CDR scores of 0.5 (very mild), 1 (mild), or 2 (moderate). Participants with a CDR score of 3 were excluded due to insufficient sample size. Cognitively normal participants with CDR scores of >0 were excluded. MCI participants had CDR scores of either 0 (n = 51) or 0.5 (n = 801). Because the clinician’s diagnosis and the CDR rating were conducted independently at some sites, CDR scores of 0.5 occurred in both the MCI and AD groups.
We included participants with concomitant medical or psychiatric conditions if those conditions were not primary or contributing causes of the observed cognitive impairment, with the exception that a few conditions judged to be contributing only were allowed (depression, anxiety, systemic illness, and current medications). Participants with current alcohol abuse were excluded. Only primary English speakers and participants with complete data for all variables of interest (i.e., age, sex, education, and MINT score) were included. When a participant’s education level was listed as greater than 20 years, it was re-coded as a maximum of 20. Only participants age 50 and older were included in the analyses to better match age distributions across groups.
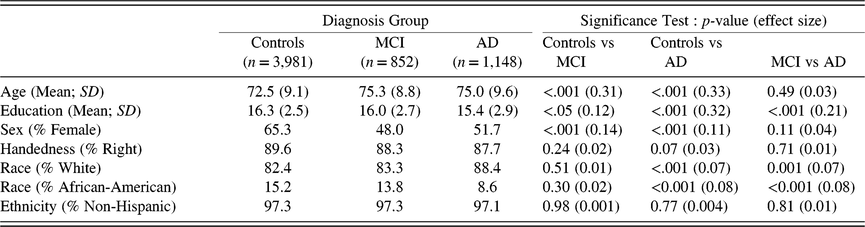
Table 1 shows the demographic characteristics and significance tests with corresponding effect sizes of the final groups used in the analyses. Controls had significantly higher education than both MCI and AD, and MCI had significantly higher education than AD. Controls were significantly younger than both MCI and AD; however, MCI and AD did not differ on age. Chi-square tests showed that controls had a higher percentage of female participants than the MCI and AD groups, and controls had a slightly lower percent of White participants than the AD group; notably the effect sizes of these differences were small (Cramer’s V ≤ 0.14). Most of the participants in the overall sample were White (84%), and there were 14% African-American or Black, 1% Asian, and 1% Other Race, which reflects the overall distribution within the national ADCs. Informed consent was obtained at the individual ADCs, as approved by individual Institutional Review Boards (IRBs), and sharing of de-identified UDS data was approved by the University of Washington’s IRB (the site of the NACC data repository).
Demographic characteristics of participants and associated p-values and effect sizes*

* p-values and Cohen’s d effect sizes correspond to t-tests for age and education; p-values and Cramer’s V effect sizes correspond to Pearson’s Chi-square tests for categorical variables (sex, handedness, race, and ethnicity)
Dependent Variable—MINT Scores
The abbreviated MINT consists of 32 black-and-white line drawings of objects that are presented one at a time to be named beginning with relatively easier items and ending with relatively more difficult to name items. If an individual encounters difficulty identifying an object, a semantic or phonemic cue is provided. The number of spontaneous correct responses and correct responses following a semantic cue are summed to give a total score. Thus, the abbreviated MINT total scores range from 0 to 32 and these were used as the primary outcome measure.
Statistical Methods
Correlation and simultaneous multiple regression analyses (with model comparisons) were carried out to assess the relationship between diagnostic group, age, education, sex, and race in an additional analysis, on MINT total score. Inclusion of variables in the current models was based on previous research showing that naming tests are often affected by age and education, as well as the interaction between them. Sex was examined as a main effect given a previous finding of a sex effect on the MINT (Weintraub et al., Reference Weintraub, Besser, Dodge, Teylan, Ferris, Goldstein, Giordani, Kramer, Loewenstein, Marson, Mungas, Salmon, Welsh-Bohmer, Zhou, Shirk, Atri, Kukull, Phelps and Morris2018). Race effects were also considered given previous research showing that disparities in quality of education and early life experiences can adversely impact cognitive test performance of older African-Americans (Manly et al., Reference Manly, Byrd, Touradji and Stern2004; Manly et al., Reference Manly, Jacobs, Touradji, Small and Stern2002; Sisco et al., Reference Sisco, Gross, Shih, Sachs, Glymour, Bangen, Benitez, Skinner, Schneider and Manly2015; Welsh et al., Reference Welsh, Fillenbaum, Wilkinson, Heyman, Mohs, Stern, Harrell, Edland and Beekly1995). Age and education level were modeled as continuous predictors. Sex (female, male), race (White, African-American), and diagnostic group (normal cognition, MCI, AD with CDR 0.5, AD with CDR 1, AD with CDR 2) were dummy-coded and modeled as categorical predictors (nominal or ordinal, respectively). Before computing interaction terms, age and education were centered to avoid multicollinearity. Age was modeled as a quadratic term for the cognitively normal group because a polynomial curve provided a better model fit, whereas education was modeled as a linear term because a polynomial term did not significantly improve model fit. Participants were stratified into four age (<65, 65–75, 76–85, 86+) and three education (≤12, 13–15, 16+) groups for the purposes of conducting t-tests comparing age- and education-matched groups and providing tables with means, standard deviations, and cut-off scores corresponding to percentiles.
To identify the potential diagnostic utility of the MINT, the area under the curve (AUC), sensitivity, specificity, and ideal hypothetical cut-off MINT scores for predicting group membership were calculated separately for cognitively normal versus MCI and cognitively normal versus AD using Receiver Operating Characteristic (ROC) curve analyses. The AUC measure provides an overall indication of the diagnostic accuracy; a minimum value of >0.75 was considered clinically significant (Fan et al., Reference Fan, Upadhye and Worster2006). Sensitivity (i.e., the true positive rate or hit) and specificity (i.e., the true negative rate or correct rejection) were calculated and sensitivity was plotted as a function of specificity. Thus, the ROC curves illustrate diagnostic accuracy for all possible cut-off scores (from which an optimal cut-off can then be determined).
All data were analyzed using SPSS, version 24 (IBM; Chicago, IL) and R (version 3.3.3; R Core Team, 2016) was used for graphs and robust regressions. The statistical results from parametric tests (i.e., regression, t-tests) need to be interpreted with caution because the MINT scores and the standardized residuals were not normally distributed, and there were unequal variances between groups. Given the very large sample sizes, however, violations of the normality assumption may not noticeably impact results, and transformations may actually bias estimates (Schmidt & Finan, Reference Schmidt and Finan2018). Therefore, we chose to present non-transformed data, and used non-parametric tests such as Mann–Whitney U tests and robust regressions, whenever applicable (see below).
Results
Regression Analyses
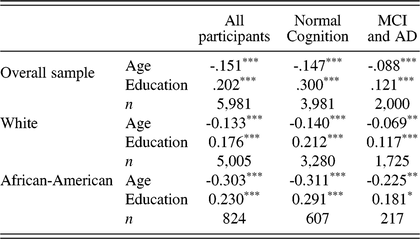
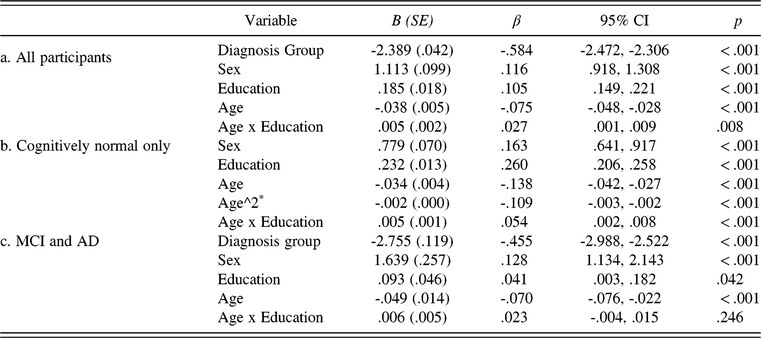
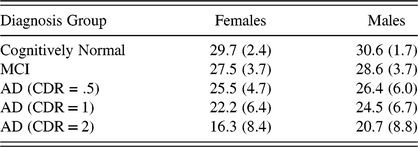
Correlations between age and education and total MINT score, shown for the overall sample and separately for Whites and African-Americans, the two most-represented groups in our overall sample, are presented in Table 2 and results of the regression analyses are summarized in Table 3. When all participants were included, multiple regression analyses showed significant associations between naming ability and diagnostic group, sex, education, and age (all ps <.001; Table 3a). This full model accounted for 39% of the variance in MINT scores (F1 (5, 5,975) = 760.0; MSE = 13.5; p < .001). MINT scores decreased as dementia severity and age increased, and increased as education level increased, and were higher for males than females. The main effect of sex can be visualized in Table 4. The main effects of age and education were qualified by a significant interaction between them, such that the association between naming ability and age depended on participants’ education level (p = .008). When this analysis was carried out within the cognitively normal group only, the same patterns of results were obtained (see Table 3b). When the analysis was carried out within only the MCI and AD groups, there were significant associations between MINT score and diagnostic group, sex, age, and education, but the interaction between age and education did not reach significance (p = .25; see Table 3c). Given the small effect size and to overcome the limitations of parametric tests, we tested the robustness of the age-by-education interaction in the cognitively normal group with a linear regression method using MM-estimation (‘robustbase’ package in R) as well as with a Weighted Least Squares (WLS) regression, which is more equipped for heteroscedasticity. Both analyses showed that the age-by-education interaction was indeed robust and persistent (β = 0.05; p< 0.001; and β = 0.04; p = 0.01, for robust and WLS regression, respectively), and all other main effects remained significant. Finally, the analyses reported in Table 3 were repeated using a 4 standard deviation trim of MINT and Montreal Cognitive Assessment (MOCA) scores within age, education, and race groups (given significantly different education levels among Whites and African-Americans)—all main effects and interactions remained the same.
Pearson bivariate correlations between MINT total score and age and education, separately by diagnosis group and race

*p < 0.05; **p < 0.01; ***p < 0.001
Multiple regression results showing the association between MINT scores and diagnostic group, sex, education, and age shown as three separate models for (a) all participants, (b) cognitively normal only, and (c) MCI and AD groups

Sex: 0 = female; 1 = male
Diagnosis group: 0 = normal cognition; 1 = MCI; 2 = AD (CDR = 0.5); 3 = AD (CDR = 1); 4 = AD (CDR = 2)
*A quadratic term for age produced a better model fit.
Means (and standard deviations) of MINT scores for females and males by diagnosis group

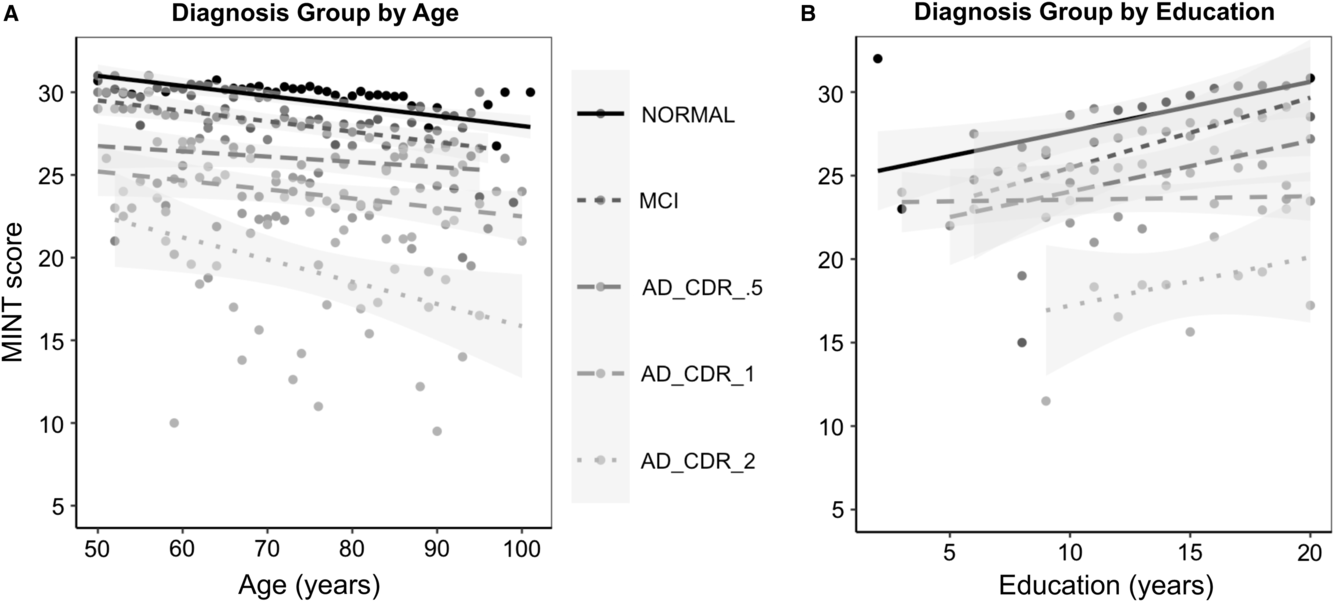
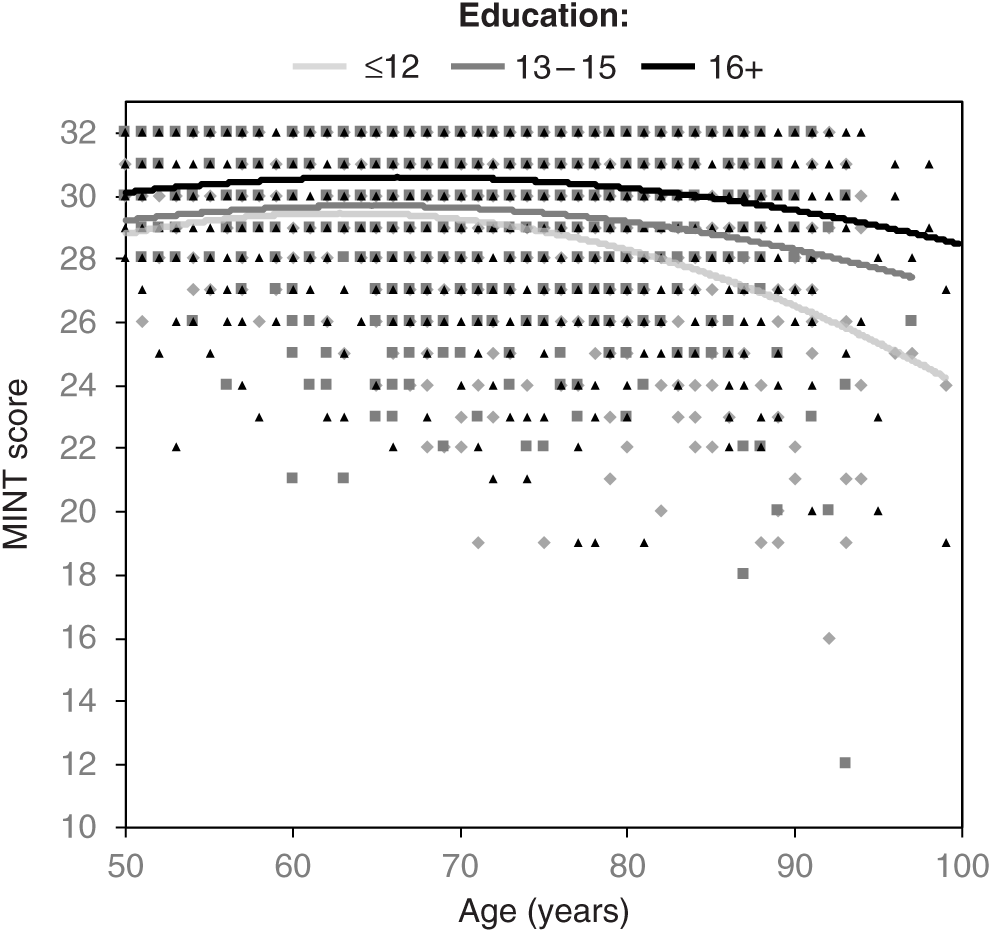
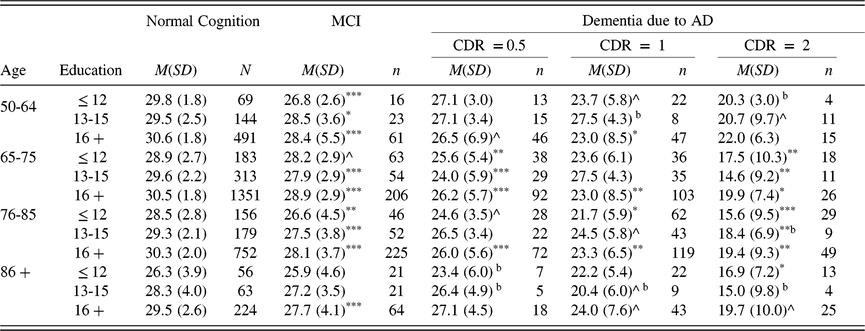
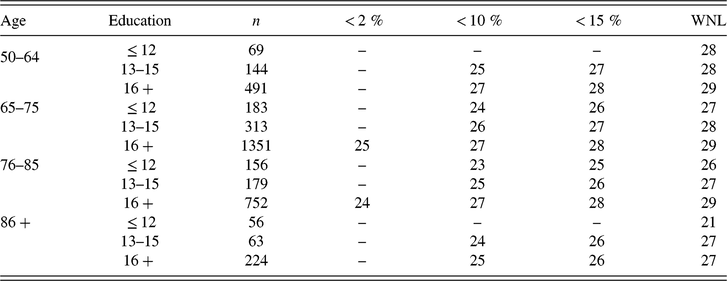
Planned comparisons collapsing across age and education using Mann–Whitney U tests (which do not assume a normal distribution or homogeneity of variances between groups) revealed that MINT scores were significantly different for cognitively normal versus MCI (U = 1,079,054; p < .001; r = .24), MCI versus AD with CDR 0.5 (U = 120, 490; p < .001; r = .21), AD with CDR 0.5 versus AD with CDR 1 (U = 79, 209; p < .001; r = .21), and AD with CDR 1 versus AD with CDR 2 (U = 39, 912; p < .001; r = .25). Figure 1 illustrates the main effects of diagnostic group plotted separately for age (1A) and education (1B), showing that the MINT was associated with impairments in naming across dementia severity regardless of age or education. Figure 2 illustrates the age-by-education interaction in cognitively healthy participants, showing that MINT scores were lowest in the oldest-old with the lowest education level. Table 5 presents means and standard deviations, when stratified by age, education, and dementia severity groups. Independent sample t-tests were carried out to compare the mean naming scores between adjacent diagnostic groups matched by age and education (e.g., MCI vs. normal cognition, AD with CDR 0.5 vs. MCI, etc). In general, the more severely impaired diagnostic group performed worse on the MINT than the next least impaired group, except in the youngest and oldest dementia groups. MINT scores of cognitively normal participants showed a near-ceiling effect (see Tables 5 and 6; Figures 1 and 2) that was particularly evident in individuals with higher education (i.e., 13 years and more). Collapsing across age and education, 32% of the cognitively normal sample obtained a perfect score of 32 points and 81% of the sample scored 29 or above. Table 6 presents cut scores on the MINT for the bottom 2%, 10%, and 15% of individuals in the cognitively normal group, stratified by age and education. In light of the observed ceiling effects, these values can be used to supplement the normative data provided by Weintraub et al. (Reference Weintraub, Besser, Dodge, Teylan, Ferris, Goldstein, Giordani, Kramer, Loewenstein, Marson, Mungas, Salmon, Welsh-Bohmer, Zhou, Shirk, Atri, Kukull, Phelps and Morris2018) to aid clinical interpretation of MINT scores.
Graphs depicting the MINT’s ability to detect differences in picture naming ability across level of cognitive impairment plotted separately for (A) age and (B) education. The black line represents the cognitively normal group, with increasing levels of cognitive impairment represented by lighter shading.

Scatterplots showing that MINT naming scores were lowest in individuals who are oldest and with the lowest level of education in the cognitively normal elderly. Education level was modeled as a continuous predictor for regression analyses but for visualization purposes was stratified into three levels. Scatter points for 16+ years of education are depicted in black triangles, 13–15 in dark gray squares, and ≤12 years in light gray diamonds.

Mean MINT score and (standard deviationa), and accompanying n, grouped by age, education, diagnosis, and CDR scoreb

a The standard deviations in this table should be interpreted with caution given ceiling effects on MINT scores (for review of these issues see Uttl, 2005).
b These cells have < 10 participants contributing to the mean
Asterisks denote a significant difference in scores between two adjacent diagnostic groups (i.e,. comparison with the group to the left). * = p < 05; ** = p < .01; *** = p < .001; ^ = marginal significance.
MINT cut-off scores associated with number of cognitively normal participants (n = 3,981) falling below < 2%, < 10%, < 15% of the sample, and within normal limits (WNL) grouped by age and education*. A “–" is placed wherever less than 10 participants contributed to a cell.

*For example, fewer than 10% of cognitively normal participants who were between 50 and 64 years old, and with 13-15 years of education had a MINT score of 25 or lower.
Race Effects
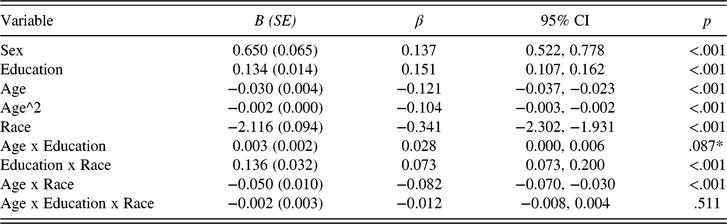
To consider if the observed age-by-education interaction differed by race (White, African-American), and whether the MINT may require separate norms for African-Americans, race was added as an additional factor to the regression within the cognitively normal group (given a sufficient sample size of African-American cognitively healthy participants; n = 607). Individuals in other race categories were excluded: that is Asian: n = 53; Native-Hawaiian/Pacific Islander: n = 3; American Indian/Alaska Native: n = 22; Other: n = 10; Unknown: n = 6. We tested a three-way interaction between age, education, and race (and included all lower order two-way interactions). Table 7 shows the results of this regression. Similar to the previous analysis, there were main effects of age, sex, and education. The previously robust interaction between age and education (see Table 3) became marginally significant in this more complex model. African-American cognitively normal elders on average had lower MINT scores than cognitively normal Whites (M = 27.8 vs 30.4). Further, education effects were significantly stronger in the African-American than in the White group, an education-by-race interaction, and race differences on the MINT were larger in the oldest participants, an age-by-race interaction (see Table 7). The three-way interaction between age, education, and race was not significant (p = 0.51).
Multiple regression results showing the association between MINT scores and sex, education, age, and race in cognitively normal elders (n = 3,887)

Sex: 0 = female; 1 = male.
Race: 0 = White; 1 = African-American.
* Note this interaction was significant in a model without the three-way interaction when including all participants; see Table 3b.
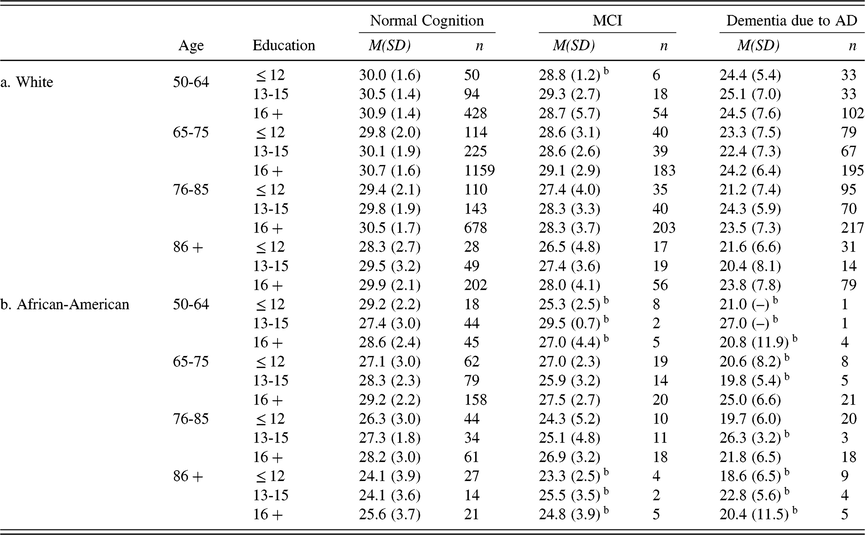
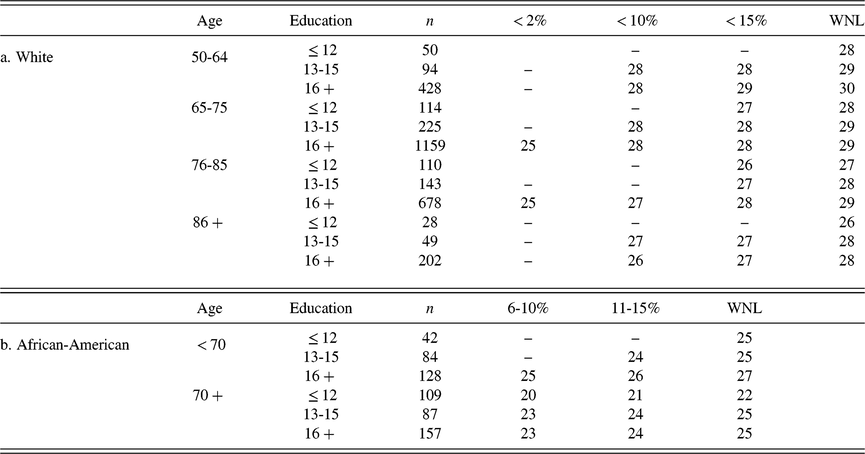
When the same analysis was restricted to patients only (MCI and AD), there was a main effect of race such that African-American patients on average had lower MINT scores than Whites (M = 24.1 vs 25.5; B = −1.484; SE = 0.419; β = −0.073; p < 0.001; 95% CI = −2.306, −0.662). Higher order interactions were not significant (ps ≥ 0.12). Given the observed main effect of race and significant two-way interactions in cognitively normal participants, Table 8 shows means and standard deviations separately for Whites (Table 8a) and African-Americans (Table 8b). Table 9 shows percentile cut-offs separately for Whites (9a) and African-Americans (9b). Table 9b is stratified by two (instead of four) age groups because of insufficient data in some cells for African-Americans.
Mean MINT score and (standard deviationa), and accompanying n, grouped by age, education and diagnosis and shown separately for Whites (n = 5,005) and African-Americans (n = 824)b

a The standard deviations in these tables should be interpreted with caution given ceiling effects on MINT scores (for review of these issues see Uttl, 2005)
b These cells have < 10 participants contributing to the mean
MINT cut-off scores associated with number of cognitively normal participants falling below or within a given percentile range or within normal limits (WNL), grouped by age and education* and presented separately for (a) Whites (n = 3,280) and (b) African-Americans (n = 607). A “-" is placed wherever less than 10 participants contributed to a cell.

*For example, fewer than 10% of cognitively normal Whites who were between 50 and 64 years old, and with 13-15 years of education had a MINT score of 28 or lower. 6-10% of cognitively normal African-Americans who were less than 70 years old, and with 16 + years of education had a MINT score of 25 or lower.
Receiver Operating Characteristic (ROC) curves
Figure 3 depicts ROC curves for classifying participants based on MINT scores. MINT performance provided good diagnostic accuracy for classifying probable AD versus cognitively normal participants (AUC = 0.85; SE = 0.01; p < 0.001; 95% CI = 0.84, 0.87). A cut-off MINT score of less than or equal to 28.5 produced a sensitivity and specificity of 75% and 81%, respectively, while a cut-off score of less than or equal to 29.5 produced sensitivity and specificity of 83% and 70%, respectively. In contrast, MINT performance did not provide acceptable diagnostic accuracy for classifying MCI versus cognitively normal participants (AUC = 0.68; SE = 0.01; p < 0.001; 95% CI = 0.66, 0.70).
Receiver Operating Characteristic (ROC) curves comparing sensitivity and specificity of MINT scores in discriminating between cognitively normal participants from those with AD (in black) and those with MCI (in dark gray).

Discussion
Results of this study demonstrate that the MINT can detect group differences in naming ability at different stages of cognitive impairment associated with AD regardless of age and education level. Within age- and education-matched subgroups, participants with MCI generally scored significantly worse than healthy controls, participants with mild dementia scored worse than those with MCI, and participants with moderate dementia scored worse than those with mild dementia. Of clinical relevance, MINT scores (collapsed across age and education levels) provided good diagnostic accuracy for distinguishing AD from cognitively normal participants, but not for distinguishing MCI from cognitively normal participants. Finally, we found robust associations between MINT scores and sex and race, as well as an interaction between age and education in cognitively healthy adults, such that MINT scores were lowest in the oldest and least-educated adults. Although the effect size of this interaction was statistically small, the finding was robust and clinically meaningful (e.g., in Table 6 there was a 6-point difference on the MINT between the least and most educated in the oldest-old group; while there was only a 1-point difference between the least and most educated in the youngest group using the ‘within normal limits’ cut-off). However, additional studies are needed to assess this age-by-education interaction with a more sensitive picture naming test. MINT scores were near ceiling levels for most cognitively normal participants in our sample (i.e., 81% of participants had a MINT score of 29 and above), particularly in White adults with 13 or more years of education, so it could have underestimated their naming difficulties. Overall, the MINT has the potential to detect deficits in naming ability in those with MCI or mild AD dementia and to track word-finding difficulty throughout the course of AD, but demographic characteristics and ceiling effects need to be considered.
Lower education was associated with poorer performance on the MINT—those with the lowest level of education (high school or less) had the lowest naming scores, followed by those with some college, and then those with 16 or more years of education. Notably, education effects were stronger in the African-American group, likely reflecting discordance between years of education and quality of education in ethnic minorities and immigrants. Older age was also associated with poorer naming ability—those in the oldest-old group (86+) had the lowest MINT scores, followed by those in the next oldest groups (76–85 and 65–75), and then those in the youngest group (<65). Similar age and education effects have been reported for the BNT (Albert et al., Reference Albert, Heller and Milberg1988; Fastenau et al., Reference Fastenau, Denburg and Mauer1998; LaBarge et al., Reference LaBarge, Edwards and Knesevich1986; Nicholas et al., Reference Nicholas, Obler, Albert and Goodglass1985).
In follow-up analyses including only the White and African-American groups (the next largest race represented in the sample with n = 217 and n = 607 in the patient and control groups, respectively)—and controlling for age, education, and sex—there was a robust main effect of race such that on average African-Americans named fewer pictures than Whites, consistent with some previous studies (Roberts & Hamsher, Reference Roberts and Hamsher1984; Welsh et al., Reference Welsh, Fillenbaum, Wilkinson, Heyman, Mohs, Stern, Harrell, Edland and Beekly1995; but see Manly et al., Reference Manly, Miller, Heaton, Byrd, Reilly, Velasquez, Saccuzzo and Grant1998 in which differences disappeared after accounting for acculturation), and a robust interaction between education and race in the cognitively normal group, suggesting that education level affected MINT performance relatively more in African-Americans than Whites. These findings suggest that items on naming tests may often be culturally and/or linguistically biased, and reflect differences in quality of education and early life experiences. In line with this, we also observed a robust age-by-race effect, such that the biggest race differences on the MINT were observed in the oldest cognitively healthy elderly. The oldest African-Americans may have received the lowest quality of education compared to those educated in the post-segregation era (Aiken-Morgan et al., Reference Aiken-Morgan, Gamaldo, Sims, Allaire and Whitfield2015; Anderson, Reference Anderson1988; Manly, Reference Manly2005 for review), and therefore may have had the lowest degree of exposure to and familiarity with items on the MINT. Consideration of reading abilities rather than education has been shown to attenuate differences in neuropsychological test performance between elderly African-Americans and Whites (Manly et al., 2002, Reference Manly, Byrd, Touradji and Stern2004), but reading scores were not available for the current sample.
A particularly notable finding was the age-by-education interaction effect on MINT scores in the cognitively normal group—individuals with low education level and older age exhibited the lowest naming ability on the MINT. This finding is consistent with previous reports of an interaction between age and education on the BNT in cognitively normal elderly (Ashaie & Obler, Reference Ashaie and Obler2014; Welch et al., Reference Welch, Doineau, Johnson and King1996). The effects of education on cognition might not be linear; once a critical number of years of schooling (a threshold) is reached, an individual may subsequently be better able to continue to accrue vocabulary knowledge throughout a lifetime of experiences. By contrast, individuals with lower (or poorer quality) years of education may fail to accrue additional knowledge at the same rate because of insufficient basis of knowledge from which to build. On this view, the interaction effect implies that while higher (post-high school) education levels might have some impact on cognition, education more drastically affects naming ability at the lowest levels (e.g., Ashaie & Obler, Reference Ashaie and Obler2014; Welch et al., Reference Welch, Doineau, Johnson and King1996). Very low education levels might also limit cognitive reserve, which refers to the ability to maintain normal levels of cognitive performance despite the presence of pathology due to protective factors and compensatory processes (Mortimer, Reference Mortimer1997; Stern, Reference Stern2002; for reviews see Fratiglioni & Wang, Reference Fratiglioni and Wang2007, Meng & D’Arcy, Reference Meng and D’Arcy2012). Education is widely regarded as a protective factor and a proxy for cognitive reserve (for reviews see Caamaño-Isorna et al., Reference Caamaño-Isorna, Corral, Montes-Martínez and Takkouche2006; Meng & D’Arcy, Reference Meng and D’Arcy2012). Because age is a risk factor for AD, individuals with the lowest education level may be in the earliest stages of AD and may eventually progress to MCI or AD dementia. However, the cognitive reserve hypothesis is speculative and must be confirmed with follow-up longitudinal studies examining these age and education interaction effects in ‘robust normal control groups’ (Sliwinski et al., Reference Sliwinski, Lipton, Buschke and Stewart1996; Edmonds et al., Reference Edmonds, Delano-Wood, Clark, Jak, Nation, McDonald, Libon, Au, Galasko, Salmon and Bondi2015) who do not subsequently decline on neuropsychological measures over the subsequent 1–2 years or have biomarker evidence that they do not harbor AD pathology.
Across all groups, MINT scores were higher for males than for females. This finding is consistent with the report of the preliminary norming study for the UDS neuropsychological test battery (Weintraub et al., Reference Weintraub, Besser, Dodge, Teylan, Ferris, Goldstein, Giordani, Kramer, Loewenstein, Marson, Mungas, Salmon, Welsh-Bohmer, Zhou, Shirk, Atri, Kukull, Phelps and Morris2018), and with studies that show males generally outperform females on the BNT and other picture naming tasks in both AD and normal control groups (Hall et al., Reference Hall, Vo, Johnson, Wiechmann and O’Bryant2012; Laiacona et al., Reference Laiacona, Barbarotto and Capitani1998; Randolph et al., Reference Randolph, Lansing, Ivnik, Cullum and Hermann1999). A possible explanation for this difference is the higher number of non-living (n = 24) than living (n = 8) items on the MINT. A number of studies have demonstrated robust sex-by-category interaction effects in picture naming with males performing better than females with non-living items, and females performing better than males with living items (Laiacona et al., Reference Laiacona, Barbarotto and Capitani1998; Laws, Reference Laws1999; McKenna & Parry, Reference McKenna and Parry1994). This interaction is most likely due to sex-related differences in item familiarity. A similar sex-related interaction was observed across semantic fluency tasks where cognitively normal males retrieved more names of tools than cognitively normal females, whereas the females retrieved more names of fruit than the males (Capitani et al., Reference Capitani, Laiacona and Barbarotto1999).
Limitations and Future Directions
This study revealed several psychometric limitations of the 32-item MINT, the most significant being the near-ceiling effect in cognitively normal elderly individuals. Although the MINT, like the BNT, was not developed to detect subtle naming deficits (e.g., the BNT was developed to assess anomia in aphasia), these limitations reduce the MINT’s ability to detect very early decline in naming ability that might be associated with AD. ROC curve analyses showed that the MINT was reasonably sensitive in discriminating cognitively normal participants from those with AD, but not from those with MCI. To at least partially address these psychometric limitations, we provided MINT cut-off scores in terms of percentiles (see Tables 6 and 9)—an approach that may be more useful than means and standard deviations for determining impairment. The observed ceiling effect on the MINT may have occurred because the 32 items from the original 68-item MINT were selected for their sensitivity based on a fairly small sample (N = 130; Ivanova et al., Reference Ivanova, Salmon and Gollan2013) and may not generalize well to other independent samples. It should be noted, however, that the 32 items were chosen to be matched in difficulty to the BNT items; MINT items that were not included tended to be easier items (as the MINT was designed to assess a wider range of naming abilities in the non-dominant language). Thus, an alternative selection of items from the full MINT would likely increase rather than reduce ceiling effects.
There are several aspects of the NACC cohort that could have influenced the results. First, more males than females in the dementia group may have artificially inflated the means for that group in light of findings that males score higher than females on the MINT. The NACC cohort is also highly educated on average and predominantly English-speaking and Caucasian, thus reducing the generalizability of these findings to other populations. Despite these psychometric and sample limitations, the current analyses reveal that the MINT detects deficits in naming ability across a range of levels of cognitive impairment, including mild-to-moderate stages of dementia. Given that almost all items were named by cognitively normal individuals (producing ceiling effects on the test), the failure of patients to name more difficult items is likely due to semantic loss commonly seen in AD (Garrard et al., Reference Garrard, Lambon Ralph, Patterson, Pratt and Hodges2005; Hodges et al., Reference Hodges, Salmon and Butters1991; Ivanova et al., Reference Ivanova, Salmon and Gollan2013) rather than unfamiliarity with difficult items.
Because the MINT was originally developed for use in multiple languages, it would be fruitful to examine the sensitivity of the MINT to AD-related language decline in non-English speaking populations, and to determine the impact of demographic factors on MINT performance in these populations. The impact of bilingualism on MINT performance should also be examined given the known effects of bilingualism on picture naming performance (e.g., Gollan et al., Reference Gollan, Fennema-Notestine, Montoya and Jernigan2007). Our finding of a significant effect of race suggests that comprehensive normative data including this variable should be considered in future work. Additional studies are needed to validate the utility of the MINT in participants with lower levels of education with additional measures of quality of education that work better for ethnic minorities (e.g., a test of single word reading; Manly et al., Reference Manly, Jacobs, Touradji, Small and Stern2002).
Finally, longitudinal studies are needed to determine if the MINT effectively tracks the progression of naming deficits through the stages of AD from preclinical disease through frank dementia. A biomarker-defined diagnosis of AD in cognitively normal individuals (i.e., preclinical AD; Sperling et al., Reference Sperling, Aisen, Beckett, Bennett, Craft, Fagan, Iwatsubo, Jack, Kaye, Montine, Park, Reiman, Rowe, Siemers, Stern, Yaffe, Carrillo, Thies, Morrison-Bogorad, Wagster and Phelps2011) is becoming increasingly considered as part of the AD spectrum (Jack et al., Reference Jack, Bennett, Blennow, Carrillo, Feldman, Frisoni, Hampel, Jagust, Johnson, Knopman, Petersen, Scheltens, Sperling and Dubois2016, Reference Jack, Bennett, Blennow, Carrillo, Dunn, Haeberlein, Holtzman, Jagust, Jessen, Karlawish, Liu, Molinuevo, Montine, Phelps, Rankin, Rowe, Scheltens, Siemers, Snyder and Sperling2018), so future assessment of the MINT’s utility in biomarker-defined preclinical AD is warranted. It would also be interesting to examine the impact of co-morbid vascular risk factors (e.g., hypertension, hyperlipidemia, white matter changes on MRI) on MINT performance. Subcortical white matter changes in individuals with AD, for example, may be related to decline in attention, working memory, retrieval processes, or inefficient processing of visual stimuli (Prins et al., Reference Prins, van Dijk, den Heijer, Vermeer, Jolles, Koudstaal, Hofman and Breteler2005) that could impact picture naming ability.
In conclusion, the MINT effectively detects naming impairments in mild-to-moderate AD dementia. There are, however, significant effects of age, education, sex, and race on MINT performance in cognitively normal elderly and in those with AD. This suggests that consideration of demographically corrected normative data is essential for accurately determining naming impairment in AD.
ACKNOWLEDGEMENTS
We wish to thank the UCSD Shiley-Marcos Alzheimer’s Disease Research Center (P50 AG05131), and Jörg Matt, Marc Norman, Bob Heaton, and Lily Kamalyan for helpful discussion. AS was funded by a Ruth L. Kirschstein National Research Service Award (NRSA) Individual Predoctoral Fellowship from the NIA (F31 AG058379-02). THG was funded by the National Institute on Deafness and Other Communication Disorders (011492). DMJ was funded by P50 AG05131. DPS was funded by P50 AG05131, RO1 grant AG049810 and the Helen A. Jarret Chair for Alzheimer’s Disease Research, and is a paid consultant for Takeda Pharmaceuticals, Inc. and Aptinyx, Inc. The NACC database is funded by NIA/NIH Grant U01 AG016976. NACC data are contributed by the NIA-funded ADCs: P30 AG019610 (PI Eric Reiman, MD), P30 AG013846 (PI Neil Kowall, MD), P50 AG008702 (PI Scott Small, MD), P50 AG025688 (PI Allan Levey, MD, PhD), P50 AG047266 (PI Todd Golde, MD, PhD), P30 AG010133 (PI Andrew Saykin, PsyD), P50 AG005146 (PI Marilyn Albert, PhD), P50 AG005134 (PI Bradley Hyman, MD, PhD), P50 AG016574 (PI Ronald Petersen, MD, PhD), P50 AG005138 (PI Mary Sano, PhD), P30 AG008051 (PI Thomas Wisniewski, MD), P30 AG013854 (PI M. Marsel Mesulam, MD), P30 AG008017 (PI Jeffrey Kaye, MD), P30 AG010161 (PI David Bennett, MD), P50 AG047366 (PI Victor Henderson, MD, MS), P30 AG010129 (PI Charles DeCarli, MD), P50 AG016573 (PI Frank LaFerla, PhD), P50 AG005131 (PI James Brewer, MD, PhD), P50 AG023501 (PI Bruce Miller, MD), P30 AG035982 (PI Russell Swerdlow, MD), P30 AG028383 (PI Linda Van Eldik, PhD), P30 AG053760 (PI Henry Paulson, MD, PhD), P30 AG010124 (PI John Trojanowski, MD, PhD), P50 AG005133 (PI Oscar Lopez, MD), P50 AG005142 (PI Helena Chui, MD), P30 AG012300 (PI Roger Rosenberg, MD), P30 AG049638 (PI Suzanne Craft, PhD), P50 AG005136 (PI Thomas Grabowski, MD), P50 AG033514 (PI Sanjay Asthana, MD, FRCP), P50 AG005681 (PI John Morris, MD), P50 AG047270 (PI Stephen Strittmatter, MD, PhD).
CONFLICTS OF INTEREST
The authors have nothing to disclose.