

Though representing <1% of the U.S. population (Burge and Djupe Reference Burge and Djupe2017), Muslims have become quite salient in American electoral politics. During the 2016 presidential primaries, Dr. Ben Carson stated his opposition to a Muslim becoming the president of the United States while eventual nomination and general election winner Donald Trump proposed a ban on Muslims entering the United States. This came on the heels of two presidential elections in which some opponents of President Barack Obama insinuated that he might be a Muslim and the belief that Obama was a Muslim significantly reduced his electoral support (Layman, Kalkan, and Green Reference Layman, Ozan Kalkan and Green2014). Is Carson right that a candidate's Muslim faith should matter, and will matter, to voters? Does the drop in Obama's electoral support from his association with Islam apply to candidates in general? In short, will Americans vote for Muslims?
The answer to our question lies in the group-centric nature of citizen political judgments. What religion a candidate belongs to matters to voters, just as a candidate's membership in other social groups matters. They matter because citizens rely on social groups and their evaluations of groups to make sense of a complex political world (Brady and Sniderman Reference Brady and Sniderman1985). Because voters often base their electoral decisions on their membership in and view about social groups (Berelson, Lazarsfeld, and McPhee Reference Berelson, Lazarsfeld and McPhee1954; Campbell et al. Reference Campbell, Converse, Miller and Stokes1960; Green, Palmquist, and Schickler Reference Green, Palmquist and Schickler2002), the social characteristics of candidates themselves play a crucial role in electoral choice (Berinsky and Mendelberg Reference Berinsky and Mendelberg2005).
The electoral relevance of candidates’ social profiles seems particularly profound in contemporary American politics. Some observers suggested that the 2008 election of Barack Obama as the United States’ first African American president represented the beginning of a “post-racial” America. However, scholars have shown that racism, religious bigotry, and ethnocentrism exerted a substantial influence on voting behavior in 2008 (Tesler and Sears Reference Tesler and Sears2010; Kam and Kinder Reference Kam and Kinder2012; Kinder and Dale-Riddle Reference Kinder and Dale-Riddle2012), while American public opinion suffers from even more racial prejudice after Obama's two elections than it did before (Tesler Reference Tesler2016). Meanwhile, the 2016 presidential election was characterized by sharp criticisms of racial and religious minority groups by eventual winner Donald Trump, and Trump's support was driven in part by hostility toward racial, religious, and cultural minorities (Kalkan Reference Kalkan2016; Sides and Tesler Reference Sides and Tesler2016). In short, present-day U.S. politics seems to confirm that it is human nature to divide the world into “ingroups” and “outgroups”, as ethnocentrism, or the clear preference for ingroups, exerts an expanding influence on American political behavior (Kinder and Kam Reference Kinder and Kam2009). In this context, whether political candidates are seen by voters as part of the cultural mainstream of ingroups or in the cultural periphery of outgroups may be especially important for their electoral prospects.
If that is true, then it is no wonder that some politicians find it advantageous to associate their opponents with Islam—as some of Barack Obama's adversaries did in 2008—or to be critical of the Muslim faith—as Donald Trump and other Republican candidates in 2016 were. Muslims are one of the best examples of an outgroup in contemporary American politics. Earlier and recent data show that the Muslim-American population is growing, has relatively high socioeconomic status, overwhelmingly voted for the Democratic candidate in the 2016 presidential election, and is increasingly represented in federal and statewide political offices (Djupe and Green Reference Djupe, Green and Wilson2007; Burge and Djupe Reference Burge and Djupe2017). For example, the only two Muslims ever elected to the U.S. House were elected in the last decade. Keith Ellison (D-MN) was first elected in 2006. Andre Carson (D-IN) was first elected in 2008. However, Muslims, whose religious beliefs and cultural practices place them outside of the Judeo-Christian mainstream, long have been one of the least popular groups in American society (Kalkan, Layman, and Uslaner Reference Kalkan, Layman and Uslaner2009).
The position of Muslims outside of the U.S. cultural mainstream and the growing salience of that position should make a candidate's Islamic background a powerful and, most likely, negative electoral cue. This negative effect should be especially potent for voters with high levels of generalized antipathy toward cultural outgroups. In fact, previous work shows that the primary predictor of how individuals feel about Muslims is how they feel about other cultural outgroups (Kalkan, Layman, and Uslaner Reference Kalkan, Layman and Uslaner2009). Muslims may occupy something of a unique place among outgroups due to the connection of Islamic extremists to 9/11 and other terrorist attacks and the hostility toward the United States and the West that emanates from certain parts of the Muslim world. And, concerns about these factors surely shape Americans’ views of Muslims to an extent. However, this research shows that it is not these concerns, but rather individuals’ views of other cultural outgroups that principally structure attitudes toward Muslims (Kalkan, Layman, and Uslaner Reference Kalkan, Layman and Uslaner2009).
Our analysis follows a long line of work examining the electoral impact of candidates’ social characteristics. That work has focused principally on candidate race (Sigelman et al. Reference Sigelman, Sigelman, Walkosz and Nitz1995; Tesler and Sears Reference Tesler and Sears2010), gender (Dolan Reference Dolan1998; McDermott Reference McDermott1997; Sanbonmatsu Reference Sanbonmatsu2002), and membership in Judeo-Christian religions (Converse Reference Converse, Campbell, Converse, Miller and Stokes1966; Berinsky and Mendelberg Reference Berinsky and Mendelberg2005; McDermott Reference McDermott2007; Campbell, Green, and Monson Reference Campbell, Green and Quin Monson2012). It has paid little attention to candidates from non-Judeo-Christian faiths. Our focus on Muslim candidates helps to fill that research gap. More importantly, if general feeling toward cultural outgroups is the primary determinant of voting for Muslim candidates, then our work will shed light on electoral reactions not only to Muslim candidates, but also to candidates from a variety of outgroups such as atheists, gays and lesbians, and members of other minority faiths.
To examine the electoral fortunes of Muslim political candidates, we employ two original survey experiments, conducted within the 2007 and 2010 Cooperative Congressional Election Studies (CCES). Our experiments assess the electoral impact of a hypothetical state legislative candidate's Muslim faith—taken by itself and in juxtaposition to cues about candidate ethnicity (Arab), race (African American), and partisanship. Two of the largest ethnic groups among American Muslims are African Americans and people of Arab descent (Djupe and Green Reference Djupe, Green and Wilson2007), and nearly all candidates run as members of a political party. Thus, our experiments allow us to assess how a candidate's Muslim identity interacts with the other social and political identities that Muslim candidates would be most likely to possess.
We focus on “cultural outgroup antipathy”—hostility toward cultural, rather than racial or ethnic, minority groups—to assess how outgroup dislike is related to support for a Muslim candidate. The findings suggest that generalized cultural aversion plays a stronger role than other social and political orientations in conditioning the electoral impact of Muslim faith on electoral support. We also find that a Muslim candidate's party affiliation significantly shapes the impact of cultural outgroup antipathy on electoral support. Attitudes toward cultural outgroups have no effect on Democratic and Republican voters’ support for candidates from the other party, but hostility toward cultural minorities substantially reduces voters’ support for same-party candidates who are Muslim, particularly among Democrats.
ISLAM AS AN ELECTORAL SHORTCUT
Knowing relatively little about public affairs, citizens seek shortcuts for making political judgments (Campbell et al. Reference Campbell, Converse, Miller and Stokes1960; Converse Reference Converse and Apter1964; Popkin Reference Popkin1991; Campbell and Cowley Reference Campbell and Cowley2014), and one of the most powerful and widely used shortcuts is identification with and affect toward social groups (Conover and Feldman Reference Conover and Feldman1984; Miller, Wlezien and Hildreth Reference Miller, Wlezien and Hildreth1991). That people tend to view the social world through the lens of “ingroups” and “outgroups” (Kinder and Kam Reference Kinder and Kam2009) makes social groups politically important, and, in the candidate-centered context of U.S. elections, the social characteristics of candidates are particularly consequential. Candidates’ social profiles directly affect vote choice (McDermott Reference McDermott1997). They also provide cues about their partisanship, competence, and policy stands, and condition the electoral impact of those factors (Huddy and Terkildsen Reference Huddy and Terkildsen1993; Berinsky and Mendelberg Reference Berinsky and Mendelberg2005).
As the political importance of religion has grown, scholars have focused more attention on candidates’ religious orientations. This research suggests that candidate religion affects vote choice both directly and by conditioning the impact of other political orientations (Berinsky and Mendelberg Reference Berinsky and Mendelberg2005; McDermott Reference McDermott2007). However, it is electorally important only to the extent that the candidate's religious group is salient—only if the group comes readily to mind when voters think about political events, issues, or parties (Campbell, Green and Layman Reference Campbell, Green and Layman2011). On the basis of size, Muslims—constituting <1% of the population by most accounts (Djupe and Green Reference Djupe, Green and Wilson2007)—should not be terribly important to Americans’ political judgments. However, the 9/11 terrorist attacks and the events that have followed have made Muslims especially salient in Western societies (Carol, Helbling, and Michalowski Reference Carol, Helbling and Michalowski2015). The responsibility of Islamic extremists for the attacks, the constant involvement of the U.S. military in the predominantly Muslim Middle East, the presence of “homeland security” policies that, to some extent, allow targeting of Arabs and Muslims, the fact that more recent incidents of domestic terrorism have involved Muslims, and the near-daily revelations of international terrorist activities by Islamic extremists all have contributed to an unrelenting and overwhelmingly negative media spotlight on Islam and Muslims since 2001.
That spotlight extended into electoral politics when rumors that Barack Obama was a clandestine Muslim began to swirl during his first campaign for president. Belief in those rumors reduced electoral support for Obama and significant numbers of Americans continue to believe that the president is a Muslim (Layman, Kalkan and Green Reference Layman, Ozan Kalkan and Green2014). Obama's rivals in and after 2008 tried to connect him to Islam in order to portray him as falling outside of the American mainstream. Meanwhile, Donald Trump's proposals to restrict Muslim travel to the United States and to register Muslims already in the United States presumably were meant to place him squarely in the American mainstream. When associating adversaries with Islam and advocating civil and political barriers to adherents of Islam have become effective tactics in political campaigns, there is little question that a Muslim candidate's faith should be salient to voting decisions. Its impact should be largely negative.
CULTURAL OUTGROUP ANTIPATHY
That negative impact should be especially large among voters who have negative feelings about cultural outgroups. A time-honored body of research documents the tendency of people to divide the social world into “ingroups” and “outgroups,” for “members of an ingroup to consider members of outgroups in a relatively uniform manner, as undifferentiated items in a unified social category” (Tajfel Reference Tajfel1982; Allport Reference Allport1954; Adorno et al. Reference Adorno, Frenkel-Brunswick, Levinson and Nevitt Sanford1950), and for individuals to clearly favor ingroups over outgroups. This generalized aversion toward racial, religious, and cultural outgroups has been termed “ethnocentrism” and has been found to be a strong predictor of political attitudes and vote choice (Sniderman and Hagendoorn Reference Sniderman and Hagendoorn2007; Kinder and Kam Reference Kinder and Kam2009; Kam and Kinder Reference Kam and Kinder2012).
Muslim Americans are a textbook example of an outgroup. They are relatively few in number, they are largely foreign-born (Djupe and Green Reference Djupe, Green and Wilson2007), they have religious beliefs and practices that set them apart from the Judeo-Christian mainstream, and the United States for over a decade has been immersed in a “war on terror” in which its primary adversaries are Islamic extremists and the predominantly Muslim countries that support them. Thus, ethnocentrism should be a strong predictor of attitudes toward Muslims and willingness to vote for Muslim candidates.
On the other hand, other scholars find that the attitudes of “mainstream” Americans toward outgroups are not entirely undifferentiated. These Americans make a distinction between minority groups defined largely by racial and ethnic characteristics—African Americans, Latinos, and Asian Americans, for example—and minority groups “defined by behaviors or values that many find unusual or offensive: groups like illegal immigrants, welfare recipients, atheists, and gays and lesbians,” (Kalkan, Layman and Uslaner Reference Kalkan, Layman and Uslaner2009, 848), and they view the latter far more negatively than the former. Briefly put, antipathy toward cultural outgroups is the strongest predictor of prejudice toward Muslims—stronger than antipathy toward racial and ethnic outgroups.
Following this work, we expect that generalized antipathy toward cultural outgroups should play the leading role in shaping views about Muslim candidates. Although the connection of Islam to high-profile terrorist attacks and to recent U.S. military efforts should make Muslims a particularly salient outgroup, past research shows that attitudes toward Muslims are not particularly unique from feelings about other cultural outgroups (e.g. Davis (Reference Davis2007); Panagopoulos (Reference Panagopoulos2006)). They, in fact, are shaped principally by those outgroup feelings—not by partisanship, ideology, patriotism, or perceived threats from terrorism (Kalkan, Layman and Uslaner Reference Kalkan, Layman and Uslaner2009). Thus, Americans who are antagonistic toward cultural outgroups, in general, should be particularly unlikely to vote for a Muslim candidate.
That, of course, is not to say that other factors may not shape electoral reactions to Muslim candidates, and, contrary to our expectations, they may be more important than feelings about cultural outgroups. Party and ideological identification have prodigious effects on voting behavior (Campbell et al. Reference Campbell, Converse, Miller and Stokes1960; Lewis-Beck et al. Reference Lewis-Beck, Jacoby, Norpoth and Weisberg2008), and there are a variety of reasons why Republican partisanship and conservative ideology may produce opposition to Muslim candidates. These include Republican politicians’ criticisms of both Islam and Muslim Americans, the Democratic affiliation of both Muslims in Congress, the efforts by his opponents to associate Democratic President Obama with Islam, and the recent movement of Muslim Americans into the Democratic fold (Barreto and Bozonelos Reference Barreto and Bozonelos2009).
Another important variable may be authoritarianism, which is important for contemporary political behavior (Hetherington and Weiler Reference Hetherington and Weiler2009; Cizmar et al. Reference Cizmar, Layman, McTague, Pearson-Merkowitz and Spivey2013) and related to prejudiced attitudes toward minority groups (Adorno et al. Reference Adorno, Frenkel-Brunswick, Levinson and Nevitt Sanford1950). Education is associated with lower levels of prejudice and a greater likelihood of supporting candidates from religious and racial minority groups (Kinder and Kam Reference Kinder and Kam2009).
Evangelical Christians tend to view religious minority groups less favorably than do other Christian adherents (Green Reference Green2007). They also have become the most Republican of all American religious groups (Layman Reference Layman2001). Thus, for both religious and partisan reasons, evangelicals may be more likely than other religious groups to hold negative views of Muslims.
Finally, recent terrorist attacks and the American war on terror may have increased Americans’ sense of threat from Muslims (Davis Reference Davis2007; Kam and Kinder Reference Kam and Kinder2007). Threat increases aversion to perceived enemies (Duckitt and Fisher Reference Duckitt and Fisher2003), and perceived threats from terrorism may have increased post-9/11 hostility toward Arab- and Muslim-Americans (Davis and Silver Reference Davis and Silver2004; Huddy et al. Reference Huddy, Feldman, Taber and Lahav2005). Thus, individuals who are particularly concerned about ongoing terrorist threats and efforts to stop them may be especially unlikely to support Muslim candidates.
DATA
To evaluate electoral support for Muslim candidates and the effect of cultural outgroup antipathy on that support, we conducted two survey experiments that juxtapose a hypothetical state legislative candidate's Muslim identity with the most common ethnic identities of Muslim Americans and party affiliation. Our experiments were conducted within individual university modules of the 2007 and 2010 CCES. Because we argue that support for Muslim candidates is shaped primarily by the attitudes of “mainstream” Americans toward cultural outgroups, we limit our analysis to the group most commonly associated with the American mainstream: non-Latino whites.Footnote 2
EXPERIMENT 1: MUSLIM FAITH AND ARAB ETHNICITY
There is a distinct ethnic dimension to being Muslim in the United States. Sixty-five percent of Muslim Americans are foreign-born, and nearly half of those came from Arab countries or Iran (Jamal Reference Jamal, Wolfe and Katznelson2010). Although only a quarter of the community emigrated directly from an Arab country, the international focus of the U.S. war on terror has tended to be in the Arab world and in Middle Eastern and South Asian countries that lie close to it. Thus, there is likely to be a close association between Muslim religion and Arab ethnicity in the minds of non-Muslim Americans. For example, in our 2007 survey, the correlation between Arab and Muslim feeling thermometer ratings is 0.80. Accordingly, our first experiment juxtaposes Muslim faith with Arab ethnicity. It compares the electoral fortunes of a candidate about whom there is no mention of religion or ethnicity (our control group), a candidate for whom there is no explicit mention of religion or ethnicity but whose name implies Muslim faith and Middle Eastern background, a candidate explicitly identified as Muslim, a candidate with an Arab background, and a candidate who is both Muslim and Arab.
Respondents to our 2007 survey were randomly assigned to groups receiving each of these profiles for a hypothetical candidate for state legislature. Our description of the candidate's policy positions was designed to be neutral with regard to partisanship and ideology. We presented the control group with the following candidate profile and question:Footnote 3
We would like to get your opinion about a candidate running for the state legislature in another state. Please read his description, and then tell us what you think about him.
Michael Choudhary is a successful local businessman. He is forty-one years old, married, and has three children. He has long been active in his community and local politics. In a recent newspaper article, this is what he said when he was asked why he has entered the state legislative race:
“I am running for the state legislature because I want to see good wages, a strong economy, quality schools, and honest government.”
If you lived in this candidate's district, how likely would you be to vote for him?
We gave respondents four response options: “very likely,” “somewhat likely,” “not very likely,” and “not at all likely.”
For the treatment groups, the candidate's policy priorities and biographical information remained identical, but we provided information—either implicitly or explicitly—about his religion and ethnic background. To see if voters draw conclusions about a candidate's religious or ethnic background from the candidate's name when no information about that background is provided, we employed a “Middle Eastern name” treatment.Footnote 4 Here, our description remains identical except that the candidate has a more stereotypically Middle Eastern or Muslim name:
“Yousef Abdollah is a successful local businessman …” Footnote 5
Our “Muslim candidate,” “Arab candidate,” and “Arab and Muslim candidate” treatments provide explicit information about the candidate's religious or ethnic background. The Muslim candidate treatment simply identifies the candidate as a Muslim:
“(Michael Choudhary/Yousef Abdollah) is a successful local businessman and a Muslim. He is forty-one years old …”
In the Arab candidate treatment, we signal the candidate's Arab ethnicity by telling respondents that he emigrated from an Arab country. To make his Arab background as clear as possible, the country identified is the United Arab Emirates:
“(Michael Choudhary/Yousef Abdollah) is a successful local businessman. He immigrated to the United States from the United Arab Emirates and is a naturalized American citizen. He is forty-one years old …”
In our final treatment, the candidate is identified as both a Muslim and an Arab immigrant:
“(Michael Choudhary/Yousef Abdollah) is a successful local businessman and a Muslim. He immigrated to the United States from the United Arab Emirates and is a naturalized American citizen. He is forty-one years …”
Because Muslims and Arabs are so closely intertwined in the American mind, we expect that identifying our candidate as Arab or as Muslim will have very similar effects on support for him, as will identifying him as both Arab and Muslim. That effect should be conditioned by generalized hostility toward cultural outgroups, growing more negative as voter antipathy increases. Within each of these treatment groups, we asked a randomly selected one-half of respondents about “Michael Choudhary” and the randomly selected half about “Yousef Abdollah.” Because we found no difference between “Choudhary” and “Abdollah” respondents within the treatment groups in overall levels of support for the candidate, our analysis combines the two groups of respondents within these three treatment groups. However, we keep the respondents who received the baseline description for Michael Choudhary (control group) and the respondents who received the baseline description for Yousef Abdollah (Middle Eastern name treatment) separate because we found that candidate name did affect the impact of cultural aversion on candidate support among these respondents (please see Supporting Information for more details on the name treatment).
Measuring Cultural Outgroup Antipathy
To measure cultural antipathy, we combine respondents’ feeling thermometer ratings of other cultural minority groups (reversed to range from the most positive evaluations to the most negative evaluations). We employ 101-point feeling thermometer ratings of three cultural minority groups—gays and lesbians, welfare recipients, and illegal immigrants—that are generally unpopular and highly stereotyped (Gilens Reference Gilens2000; Brewer Reference Brewer2008). A factor analysis of ratings of these groups shows that effect toward them forms a single attitudinal dimension.Footnote 6
Findings
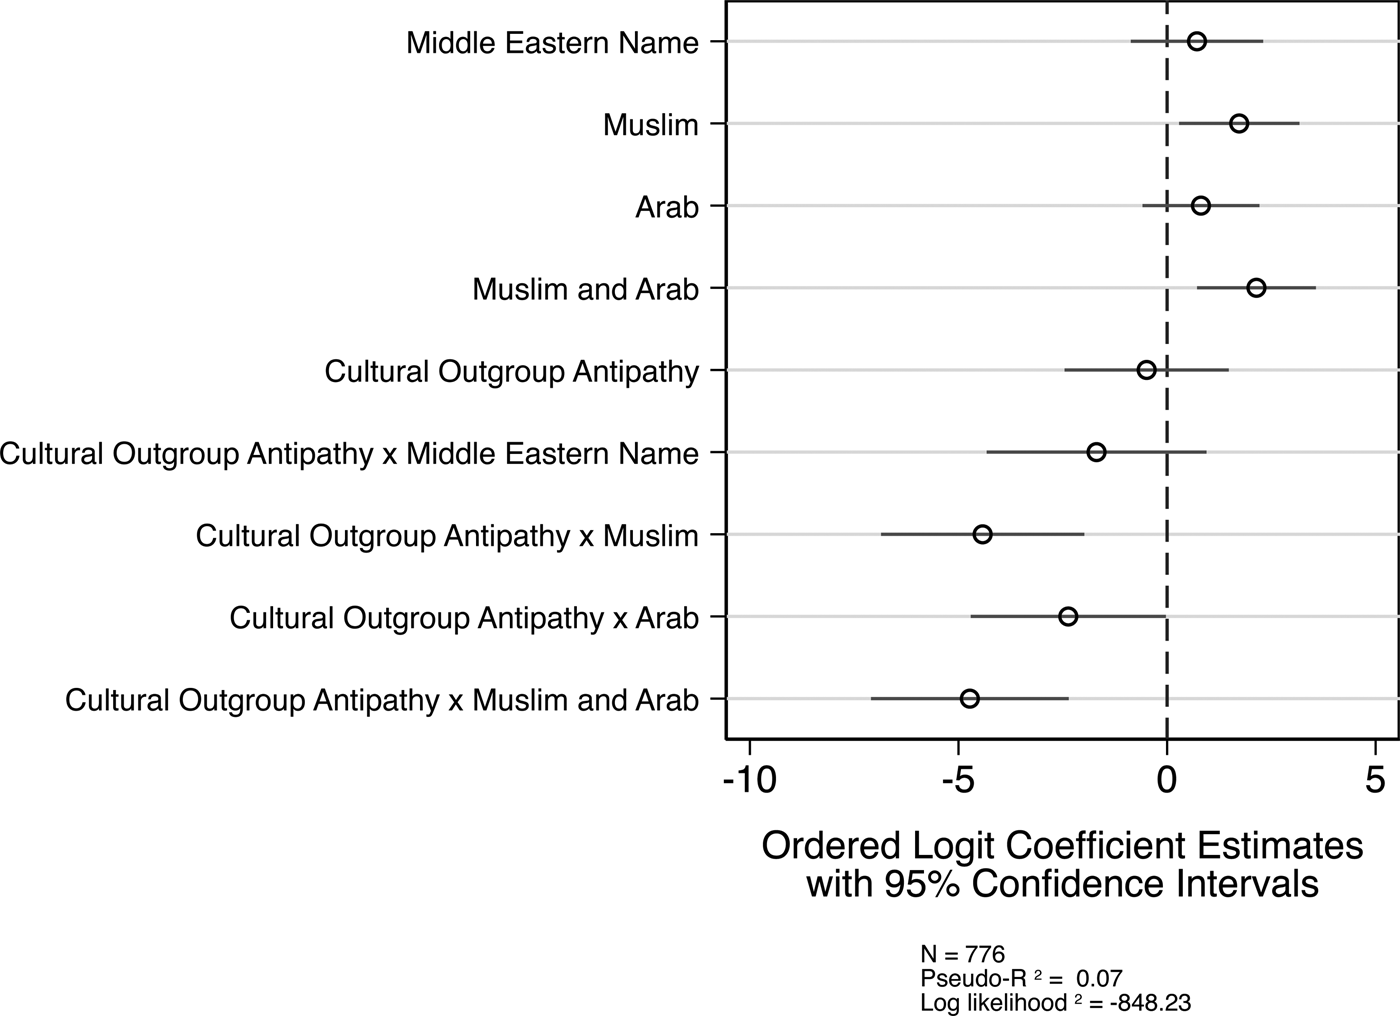
Because our dependent variable is a four-category ordinal variable, we estimate an ordered logit model of candidate support among non-Latino whites. All ordered logit models in the paper satisfy the parallel regression assumption. The explanatory variables are cultural outgroup antipathy, dichotomous variables for our four treatments (Middle Eastern name, Muslim, Arab, and Muslim/Arab), and the interactions between cultural outgroup antipathy and each of the treatment variables. Since respondents were randomly assigned to the control and treatment groups, the models do not include control covariates.Footnote 7 The comparison category is the baseline condition. We present the ordered logit coefficient estimates and their standard errors in Figure 1.
The Interactive Model of Cultural Outgroup Antipathy, Candidate Religion and Ethnicity, and Candidate Support, Experiment 1.

The results clearly show that feelings about cultural outgroups condition the effect of candidate religion and ethnicity. The coefficient on cultural outgroup antipathy indicates its effect on voting decisions when our candidate has no Islamic or Middle Eastern background.
Thus, it is not surprising that it is close to zero and nowhere close to statistical significance. The estimates on the treatment variables represent the effect of the candidate's religion, ethnic background, or both among those who have positive feelings toward outgroups (zero on cultural outgroup antipathy). The positive and statistically significant coefficients on the Muslim and Muslim/Arab treatment variables indicate that white Americans who welcome outgroups are more likely to support a Muslim candidate or a candidate who is Muslim and Arab than the baseline candidate. There is also a positive effect of the Arab treatment among people with positive views of cultural outgroups, but it is not statistically significant.
Most central to our hypothesis are the interaction term coefficients, which represent the change in the effect of the religious and ethnic treatments as cultural outgroup antipathy increases. The interactions for the Muslim, Arab, and Muslim and Arab treatments are all negative and statistically significant. This means that outgroup antipathy conditions the effect of the candidate's Islamic and Middle Eastern background and does so in a negative way—as cultural aversion grows, being Muslim, Arab, or both becomes increasingly harmful to our candidate's support.Footnote 8 In fact, simply having a Middle Eastern name may even hurt a candidate's chances among voters with particularly negative views of cultural minority groups. The effect of hostility toward cultural outgroups is more negative for a candidate named Yousef Abdollah than it is for a candidate named Michael Choudhary, though the interaction is not statistically significant.
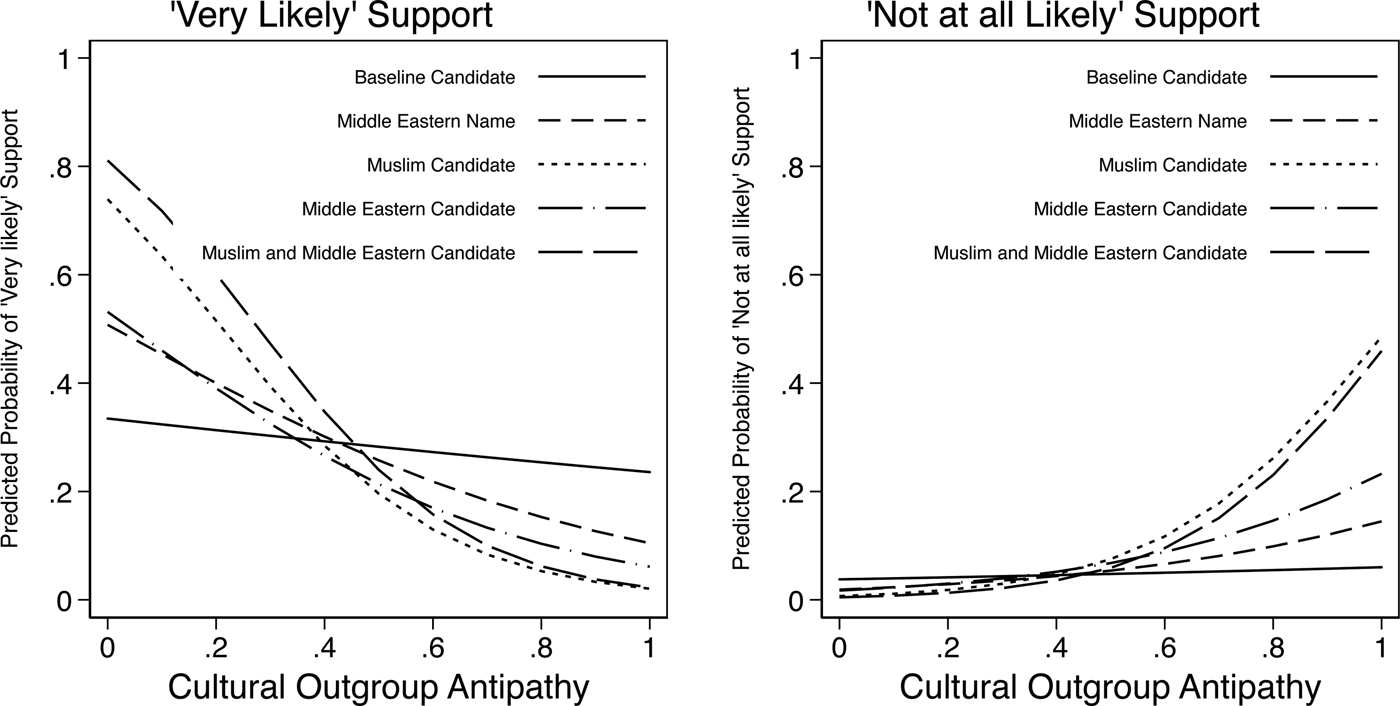
In Figure 2, we highlight the substantive implications of the ordered logit results by showing the relationship between cultural outgroup antipathy and the predicted probability of being “very likely” and “not at all likely” to vote for our candidate across the various experimental groups.Footnote 9
Cultural Outgroup Antipathy and Predicted Candidate Support across Candidate Treatments, Experiment 1.

There are four important patterns in the figure. First, the probability of voting for the baseline candidate does not change noticeably across values of cultural outgroup antipathy. Second, the aversion against cultural minority groups has a negative effect on support for a candidate with a Middle Eastern name or with an Arab background, but the effect is relatively modest. These factors do trigger antipathy against candidates, but not in a very sizable way. Third, the aversion has a substantial negative impact on support for a candidate who is Muslim or Muslim and Arab. As distaste toward these groups grows, the probability of “very likely” support for a candidate with ties to Islam declines precipitously, and the probability of “not at all likely” support increases. It is clear that cultural outgroup antipathy is a defining and significant feature of voting behavior when a Muslim candidate is on the ballot.
A fourth important pattern in the figure is that the negative impact of cultural outgroup antipathy on the probability of being “very likely” to support Muslim candidates (and candidates who are both Muslim and Middle Eastern) is due not just to culturally antipathic whites being less likely to vote for a Muslim candidate than for the baseline candidate. It also results from whites with low levels of cultural aversion being more likely to vote for a Muslim candidate than for the baseline candidate. The preference of culturally tolerant voters for Muslim candidates over the baseline candidate closely parallels Hetherington's and Weiler's evidence that “nonauthoritarians” exhibit a preference for outgroups—favoring members of cultural and racial minority groups when it comes to public benefits (2009). Nonauthoritarians—a group that undoubtedly scores quite low in cultural outgroup antipathy—favor outgroups over ingroups out of a sense of fairness. Because minority groups have historically been disadvantaged and discriminated against, nonauthoritarians believe that fairness is achieved by giving a preference to members of these groups (Hetherington and Weiler Reference Hetherington and Weiler2009, 43–44). Culturally tolerant whites may prefer Muslim candidates to non-Muslim candidates for similar reasons. Because Muslim Americans have been targets of prejudice and discrimination, culturally tolerant voters may see it as only fair to offer their strongest support to Muslim candidates.
Alternative Explanations
Although negative views about cultural outgroup have a big effect on support for a Muslim candidate, the effects of other variables may be bigger. It is also possible that antipathy is a proxy for other variables that are related to both it and the likelihood of voting for Muslim candidates. As we theoretically noted, these variables might include party identification, ideological identification, authoritarianism, education, and the evangelical Protestant religion.
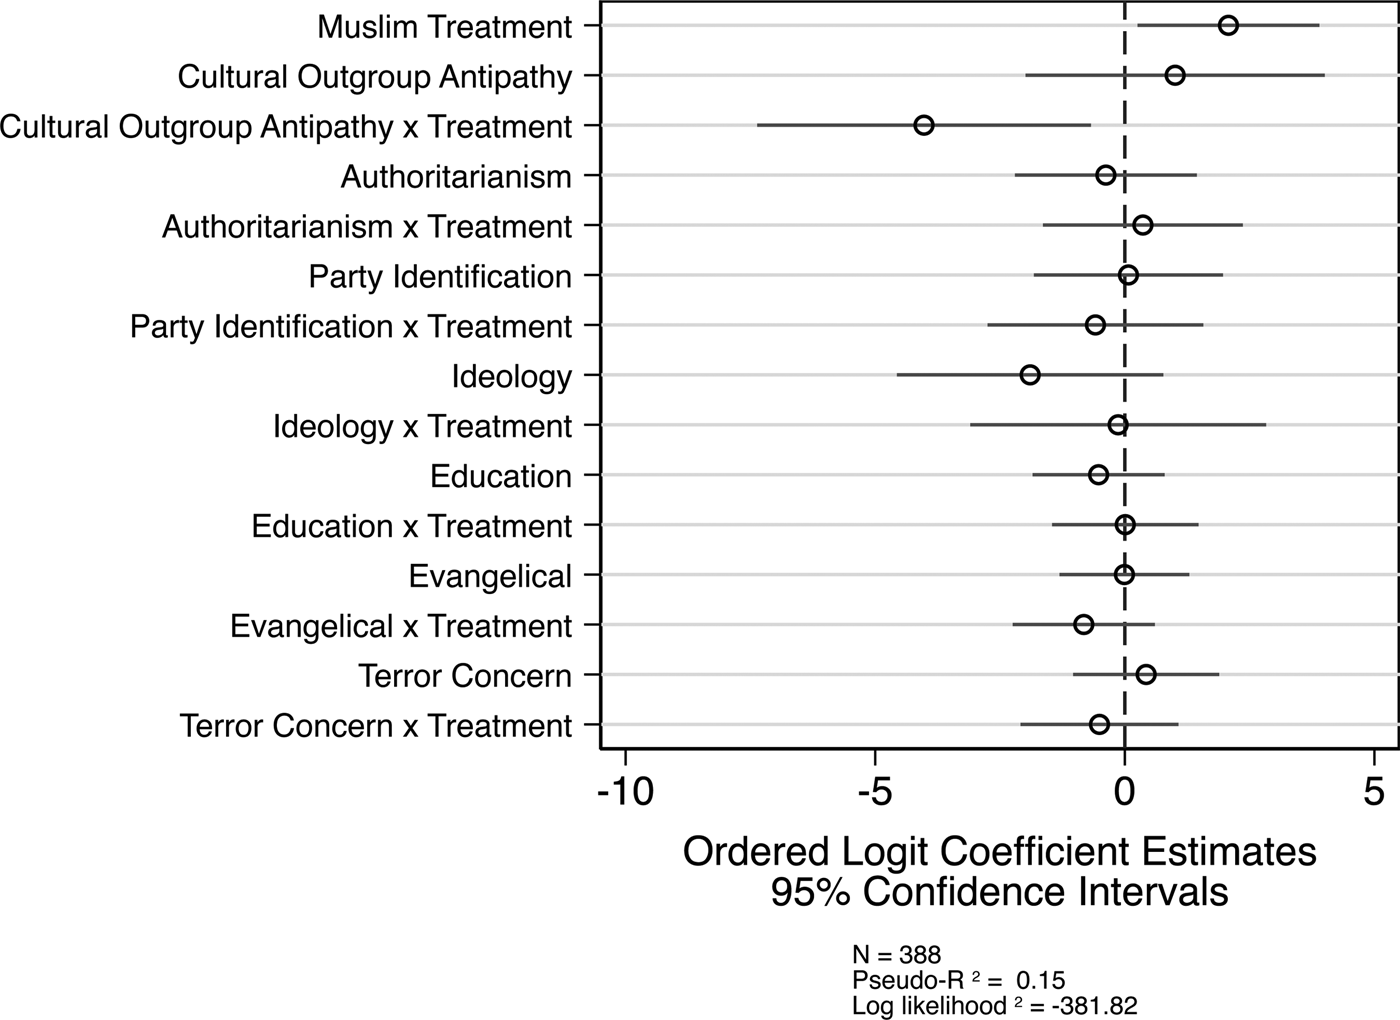
To assess whether these other factors account for the conditional effect of antipathy or also condition the effect of candidate religion themselves, we estimated a comprehensive model including cultural antipathy and each of these alternative variables. The model contains a single dummy variable combining the Muslim and Muslim—Arab treatment groups (with only the baseline condition as the comparison group). We combine these two treatment groups because Figure 2 shows that the effect of cultural outgroup antipathy is strongest for and nearly identical across the Muslim candidate and Muslim and Arab candidate treatment groups. The “Middle Eastern name” and “Arab candidate” treatment groups are excluded from this analysis.Footnote 10 It also includes interactions between that dummy variable and cultural antipathy, party identification, ideology, authoritarianism, and education.
Party identification is a seven-category variable that ranges from strong Democrat to strong Republican. Ideology is a seven-category variable that ranges from extremely liberal to extremely conservative. Authoritarianism is a factor score of responses to four questions asking respondents to choose the most desirable of pairs of child qualities: independence or respect for elders, curiosity or good manners, obedience or self-reliance, considerate or well-behaved. These questions represent the standard measure of authoritarianism in recent work (Hetherington and Weiler Reference Hetherington and Weiler2009; Cizmar et al. Reference Cizmar, Layman, McTague, Pearson-Merkowitz and Spivey2013) and our factor analysis of the four questions yielded a single factor with an eigenvalue of 1.91 and explaining 48% of the total variance in the four items. Authoritarianism and antipathy are theoretically related concepts (Adorno et al. Reference Adorno, Frenkel-Brunswick, Levinson and Nevitt Sanford1950). They also are empirically related, but the relationship is relatively modest. The pairwise correlation between authoritarianism and cultural outgroup antipathy is 0.36 (p < 0.05). Because our measure of cultural outgroup aversion is more directly targeted at effect toward cultural minority groups such as Muslims, we expect it to have more predictive power than authoritarianism.
We also included a variable measuring perceived level of terrorism. It is a dichotomous variable that codes respondents who think terror is the most important problem or support the Foreign Intelligence Surveillance Act, popularly known as FISA, to 1, and the rest to 0. Including this variable and its interactions with our treatments allows us to assess whether support for Muslim candidates is structured by concerns about terrorism and by a perceived connection between Muslims, terrorism, and threats toward the United States.
Education is a five-category variable that ranges from high school degree or less education to graduate degree. Our evangelical variable is a dummy variable coded 1 for evangelical Protestants and 0 for all other respondents. We identify evangelical Protestants based on religious affiliation, following the method outlined in Green (Reference Green2007). All variables are coded to range between 0 and 1.
The estimates of this model are presented in Figure 3. The figure clearly shows that the alternative explanatory variables fail to account for the conditional effect of cultural outgroup antipathy on the electoral impact of the Muslim faith. In fact, the cultural outgroup antipathy is the only explanatory variable in the model that significantly conditions the impact of the Muslim religion. Its interaction with the Muslim candidate variable is negative and statistically significant, while none of the other variables’ interactions with the Muslim candidate variable reach standard levels of statistical significance.
Interactive Model of Alternative Explanations, Experiment 1.

In short, aversion to cultural outgroups is clearly the primary factor that conditions the relationship between a candidate's Muslim faith and voter support for him. Its conditional effect is stronger than that of any of the alternative explanatory variables and none of the alternative variables seems to account for that effect.
EXPERIMENT 2: CANDIDATE RELIGION, RACE, AND PARTY
Arabs are the ethnic group that comes most readily to mind when most white Americans think of Muslims. However, when they encounter a Muslim candidate at the ballot box, that candidate is most likely to be an African American. Black Muslims have been in the United States longer, have a longer history of political activism, and are more politically engaged than other groups of American Muslims (Djupe and Green Reference Djupe, Green and Wilson2007). It is not surprising, then, that African Americans are disproportionately represented among prominent Muslim politicians. Both of the Muslim representatives in the U.S. House—the only two Muslims to ever be elected to Congress—are African American, and a clear majority of Muslims serving in state legislatures are black. Thus, it is important to examine how Muslim religion and African American race interact to affect a candidate's electoral support.
Whereas white voters seem to make little distinction between Muslim and Arab candidates, there are several reasons why they should react differently to Muslim candidates and African American candidates. First, although feelings about Muslims are related to views of blacks and other racial minority groups, the American public associates Muslims more closely with cultural minority groups and views racial minority groups more favorably than Muslims and other cultural outgroups (Kalkan, Layman and Uslaner Reference Kalkan, Layman and Uslaner2009). Second, black candidates are far more common than Muslim candidates in American politics. This greater political familiarity with African American politicians—something that has grown with an African American occupying the White House—should mean that the general tendency to oppose that which is unusual and different should be less important in voting for African Americans.
Third, whites may view Muslims as less “American” than blacks. Theiss-Morse (Reference Theiss-Morse2009, 87–88) finds that “being white” is viewed by a sizable minority of Americans as important to being “truly American.” However, about twice as many people believe that “being Christian” is important to be a true American. Moreover, Americans tend to connect Muslim religion with Arab ethnicity and both Arabs and Muslims are associated in the American mind with terrorism (Davis Reference Davis2007). That may be a further reason for white voters to see Muslim (and Arab) candidates as being less truly American than African American candidates.
Fourth, because of blacks’ unique history of slavery, segregation, and state-sponsored denial of civil and political rights, many scholars contend that whites’ views of African Americans are, to some extent, exceptional—based more in distinctive views about blacks and their place in American life than in general antipathy toward minority groups (Kinder and Sanders Reference Kinder and Sanders1996).
Thus, we expect cultural outgroup antipathy to have a larger electoral impact for a Muslim candidate than for an African American candidate. Our expectations for black Muslim candidates are more subtle. The candidates’ Muslim faith should trigger negative reactions, but their race may mute the effect of cultural outgroup antipathy and amplify the impact of anti-black prejudice.
Another crucial aspect of candidate identity that we considered in our second experiment is party affiliation. Nearly all office-seekers in American politics run as members of either the Democratic Party or the Republican Party, so it is important to assess how candidate party interacts with candidate race and religion and voter prejudice. Because party identification is the most important determinant of American voting behavior, we expect cultural antipathy to shape electoral support only when a candidate shares a voter's party attachment. Party identifiers should oppose candidates from the other party, regardless of their race or religion and the voter's level of aversion to cultural outgroups. However, aversion to cultural outgroups should be more important for same-party candidates. If a candidate is Muslim or comes from a racial, ethnic, or cultural minority group, highly antipathic partisans may reject their party's standard bearers.
To assess these expectations, we placed our second experiment on two modules of the 2010 CCES. The experiment varied the information respondents received about the candidate's religious background (whether or not he is identified as a Muslim), his racial background (whether or not he is African American), and his party identification (whether he is a Republican or a Democrat). We randomly assigned our respondents to eight experimental groups, with each group receiving a different combination of our three treatments. Because we presented all respondents with either a Democratic or Republican candidate, there were two baseline treatments—one for a Democrat, one for a Republican. They were worded as follows:
“We would like to get your opinion about a candidate running for the state legislature in another state.”
“Joe Faris is a successful businessman. He is forty-one years old, married, and has three children. He has long been active in his community and the (Democratic Party/Republican Party). In a recent newspaper article, this is what he said when he was asked why he has entered the state legislative race:” Footnote 11
“I am running for the state legislature because I want to see good wages, a strong economy, quality schools, and honest government.”
“If you lived in this candidate's district, how likely would you be to vote for him?”
We gave respondents four response options: “very likely,” “somewhat likely,” “not very likely,” and “not at all likely.”
For the treatment groups (three with the candidate identified as a Democrat, three with a Republican), we kept the candidate's policy priorities and other biographical information intact and provided information about his religion and race. In the Muslim candidate treatments, we told respondents that:
“Joe Faris is a successful businessman and a Muslim. He is forty-one years old, …”
In the African American candidate treatments, we described the candidate as follows:
“Joe Faris is a successful African American businessman. He is forty-one years old, married, and has three children. He has long been active in his community and the (Democratic party/Republican party) …”
The remaining manipulations portray Joe Faris as an African American and a Muslim:
“Joe Faris is a successful African American businessman and a Muslim. He is forty-one years old, married, and has three children. He has long been active in his community and the (Democratic party/Republican party) …”
Our key explanatory variable is cultural outgroup antipathy. It is the average of each respondent's feeling thermometer ratings (reversed so that higher scores represent more-negative evaluations) of four cultural outgroups: gays and lesbians, illegal immigrants, welfare recipients, and atheists.Footnote 12
Race, Religion, and Voting among Partisans
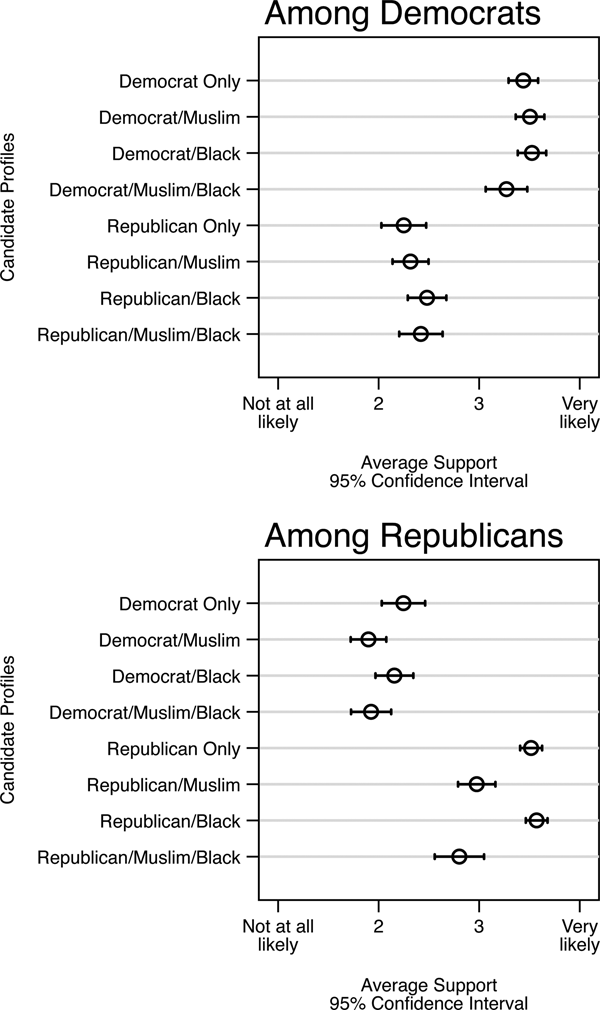
In Figure 4, we assess the impact of the candidate treatments by comparing the mean level of support for our candidate (on a scale ranging from 1 for “not at all likely” to 4 for “very likely” to vote for him) across the eight experimental groups for Democratic and Republican identifiers. Not surprisingly, Democrats and Republicans are significantly more likely to support a candidate of their party than a candidate of the other party. Both parties’ identifiers are more supportive, on average, of every type of candidate from their party than they are of every type of candidate from the other party.
Mean Candidate Support by Candidate Treatment and Respondent Party, Experiment 2.

For Democratic identifiers, that is where the story ends as candidate religion and race produce no statistically significant differences in Democrats’ levels of support for Democratic or Republican candidates. Among Republicans, however, support for their own party's candidate drops off significantly when the candidate is identified as a Muslim or as both Muslim and African American. Part of the reason for this drop may be that Republican identifiers are simply more culturally antipathic than Democratic identifiers. However, the negative reactions of Republican partisans to a Muslim candidate may go beyond that as even among whites with the most positive view of cultural minority groups, Republicans still have significantly less favorable views of Muslims than Democrats do.Footnote 13 That may reflect the GOP's preference for a forceful U.S. policy toward Islamic extremist groups and some predominantly Muslim countries as well as the criticism that some Republican leaders have directed toward Islam and Muslim Americans. It also may be due to Republican identifiers associating Muslims with the Democratic Party as Muslim Americans have grown more Democratic in their party loyalties and Democrats have represented the large majority of Muslims in high-level elected office. If Republican identifiers have begun to see Muslims as a core Democratic constituency, then they may react to a Muslim Republican candidate as if he is a Democrat or at least not a “true Republican.”
In fact, to examine how Americans, especially Republicans, perceive the party ties of Muslim Americans, we fielded an online survey using Amazon's Mechanical Turk (MTurk) (please see Berinsky, Huber, and Lenz (Reference Berinsky, Huber and Lenz2012) for a detailed assessment of the use of Mechanical Turk in social science research) asking 1,000 respondents whether they thought that Muslim Americans were “mainly Democrats, mainly Republicans, or a pretty even mix of both.” Among all white respondents, 49% answered that Muslim Americans are mainly Democrats, 41% said that they are an even mix of both Democrats and Republicans, and only 10% identified Muslim Americans as mainly Republicans. The association of Muslim Americans with the Democratic Party was even stronger among white Republican respondents. Almost 62% of these respondents perceived Muslim Americans to be mainly Democrats, 32% viewed them as an even mix of Democrats and Republicans, and <6% said mainly Republicans. Interestingly, white Republican respondents associated Muslim Americans more closely with the Democratic Party than Jews (40% “mainly Democrats”) and agnostics (57%), and almost as ingrained in the Democratic camp as atheists (68% “mainly Democrats”).
This suggests that the impact of cultural outgroup antipathy on support for same-party Muslim candidates may be greater for Democrats than Republicans. Democrats, as a group, are as likely to support a Muslim Democrat as they are to support any other Democratic office-seeker. Thus, Democrats who oppose a Muslim Democrat because of their antipathy for cultural outgroups should differ clearly from their fellow partisans. In contrast, if even Republicans with positive feelings about cultural outgroups have relatively negative views of Muslims, there may be less distinction between the propensities of culturally antipathic and non-antipathic Republicans to vote for a Muslim Republican.
Conditioning the Impact of Cultural Outgroup Antipathy
To evaluate how the electoral impact of feelings about cultural outgroups is conditioned by candidate race, religion, and party as well as by voter partisanship, we estimate an ordered logit model of candidate support (ranging from “not at all likely” to “very likely” to vote for the candidate) separately for Democratic and Republican respondents. We code independent leaners as partisans. The primary independent variables in the model are cultural outgroup antipathy, dummy variables for seven of the eight groups in our experiment, and the interaction between antipathy and the seven treatment dummies. The excluded experimental group in each party's analysis includes respondents who read about their own party's candidate with no religious or racial identifiers.
It is possible that electoral support for a black or black Muslim candidate is structured more by feelings specifically about African Americans. To account for that possibility, our models also include antipathy toward African Americans (reversed feeling thermometer ratings of blacks) and its interaction with our seven treatment dummies.
Among Democrats
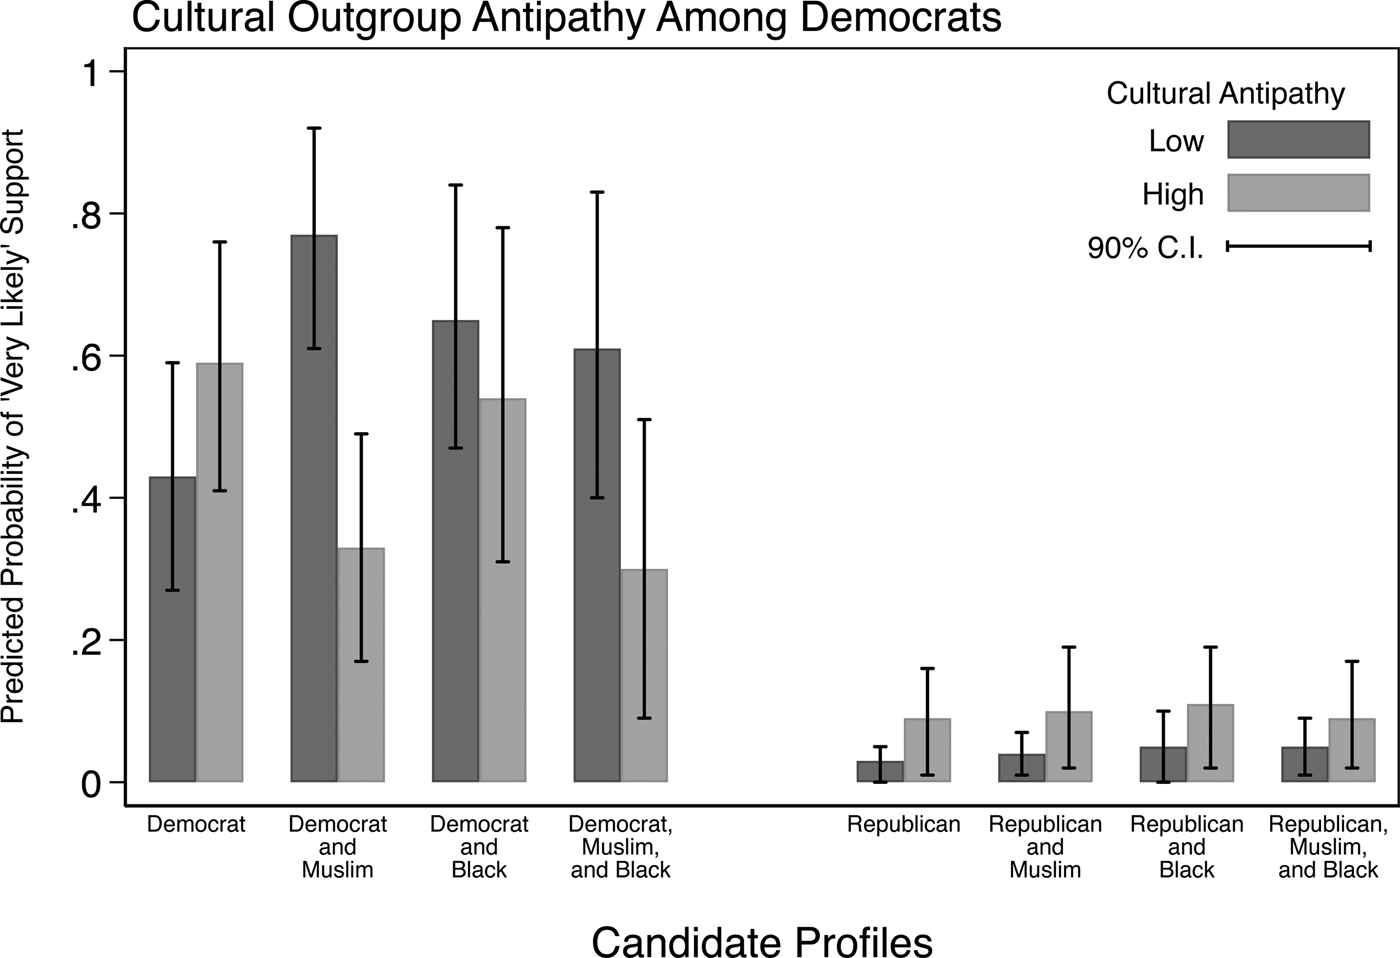
Because our models produce a very large number of ordered logit coefficients, we present the coefficient estimates in our Supporting Information, and focus here on predicted probabilities based on these estimates. In Figure 5, we illustrate the substantive implications of the estimates for Democratic identifiers by showing predicted probabilities of “very likely” support for our candidate among Democrats with low and high cultural antipathy scores (10th and 90th percentile) across different treatments. We also show 90% confidence intervals around the probabilities.Footnote 14
Cultural Outgroup Antipathy and Predicted Candidate Support across Candidate Treatments: Democratic Identifiers, Experiment 2.

The results show that the effect of cultural outgroup antipathy on support for the baseline Democratic candidate is small and statistically insignificant. However, Democrats with negative views of cultural outgroups are clearly less likely than Democrats with positive views of those groups to support a Muslim candidate of their own party, and the non-overlapping confidence intervals between those two groups indicate that the difference is statistically significant.
Interestingly, this strong effect of cultural antipathy is due not just to Democrats with negative views of outgroups being less likely to support a Muslim Democrat. It results also from Democrats with positive views of cultural outgroups being significantly more likely to support a Muslim Democrat than the baseline candidate from their own party. As with our finding that culturally tolerant whites prefer Muslim candidates to the baseline candidate in experiment 1, this parallels Hetherington's and Weiler's (Reference Hetherington and Weiler2009) evidence on nonauthoritarians’ preference for outgroups. Now, we have tapped into the partisan element highlighted by those scholars—that nonauthoritarians have become increasingly Democratic in recent years (see also Cizmar et al. Reference Cizmar, Layman, McTague, Pearson-Merkowitz and Spivey2013). From the perspective of this combination—culturally tolerant nonauthoritarians growing more Democratic and favoring outgroups over ingroups—it makes sense that culturally tolerant Democrats would prefer a Muslim Democratic candidate to a baseline Democrat.
That is particularly true given the political situation when we conducted our experiment in 2010. Nearly 2 years into his presidency, Democrat Barack Obama continued to be dogged by rumors of having Muslim faith that had begun early in his presidential campaign. In some sense, culturally tolerant Democrats’ preference for a Muslim Democratic candidate may have been a sign of support for a Democratic president connected to Islam by his opponents and in the minds of many American voters.
That preference may be even stronger today due to a very different political context. The current president, Donald Trump, is, of course, a Republican who was critical of Muslims during his presidential campaign and, as president, has pursued a ban on travel to the United States of citizens of some predominantly Muslim nations. In this context, culturally tolerant Democrats may show enthusiasm for Muslim Democratic candidates as a sign of their opposition to President Trump.
Figure 5 shows a similarly negative effect of cultural outgroup antipathy on support for a Democratic candidate who is Muslim and African American. Cultural tolerance and aversion clearly are important for how Democratic voters react to Muslim Democratic candidates. On the other hand, the effect of cultural aversion on support for a black Muslim Democratic candidate is neither statistically significant, nor is it as strong as that for a Democratic candidate who is just Muslim. As we hypothesized, this may result from white voters’ greater familiarity with black candidates muting the negative impact of cultural outgroup antipathy on evaluations of black Muslim candidates—just as it does for assessments of candidates described only as black.
In contrast, it does not seem to be important when the Democratic candidate is only African American as the difference between Democrats with positive and negative views of cultural minority groups is small and statistically insignificant in this case. As we hypothesized, cultural outgroup antipathy shapes voter support more for Muslim candidates than for black candidates. That may explain why its impact is smaller.
Cultural minority aversion also is inconsequential when the candidate is a Republican, and that is true regardless of the candidate's racial or religious characteristics. Democratic voters oppose Republican candidates regardless of the candidate's social profile or their own views about minority groups.
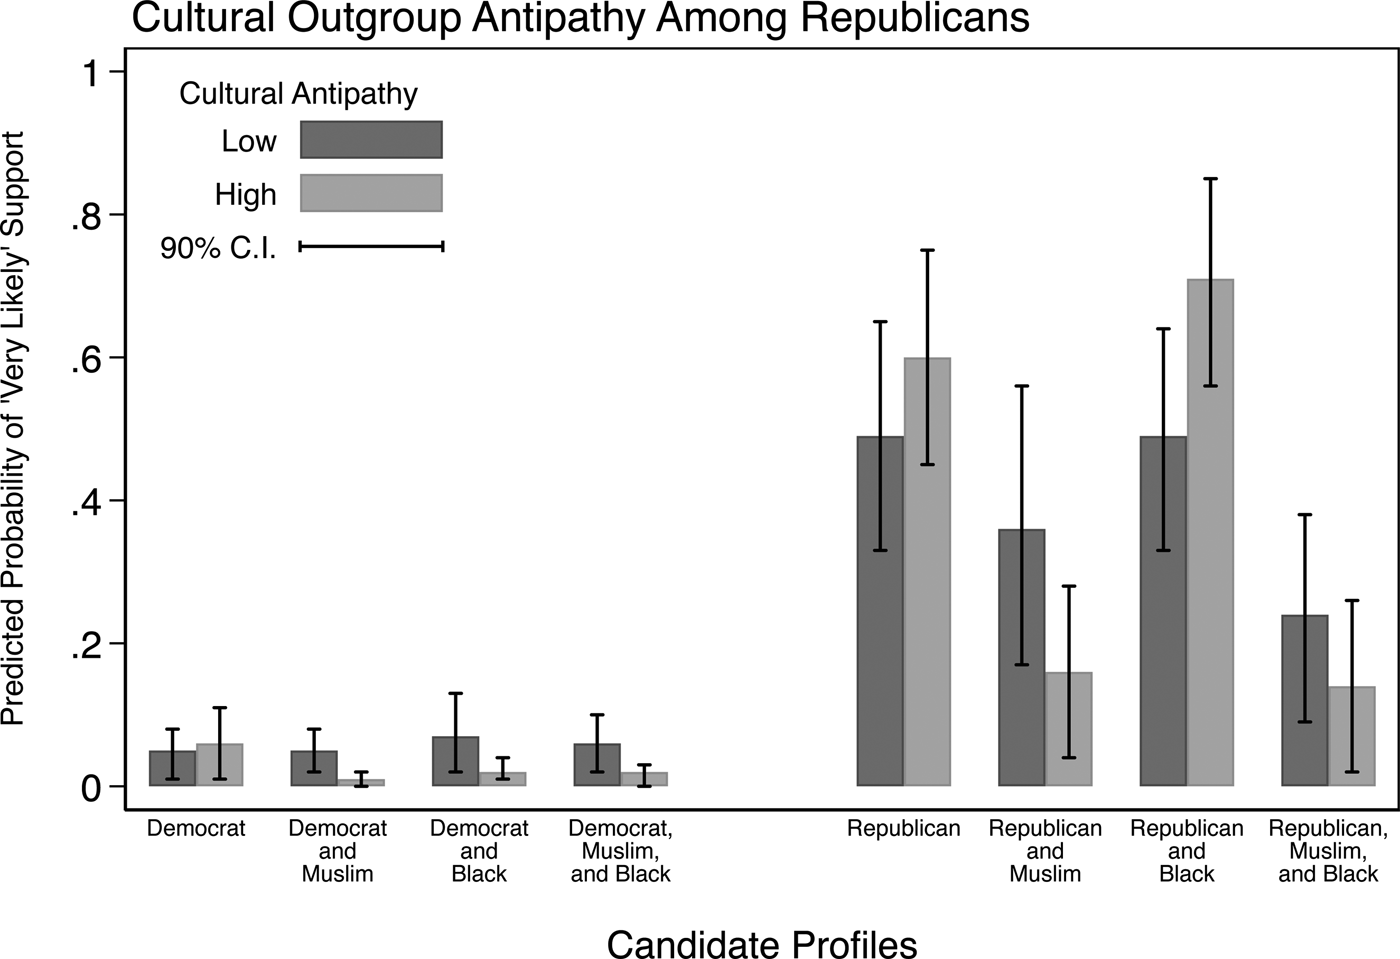
Among Republicans
In Figure 6, we show the predicted probabilities of “very likely” support for different candidate profiles among Republican identifiers. Like Democrats, Republicans with high levels of cultural outgroup antipathy are less likely than their less antipathic fellow partisans to support a same-party candidate who is Muslim. Here the difference in support is not statistically significant, but that is not due to Republicans with negative views of cultural outgroups being more likely than Democrats with similar views to vote for a same-party Muslim candidate. In fact, that likelihood is noticeably smaller among culturally averse Republicans than among culturally averse Democrats. Rather, the non-significance for Republicans seems to result from culturally tolerant members of the GOP being far less likely than culturally tolerant Democrats to support a same-party Muslim candidate. As our MTurk data suggest, this may be due to Republicans perceiving Muslims to be mostly Democrats. A Muslim Republican candidate may sound unrealistic even to culturally tolerant Republican partisans.
Cultural Outgroup Antipathy and Predicted Candidate Support across Candidate Treatments: Republican Identifiers, Experiment 2.

The lesser consequence of cultural outgroup antipathy on support for African American candidates is also evident here as culturally averse Republicans actually are more likely than Republicans with positive views of cultural outgroups to vote for a black Republican candidate. Of course, the difference is not statistically significant. However, to the extent that there is a difference, one explanation may be that high-profile African American politicians in the Republican Party—politicians such as Ben Carson, Tim Scott, and Alan Keyes—are often very conservative, both economically and culturally. Republican voters with negative views of cultural minority groups may gravitate toward black Republican candidates as a sign of their support for the cultural conservatism espoused by some of the more prominent African Americans in the GOP.
Similar to the Democratic findings is that candidate characteristics and voters’ feelings about cultural minority groups make little difference when it comes to opposite-party candidates. Just as Democratic voters oppose all kinds of Republican candidates, both culturally averse and culturally tolerant Republicans oppose Democratic candidates of all racial and religious stripes.
CONCLUSION
Aversion to minority groups continues to play an important role in political behavior (Kinder and Kam Reference Kinder and Kam2009; Tesler Reference Tesler2016). Virtually no minority group is the subject of more electorally relevant antipathy than Muslims. The belief by many citizens that President Obama was Muslim significantly reduced their likelihood of voting for him (Layman, Kalkan, and Green Reference Layman, Ozan Kalkan and Green2014). The recent focus of Republican presidential candidates on Muslim immigration to the United States and Muslims’ suitability for the White House attests to the fact that Muslims are one of the least popular groups and, increasingly, one of the most salient groups in American society and politics.
However, Muslims do not stand alone as an object of antipathy. Rather, feelings about Muslims are closely tied to feelings about other cultural outgroups—groups such as illegal immigrants, gays and lesbians, atheists, and welfare recipients (Kalkan, Layman, and Uslaner Reference Kalkan, Layman and Uslaner2009). Hostility toward Muslims, in other words, is based in generalized hostility toward cultural outgroups.
In this paper, we extended the analysis of the political impact of cultural outgroup antipathy by assessing American support for Muslim political candidates. We found that support for a Muslim candidate reduces significantly as antipathy toward cultural outgroups increases. In fact, besides a candidate's party, cultural aversion appears to be the most important factor in determining electoral support for a Muslim candidate. Moreover, cultural outgroup antipathy's marked impact on voting for a Muslim candidate holds whether the candidate is Arab, African American, or a member of one's own political party.
Can we generalize from our single-candidate experiments with hypothetical candidates to the factors shaping Muslim electability in the real political world? Our experiments certainly have some strengths. Like all randomized experiments, they allow us to isolate the causal effect of our key independent variable—a candidate's Muslim faith. Moreover, presenting respondents with only one candidate allows us to isolate how a particular candidate's faith affects political evaluations, independent of positive or negative evaluations of other candidates. It also reflects the reality of many campaign messages, which focus only on the particular candidate and not on her or his opponents. Of course, there are limitations to our experiments. They do not allow us to evaluate the impact of a candidate's Muslim faith when voters have choices between two or more candidates. They also may not capture the reality of actual campaigns. The emergence of a Muslim candidate might change calculations of voters due to actual primary and general election campaigns and elite rhetoric.
Fortunately, the recent elections of Andre Carson and Keith Ellison to the U.S. House of Representatives enable us to test the application of our findings in real situations. Using the common content portion of the 2006 and 2010 CCES surveys, we examined the impact of “outgroup” policy attitudes (illegal immigration, gay marriage, and gays serving in the military) on support for Carson and Ellison while controlling for party identification, ideological identification, demographic factors, and attitudes toward other political issues. Our analysis shows that aversion to cultural outgroups significantly shaped electoral reactions to Muslim candidates even in the presence of these control variables.Footnote 15
Another potential limitation of our findings is that all of the groups involved in our measures of cultural outgroup antipathy—gays and lesbians, welfare recipients, illegal immigrants, and atheists—tend to be associated with the political left and are viewed with suspicion primarily by people on the political right. There are, of course, other groups whose distinctive beliefs and activities place them outside of the mainstream of American secular culture, but that tend to be associated more with the political right. For example, Bolce and De Maio (Reference Bolce and De Maio1999, Reference Bolce and De Maio2008) uncover high levels of antipathy toward fundamentalist Christians and show that it emerges principally from political liberals. Other groups such as the Alt-Right, gun rights activists, and Tea Party members also may be viewed as outgroups by the American mainstream but may be objects of antipathy primarily from people on the political left. Just as support for Muslim candidates is structured by cultural outgroup antipathy, support for political candidates from these “outgroups” also may be shaped by an aversion to and tolerance for cultural outgroups.
It is probably unlikely that the same complex of group attitudes structures reactions to candidates from outgroups of the political left and right. Rather, just as the literature on authoritarianism has distinguished between “right-wing authoritarianism” (Altemeyer Reference Altemeyer1988) and authoritarianism associated more with the political left (Lipset Reference Lipset1959), there may be clusters of both “left-wing cultural outgroup antipathy” and “right-wing cultural outgroup antipathy” within the mainstream of American society. Unfortunately, we did not ask respondents to our CCES modules to rate outgroups associated with the political right and so cannot examine the relationship between hostility toward these groups and support for Muslim candidates or any other type of candidates. However, future research should examine the relationship between antipathy toward left-wing and right-wing outgroups, whether there is any overlap between tolerance for and aversion to the two sets of groups, and how each type of antipathy shapes support for candidates from different outgroups.
Our findings have some broader implications for American politics. First, while relatively few political candidates are themselves Muslim, many more may be connected to Islam in the public's mind. This might occur through a candidate having personal ties to Islam or counting Muslims among their prominent supporters. It also might result from a candidate being particularly critical of the Islamic faith, of Muslim-majority countries, or of Muslims in general—much as some Republican congressional and presidential candidates recently have been. When such positive or negative associations with Islam exist, voters’ reactions will be shaped heavily by a generalized aversion to cultural outgroups, and those reactions will have electoral consequences.