INTRODUCTION
Measurements of the mass of carbon in samples, standards, and blanks are used for radiocarbon (14C) blank corrections, sample preparation, quality control, age determinations, source apportionment calculations, geochemical interpretations, and splitting of aliquots for complementary measurements (e.g., δ13C) (e.g., Reimer et al. Reference Reimer, Baillie, Bard, Bayliss, Beck, Bertrand, Blackwell, Buck, Burr and Cutler2004, Reference Reimer, Baillie, Bard, Bayliss, Beck, Blackwell, Bronk, Buck, Burr and Edwards2009, Reference Reimer, Bard, Bayliss, Beck, Blackwell, Ramsey, Buck, Cheng, Edwards and Friedrich2013; Beaupré et al. Reference Beaupré, Druffel and Griffin2007, Reference Beaupré, Mahmoudi and Pearson2016; Shah Walter et al. Reference Shah, Gagnon, Roberts, McNichol, Gaylord and Klein2015). These masses are commonly and conveniently determined manometrically because nearly all samples, standards, and blanks are converted to CO2 gas prior to graphitization and/or 14C measurements. This is accomplished by applying an appropriate equation of state to determine the number of moles (n) of C from measurements of temperature (T) and the pressure (P) exerted by CO2 in a container of known volume (V; a “cold-finger,” “measuring volume,” “calibrated volume,” etc.). Consequently, manometric measurement uncertainties depend on the magnitudes and uncertainties of P, T, V, and additional parameters from the equation of state (e.g., virial coefficients). Whereas the accuracy and precision of P and T are largely limited by instrumentation and the uniformity of ambient conditions (e.g., T, humidity) (Hyland and Shaffer Reference Hyland and Shaffer1991), the accuracy and precision of cold-finger volume measurements can be improved through experimental design. Previous reports (e.g., Rees and Ross Reference Rees and Ross1964) recognized the importance of system design, such as flask pairing, in minimizing the variance of gas quantity measurements and subsequent calculations. However, most of these works took the variance in manometer flask size as a constant, thus ignoring the influence of system design and determination procedures on the relative uncertainty of cold-finger volume measurements. Therefore, optimizing the procedure for measuring cold-finger volumes is potentially a practical, low-cost approach to improve the precision of manometric measurements and the ability to answer scientific questions.
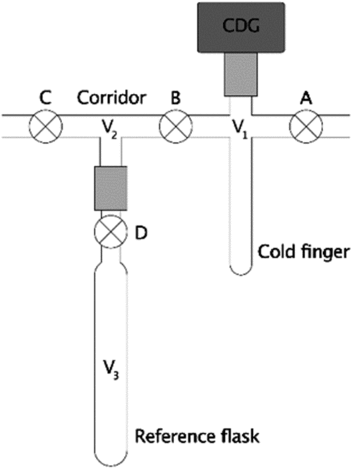
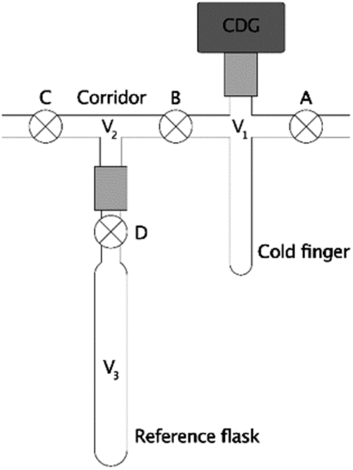
Frequently, manometric systems use capacitance diaphragm pressure gauges (CDG’s) because they are relatively affordably high-precision pressure sensors (Hamme and Emerson Reference Hamme and Emerson2004; Beaupré et al. Reference Beaupré, Druffel and Griffin2007, Reference Beaupré, Mahmoudi and Pearson2016; Leigh McCallister and del Giorgio Reference Leigh and del Giorgio2008; Shah Walter et al. Reference Shah, Gagnon, Roberts, McNichol, Gaylord and Klein2015; Gospodinova et al. Reference Gospodinova, McNichol, Gagnon and Shah2016). However, cold-finger volumes cannot be determined gravimetrically with liquids of known density because the attached CDG’s are sensitive electronic instruments held in a fixed position on the vacuum line (Figure 1). Instead, two common procedures for measuring this volume (V1) include cryogenic transfer or a series of gas expansions (2018, emails from Ellen R. M. Druffel and Ann P. McNichol to the authors; unreferenced, see “Acknowledgements”) between V1 and a reference flask of known volume (V3) through a corridor (V2). Therefore, we performed numerical simulations and error propagation of these two methods to determine whether the cold-finger volume uncertainties could be minimized through proper experimental design. Since the ultimate purpose of these tests is to minimize manometric uncertainty for 14C-based studies, we then performed simple calculations to determine the ranges of moles of CO2 that can be measured at the highest precision for different cold-finger volumes. Finally, we demonstrate the effects of these uncertainties on 14C applications, such as simple conservative mixing calculations.
Section of a typical vacuum line assembly. The system consists of a cold-finger (V1), corridor (V2), reference flask of known volume (V3), valves (⊗; labeled A, B, C, and D), a pressure gauge (dark gray rectangle), and Ultra-Torr vacuum fittings (light gray rectangles) to connect some components.
METHODS
It is well known that precise temperature control will improve determinations of V1. However, three other common but often overlooked errors can arise.
First, the volumes in Figure 1 can change upon the actuating valves—most significantly, for example, when using high-vacuum glass valves seated with compressible o-rings. This error can be reduced by carefully defining the volumes with reproducible valve stem positioning, or virtually eliminated by instead using lightly-greased tapered glass stopcocks (e.g., Chemglass Cat. No. CG-473) or similarly flat-seated metal valves. Henceforth, our analyses assume manometric systems with tapered glass stopcocks that render this error negligible.
Second, the CDG sensing element is a capacitor with one plate that deflects when pressurized, effectively changing the volume of the cold-finger. Therefore, if warranted by measurement uncertainties, the most general determination should quantify V1 at the CDG equilibrium position (i.e., V1 = V1,o at P = 0 Torr) and parameterize the additional pressure-dependent volumes created when the diaphragm is deflected (V1 = V1,o + ΔV1(P); Supplementary Materials).
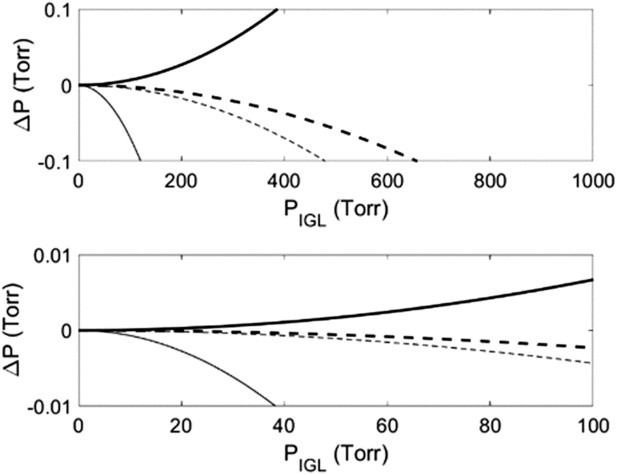
Third, although the ideal gas law (“IGL,” PV = nRT) is commonly used to determine V1, measurable errors can arise if deviations from ideality exceed the increment of the pressure gauge (Figure 2; Supplementary Materials). More accurate results can be obtained with the truncated virial equation (VE), which is widely used for its accuracy and simplicity (Poling et al. Reference Poling, Prausnitz and O’Connell2001). It can be expressed as PV = nRTZ, where the compressibility factor (Z) is a series expansion in pressure or molar volume often truncated at the second term (e.g.,
 ${\rm {Z}} \approx 1 + {\rm {BP}}/{\rm {RT}}$
), and the second virial coefficient (B) is a characteristic property of each gas at a given T. For example, pressures of the four gases commonly used to determine V1 (He, N2, CO2, and dry air) deviate from those predicted with the ideal gas law by an amount exceeding the 0.1 Torr increment of a 999.9 Torr full-scale CDG at P > ∼600 Torr in a 15 cm3 cold-finger at 298.15 K (Figure 2a; Supplementary Materials). In contrast, only CO2 deviates more than the 0.01 Torr increment of a 99.99 Torr full-scale CDG (Figure 2b). Accordingly, we used the virial equation in all simulated V1 determinations but recommend the ideal gas law for error propagation and manometry at pressures where deviations are negligible (Figure 2).
Deviations in calculated pressures from ideality (ΔP = PVE – PIGL) of four gases (He = bold solid line, N2 = bold dashed line, dry air = thin dashed line, CO2 = thin solid line) over a range of pressures commonly measured on commercially available capacitance diaphragm gauges with measurable increments of (a) 0.1 Torr on a 999.9 Torr full-scale CDG and (b) 0.01 Torr on a 99.99 Torr full-scale CDG. Pressures were calculated for V1 = 15 cm3, T= 298.15 K, and B(T)’s of 12.44 cm3 mol–1, –4.3 cm3 mol–1, −127 cm3 mol–1 and −8.0885 cm3 mol–1 for He, N2, CO2, and dry air, respectively (Supplementary Materials, Figure S-1).

Serial Gas Expansion Method
In this method, equilibrium pressures (P1, P12, P123) and temperatures (T1, T12, T123) are measured during a series of gas expansions from the cold-finger (V1) into successively larger volumes (V12 = V1 + V2, then V123 = V1 + V2 + V3). The largest volume (V123) includes a clean, dry reference flask (V3) whose volume was previously determined gravimetrically with pure water (Figure 1). First, the system (V1, V2, and V3) is thoroughly heated and evacuated (P ≤ 10 mTorr) to remove all gases and residual water. After cooling to ambient temperature, valves B, C, and D are closed, the CDG is zeroed, and the cold-finger (V1) is filled with dry gas via stopcock A (additional vent not shown). The equilibrium pressures and temperatures are measured after closing valve A (P1, T1, for V1), again after expanding this gas into the corridor via valve B (P12, T12, for V12), and lastly after expanding into the reference flask via valve D (P123, T123, for V123). In the absence of leaks (real or virtual), surface attachment, or other artifacts, the number of moles of gas (n) remains constant during each expansion and the cold-finger volume (V1) can be calculated via the truncated virial equation (Supplementary Materials). If T1 ≈ T12 ≈ T123 and changes in volume due to diaphragm deflections are negligible, then V1 is readily calculated via Eq. (1), where Z1 = 1 when the ideal gas law applies, or
 ${Z_1} = 1 + BP{\left( {R{T_1}} \right)^{ - 1}}$
when it does not (B is a function of T1); otherwise, it should be calculated via Eq. (S-7) (Supplementary Materials).
 $${V_1} = {1 \over {{P_1}}}{\left( {{1 \over {{P_{123}}}} - {1 \over {{P_{12}}}}} \right)^{ - 1}}{V_3}{Z_1}$$
Cryogenic Transfer Method
Cryogenic transfer refers to the direct transfer of a condensable gas from the reference flask (V3) to the cold-finger (V1) using a cryogenic bath (Figure 1). This process eliminates measurements involving the corridor (P12, T12) with the potential for reducing uncertainty when calculating V1. CO2 is convenient for this method because it can be readily produced, dried, and condensed in a liquid nitrogen bath. However, CO2 deviates significantly from ideality at most pressures of interest (Figure 2) and requires a “real” equation of state for greatest accuracy.
First, the system (V1, V2, and V3) is heated and evacuated (P ≤ 10 mTorr) to remove all gases and residual water. After cooling to ambient temperature, valve C is closed, the pressure gauge is zeroed, and the system is filled with dry, condensable gas via valve A. Next, after closing valve A and thermally equilibrating, the pressure and temperature are measured (P3, T3, for V3), stopcock D is closed, and the gas in V1 and V2 is evacuated. Finally, the gas in the reference flask (V3) is cryogenically transferred into the cold-finger, A and B are closed, the cold-finger is warmed, and the pressure and temperature are measured (P1, T1, for V1). Assuming complete transfer, the absence of leaks (real or virtual), negligible surface attachment, etc., then the number of moles of gas (n) remains constant. If T1 ≈ T3 and changes in volume due to CDG diaphragm deflection are negligible, then V1 is readily calculated via Eq. (2); otherwise, it should be calculated via Eq. (S-21) (Supplementary Materials).
 $${{\rm{V}}_1} = {{{P_3}{Z_1}} \over {{P_1}{Z_3}}}{V_3}$$
Uncertainty Estimations
The uncertainties of measurements used in Eq. (1) or (2) propagate non-linearly to the total uncertainty of V1. This suggests the relative uncertainty on V1 can be minimized with an appropriate gas, optimal initial pressure, and/or optimal reference flask volume (V3). The influence of a gas choice on the uncertainty is easily reduced by choosing one with a compressibility factor that is least sensitive to pressure and temperature over the range of observed values (Figure 2, Figure S-1, and Supplementary Materials). The influences of V3 and initial pressures are not as easily found. Therefore, we searched for optimal V3’s and initial pressures with numerical simulations using the virial equation and normally-distributed random noise added to each simulated measurement (MATLAB code available in Supplementary Materials). We also searched for optimum conditions analytically by propagating uncertainties as single standard deviations (σi) with Taylor series approximations of the ideal gas law (Bevington and Robinson Reference Bevington and Robinson2002).
Simulated pressure measurements were based on two low-cost, commercially available CDGs commonly used for manometry in 14C sample preparation laboratories: MKS Instruments’ Baratron 626C13TAD (0.0–999.9 Torr range, 0.1 Torr increment) and Baratron 626C12TAD (0.00–99.99 Torr range, 0.01 Torr increment). Both have reported uncertainties equal to their pressure increments or 0.15% of their readings, whichever is greater. Although the actual uncertainty of a population of CDG measurements is not strictly given by this specification, the relative uncertainties of pressure measurements can be reasonably approximated by a piecewise continuous function with a cusp at
 ${P_{cusp}} \equiv increment/0.0015$
(2018, email from Dick Jacobs to the authors; unreferenced, see “Acknowledgements”). Therefore, we coded the relative uncertainty of pressure measurements according to Eq. (3).
 $${{{\sigma _P}} \over P} = \left\{ {\matrix{ {0.0015,P \ge {P_{cusp}}} \cr {{{{P_{increment}}} \over P},P{\rm{ \lt }}{P_{cusp}}} \cr } } \right.$$
Reference flask volumes (V3) were assumed to have been measured gravimetrically with pure water. The uncertainty in water mass was based on a typical laboratory balance (Metler Toledo XS304, σm = 0.1g) and assumed constant over the range of simulated V3’s. Relative uncertainties in water density due to uncertainty in T measurements were assumed negligible compared to relative uncertainties of mass. Thus, relative uncertainties of V3 were coded as
 ${{{\sigma _{{V_3}}}} \over {{V_3}}} = {{{\sigma _{{m_3}}}} \over {{m_3}}}$
for ρwater = 0.9970470 g cm−3 at T = 298.15 K (Rumble Reference Rumble2018).
Serial gas expansions were simulated in MATLAB over a range of cold-finger and corridor volumes typically encountered in sample preparation laboratories for 14C analyses. These simulations were based on expansions of dry air because it exhibits small deviations from ideality (nearly the same as N2; Figure 2) and is conveniently available to all laboratories equipped with drying tubes. First, a matrix of exact values of V1 (1–31 cm3; 1 cm3 increment), V2 (0–49 cm3; 1 cm3 increment), and V3 (0.1–500.1 cm3; 0.5 cm3 increment) were prescribed for a total of 31×50×1001 = 1,551,550 sets of virtual manometric systems with reference flasks. These cold-fingers volumes (V1) were chosen because they fall within a range routinely used to measure sample masses with 999.9 Torr full-scale CDG’s in the range required for graphite sputter ion source AMS (10 to 1000 μg C as CO2). Likewise, the simulated corridor volumes chosen were also routinely found on sample prep lines. Finally, the range of simulated reference flask volumes were chosen based on the minimum and maximum volumes that can be quantified gravimetrically on a typical laboratory balance. In addition, preliminary uncertainty calculations suggested that larger reference flasks are neither practical nor necessary for achieving the best precision measurements of V1. For each set of volumes, exact values of P12 and P123 were calculated from a range of starting pressures (P1) at a typical laboratory temperature (T1 = 298.15 K) using the virial equation of state. We then simulated 1000 replicate determinations of V1 for each set by adding normally distributed random noise to each value of P1, P12, P123, and V3. The average V1 and standard deviation (
 ${\sigma _{{V_1}}}$
) for each set of volumes were calculated, along with covariances between pressures and volumes. Finally, we identified the optimum reference flask volume (e.g., compression ratio = V3/ V1) that yielded the lowest relative uncertainties for each V1 (i.e.,
 ${{{\sigma _{{V_1}}}} \over {{V_1}}}$
). The mean values of simulated V1’s were equal to the prescribed values within uncertainty and had normally distributed standard deviations (Figure S-3; Supplementary Materials). This indicated that the uncertainties were symmetric and could be treated as single standard deviations during subsequent manometric analyses.
Numerical simulations of cryogenic transfers were similar to those of serial gas expansions, except that compression during transfer from a larger V3 to a smaller V1 dictated a smaller range of initial pressures and V3’s (Figure 3, top row) to prevent the final pressure from exceeding the range of the gauge. Correspondingly, these simulations used the “larger” 999.9 Torr full-scale CDG.
Examples of relative uncertainties on V1 from cryogenic transfers (top row) and serial gas expansions (bottom row) vs. V3 for cold-finger volumes (V1) equal to 5 cm3 (a and d), 15 cm3 (b and e), and 25 cm3 (c and f), assuming initial pressures of 50.0 Torr (light gray points), 66.7 Torr (black points), or 76.0 Torr (dark gray). T = 298.15K, B(T) = −127 cm3 mol−1 for CO2 and −8.0885 cm3 mol−1 for dry air (Supplementary Materials, Figure S-1), and V2 = 0 cm3. Cryogenic transfers and serial gas expansions were simulated with 999.9 Torr and 99.99 Torr full-scale CDGs, respectively. Cryogenic transfer results are shown for V3’s with measurable final pressures (≤ 999.9 Torr), and therefore do not necessarily extend over the full range of V3.

RESULTS AND DISCUSSION
The relative uncertainties on all V1’s determined by cryogenic transfer of CO2 decreased asymptotically to ∼0.0020 with increasing reference flask volumes (Figure 3, top row). If V3 > ∼100 cm3, V1 > ∼7 cm3 (i.e., 100 cm3 × (66.7 Torr / 1000 Torr)), and the initial pressure was larger than Pcusp (66.7 Torr on the 999.9 Torr full-scale CDG), then the relative uncertainty was independent of reference flask volume and initial pressure. This insensitivity is reasonable because, in this range, all pressure measurements exhibit constant relative uncertainties (Eq. (3)), CO2 exhibits small deviations from ideality (ZCO2 = 0.9932 at 298.15 K and 1000 Torr), and the relative uncertainty of V3 is independent of pressure measurements (Eq. S-27; Supplementary Materials). In addition, the minimum relative uncertainties on V1 were independent of the volume of V1 (Figure 4c.i). The corresponding optimum compression ratios were not clearly identifiable (Figure 4c.ii), consistent with the results shown in Figure 3 (top row). However, the optimum compression ratio (V3/V1) must be less than ∼15 under the conditions studied here to prevent CO2 with a minimum initial pressure = Pcusp (66.7 Torr) from exceeding the CGD’s maximum measurable pressure (999.9 Torr) after transfer to V1.
Numerically simulated minimum relative uncertainties of V1 (Top row, circles) and optimum compression ratios (bottom row, black circles) as a function of V1 measured under three different scenarios: serial gas expansions with the 99.99 Torr full-scale CDG and initial pressure = 76 Torr (a.i and a.ii), serial gas expansions with the 999.9 Torr full-scale CDG and initial pressure = 760 Torr (b.i and b.ii), cryogenic transfer with the 999.9 Torr full-scale CDG and initial pressure = 66.7 Torr (c.i and c.ii). All simulations are shown with least-squares fits to empirical power functions (black dashed lines; see text). The circle sizes in the bottom row correspond to the magnitude of the minimum σV1/V1 from panels in the top row. Gray lines and dots in (a.i) and (a.ii) are results derived analytically by uncertainty propagation with Taylor series approximations for the case where V2 = 0 cm3 (dark gray) and V2 = 5 cm3 (light gray).

In contrast, the relative uncertainties for all V1 determinations by serial gas expansion exhibited clearly identifiable minima with respect to reference flask volumes, regardless of initial pressure (Figure 3, bottom row). Larger cold-fingers exhibited slightly lower minima that were also broader and associated with larger “optimal” reference flask volumes. Combined, these results suggest that the highest precision measurements of V1 can be achieved on larger cold-fingers without the need for a precisely optimized reference flask volume. However, the relative uncertainties were asymmetric functions of V3 that were most sensitive to reference flasks with volumes smaller than the optimum. For example, 5 cm3, 15 cm3, and 25 cm3 cold-fingers had simulated minimum achievable relative uncertainties of 0.0028, 0.0022, and 0.0021 when measured with optimally-sized reference flasks (58 cm3, 145 cm3, and 252 cm3, respectively), and a starting pressure of 76 Torr (Figure 3d, e, f). If, instead, they were all measured with the same non-optimally-sized 30 cm3 reference flask, then the minimum achievable relative uncertainties on these cold-finger volumes would increase by 46%, 95%, and 129% to 0.0041, 0.0043, and 0.0048, respectively. Therefore, we recommend choosing reference flasks with volumes that are equal to, or slightly larger than, the optimum volume for a given initial estimate of each cold-finger’s volume.
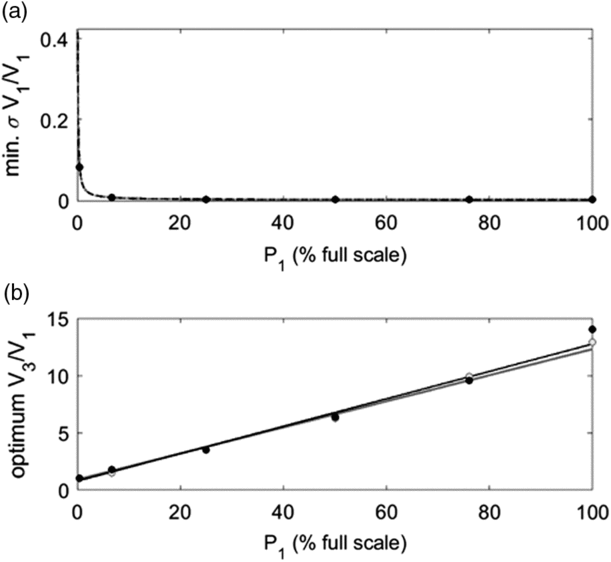
The minimum relative uncertainties of V1 determined by serial gas expansion (e.g., the minima in Figure 3, bottom row) decreased asymptotically with increasing starting pressure (
 ${{{\sigma _{{V_1}}}} \over {{V_1}}} = (0.0398 \pm 0.0001){P_1}^{( - 1.02 \pm 0.01)} + (0.00172 \pm 0.00005)$
, r2 = 1; Figure 5). This relationship was identical for both CDG’s when expressing pressure as a percentage of full-scale. For example, relative uncertainties on a 15 cm3 cold-finger were largely independent of starting pressures greater than ∼50% full-scale, reaching a minimum of ∼0.0020 at 100% full-scale (Figure 5a). Since higher initial pressures will not significantly improve relative uncertainties, it is both convenient and effective to determine V1 with dry air at an initial pressure of ∼760 Torr (ambient pressure) for the 999.9 Torr full-scale CDG using an optimally sized reference flask (V3/V1 ≈ 10; Figure 4b). We likewise advocate determining V1 with an initial pressure of ∼76% full-scale on the 99.99 Torr gauge to minimize the risk of errors associated with measurements near the CDG’s upper limit.
(a) Minimum achievable relative uncertainties and (b) associated optimum compression ratios (V3/V1) as a function of initial pressure (P1, expressed as % full-scale reading) for serial gas expansions of dry air at 298.15 K, with B(T) = −8.0885 cm3 mol–1 (Supplementary Materials, Figure S-1), and V1 = 15 cm3. Results were calculated for the 99.99 Torr (black dots) and 999.9 Torr (gray dots) full-scale CDG’s. Least squares fits to empirical power and linear functions for the 99.99 Torr full-scale CDG (black lines) and the 999.9 Torr full-scale CDG (gray lines).

Unlike the cryogenic transfer method, the minimum achievable relative uncertainties of V1 determined by serial gas expansion also depended on V1. For example, the minimum
 ${{{\sigma _{{V_1}}}} \over {{V_1}}}$
and optimum compression ratios decreased asymptotically to 0.0021 and ∼10, respectively, with increasing V1 up to 30 cm3 for initial pressures equal to 76% of the full-scale reading and V2 = 0 cm3 (Figure 4a’s and b’s). This limit on the relative uncertainty was nearly achievable for all V1 exceeding ∼12 cm3 on both CDG’s. Nevertheless, a cold-finger equipped with the 99.99 Torr full-scale CDG precludes the need for the virial equation in V1 determinations (Z = 1 in Eq. (1); Figure 2) and potentially has greater sensitivity and lower detection limits during routine manometric measurements.
Finally, the presence of a corridor (V2 > 0 cm3) necessarily increases the minimum achievable relative uncertainty by virtue of an additional measurement (e.g., Eq. S-18). Therefore, if so required, the absolute minimum achievable relative uncertainty could be obtained by permanently welding an optimally-sized reference flask directly to each cold-finger (i.e., V2 = 0 cm3), to permit redeterminations of V1 following repairs or off-site CDG calibrations. However, the additional relative uncertainty of V1 due to the presence of a small corridor is negligible compared to a system without a corridor (Figure 4a’s). This is supported by the partial derivatives of Eq. (1) where a small corridor and large compression ratio minimizes the weight of uncertainty from P12 on V1 (Supplementary Materials, Eq. S-15). Therefore, we recommend using a small corridor in a manometric system, if possible, for its convenience in replacing, repairing, and testing various reference flasks and cold-fingers.
Collectively, optimized serial gas expansions with dry air are an effective, simple, low-cost, and safe method for determining cold-finger volumes. The method only requires a properly sized flask, a desiccant, and basic knowledge of vacuum manipulations and associated hazards (Shriver and Drezdzon Reference Shriver and Drezdzon1986). An analyst can use empirical fits to our simulated data (Figure 4a’s and b’s), such that V3,optimum = (V3/V1)opt ×V1,estimated) and initial estimates of cold-finger volumes (based on design parameters) to determine the optimal reference flask volumes and predict the ensuing minimum relative uncertainty on V1 when using these, or comparable, CDGs.
 $${\left( {{{{V_3}} \over {{V_1}}}} \right)_{opt.}} = 20.8V_1^{ - 1.0} + 8.95$$
 $${\left( {{{{\sigma _{{V_1}}}} \over {{V_1}}}} \right)_{min.}} = 0.003478V_1^{ - 0.8094} + 0.001844$$
For systems that use a different CDG, an analyst may input the associated uncertainty function into our MATLAB code (Supplementary Materials) to estimate the minimum relative uncertainties on their cold-fingers and the optimum sizes of the reference flasks required to achieve them.
The ultimate purpose of optimizing V1 measurements is to improve the precision of P-V-T measurements of moles of carbon (n). When the ideal gas law applies (Figure 2), the relative uncertainty of gas mole measurements (
 ${{{\sigma _{\rm{n}}}} \over {\rm{n}}}$
) can be calculated with Eq. (6).
 $${{{\sigma _{\rm{n}}}} \over {\rm{n}}} = \sqrt {{{\left( {{{{\sigma _P}} \over P}} \right)}^2} + {{\left( {{{{\sigma _{{V_1}}}} \over {{V_1}}}} \right)}^2} + {{\left( {{{{\sigma _T}} \over T}} \right)}^2}} $$
Assuming the volume of a cold-finger fitted with either of these CDGs is measured with an optimally sized reference flask and the temperature is stable, then variations in the relative uncertainty as a function of n will depend on the relative uncertainty of pressure (Eq. (3)) for any fixed V1. Additionally, the minimum achievable relative uncertainty of n will be relatively constant for all V1 exceeding ∼12 cm3 on both CDG’s (∼0.0026 to ∼0.0027, Figure 6) because
 ${{{\sigma _{{V_1}}}} \over {{V_1}}}$
varies little for all V1 in this range (Figure 4a.i). Therefore, the optimum choice of V1 for any application depends on the sample sizes (moles of CO2) that will be routinely measured (Figure 6). Samples that generate pressures below Pcusp will significantly increase the relative uncertainty of P, while pressures exceeding the applicability of the ideal gas law will impart errors unless a more realistic equation of state is used. Accordingly, the optimum V1 for a given application should be chosen so that, when the routine number of moles of CO2 is isolated in the cold-finger, the pressure at room temperature should be 6.67 to 38.26 Torr for 99.99 Torr full-scale CDG, and 66.7 to 120.9 Torr for 999.9 Torr full-scale CDG. For example, samples ranging from ∼1.8 to ∼10.3 µmol are best measured with a 99.99 Torr full-scale CDG and a 5 cm3 cold-finger, from ∼5.4 to ∼30.9 µmol with a 15 cm3 cold-finger, and from ∼9.0 to ∼51.4 µmol a 25 cm3 cold-finger (Figure 6, top row, gray shaded areas). Likewise, samples ranging from ∼17.9 to ∼32.5 µmol are best measured with a 999.9 Torr full-scale CDG and a 5 cm3 cold-finger, from ∼53.8 to ∼97.5 µmol with a 15 cm3 cold-finger, and from ∼89.7 to ∼162.6 µmol a 25 cm3 cold-finger (Figure 6, bottom row, gray shaded areas). Based on these results, an apparatus that routinely generates ∼1 mg C for routine 14C analyses can be measured most precisely with the 999.9 Torr CDG fixed to an optimally measured ∼15 cm3 cold-finger.
Minimum achievable relative uncertainty of moles of CO2 (σn/n) as a function of moles of CO2 (n) from simulated measurements with the 99.99 Torr full-scale (top row) and 999.9 Torr full-scale (bottom row) CDGs and cold-finger volumes (V1) equal to 5 cm3 (a and d), 15 cm3 (b and e), and 25 cm3 (c and f). The relative uncertainties were calculated with the ideal gas law, assuming each V1 was calibrated optimally, T = 298.15 K, and σT = ± 0.1 K. The relative uncertainties (solid lines) were calculated for n’s with measurable final pressures (≤ 100% full-scale of CDG’s), and therefore do not extend across the n axis. Gray shaded areas span the ranges of n that can be measured with the lowest relative uncertainties and minimal errors using the ideal gas law.

Hence, optimized V1 measurements are most important for direct measurements of the yields of routine radiocarbon standards, blanks, and samples (Schuur et al. Reference Schuur, Druffel and Trumbore2016), as well as measurements of the absolute number of 14C atoms in special applications (Roberts and Southon Reference Roberts and Southon2007). For example, optimization reduces the relative uncertainty of manometric experimental yields (
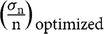 ${\left( {{{{\sigma _{\rm{n}}}} \over {\rm{n}}}} \right)_{{\rm{optimized}}}}$
= 0.0026 to 0.0027) to nearly those of gravimetric theoretical yields of 1 mg C from IAEA sucrose (∼0.0042) or Oxalic acid (∼0.0019) using a typical balance (± 0.01 mg). The influence of manometric uncertainty on 14C analyses depends on the property that is to be calculated. For example, the 14C signature of one component in a mixture (Δ14C1) can be calculated from the moles and Δ14C values of the mixture (nmix, Δ14Cmix) and of the other component (n2, Δ14C2), such as a blank (Eq. (7)).
 $${\Delta ^{14}}{C_1} = {{{\Delta ^{14}}{C_{mix}}{n_{mix}} - {\Delta ^{14}}{C_2}{n_2}} \over {{n_{mix}} - {n_2}}}$$
Hence the uncertainty of the Δ14C1 (
 ${{\rm {\sigma }}_{{\Delta ^{14}}{C_1}}}$
) can be calculated as Eq. (8).
 $${\sigma _{{\Delta ^{14}}{C_1}}} = \sqrt {{{\left( {{{\partial {\Delta ^{14}}{C_1}} \over {\partial {\Delta ^{14}}{C_{mix}}}}} \right)}^2}\sigma _{{\Delta ^{14}}{C_{mix}}}^2 + {{\left( {{{\partial {\Delta ^{14}}{C_1}} \over {\partial {\Delta ^{14}}{C_2}}}} \right)}^2}\sigma _{{\Delta ^{14}}{C_2}}^2 + {{\left( {{{\partial {\Delta ^{14}}{C_1}} \over {\partial {{\rm{n}}_{{\rm{mix}}}}}}} \right)}^2}\sigma _{{{\rm{n}}_{{\rm{mix}}}}}^2 + {{\left( {{{\partial {\Delta ^{14}}{C_1}} \over {\partial {{\rm{n}}_2}}}} \right)}^2}\sigma _{{{\rm{n}}_2}}^2} $$
The partial derivatives in Eq. (8) represent how sensitive the uncertainty on the calculated value (
 ${{\rm {\sigma }}_{{\Delta ^{14}}{C_1}}}$
) is to each of the measured quantities, and are given by Eq. (9) to (12).
 $$\left( {{{\partial {\Delta ^{14}}{C_1}} \over {\partial {\Delta ^{14}}{C_{mix}}}}} \right) = {{{n_{mix}}} \over {{n_{mix}} - {n_2}}}$$
 $$\left( {{{\partial {\Delta ^{14}}{C_1}} \over {\partial {\Delta ^{14}}{C_2}}}} \right) = {{ - {n_2}} \over {{n_{mix}} - {n_2}}}$$
 $${{\partial {\Delta ^{14}}{C_1}} \over {\partial {{\rm{n}}_{{\rm{mix}}}}}} = \left( {{{\partial {\Delta ^{14}}{C_1}} \over {\partial {\Delta ^{14}}{C_2}}}} \right)\gamma $$
 $${{\partial {\Delta ^{14}}{C_1}} \over {\partial {{\rm{n}}_2}}} = \left( {{{\partial {\Delta ^{14}}{C_1}} \over {\partial {\Delta ^{14}}{C_{mix}}}}} \right)\gamma $$
where
 $\gamma = \left( {{\Delta ^{14}}{C_{mix}} - {\Delta ^{14}}{C_2}} \right)/\left( {{n_{mix}} - {n_2}} \right)$
. Based on these partial derivatives, the calculation will be most sensitive to manometric uncertainty when the mixture and the known component have a similar number of moles but significantly different Δ14C values (i.e., large γ). For example, 5.4 µmol of CO2 measured in a 15 cm3 cold-finger with the 99.99 Torr full-scale CDG would have a minimum relative uncertainty of ∼0.0027 (Figure 6) and a corresponding uncertainty of σn ≈ 0.01 µmol. If Δ14C values are routinely measured to better than ca. ± 5 ‰, then γ must be larger than approximately 500 in order for manometric uncertainty to dominate the calculation of
 ${\Delta ^{14}}{C_1}$
. However, if n was measured with a sub-optimal manometric system, such that
 ${{{\sigma _{{{\rm{V}}_1}}}} \over {{{\rm{V}}_1}}}$
= 0.0043 and
 ${{{\sigma _{\rm{n}}}} \over {\rm{n}}} = 0.0046$
, then γ would only have to be greater than ca. 300, making the calculation significantly more sensitive to manometric uncertainty. Therefore, this calculation would be less vulnerable to manometric uncertainties over a broader range of sample compositions if V1 were to be measured optimally. Similar sensitivity studies should be performed for all 14C calculations to optimize experimental designs.
CONCLUSIONS
Numerical simulations and analytical uncertainty propagation demonstrate that relative uncertainties of cold-finger volumes can be minimized through determinations with optimal reference flask volumes and initial pressures. The minimum achievable relative uncertainty of V1 by either of the two tested methods over the range of parameters studied here is ∼0.002. Optimized serial gas expansions are favored over cryogenic transfers for determining cold-finger volumes due to their convenience, despite marginally larger minimum achievable relative uncertainties (by ∼0.0001). Since the relative uncertainty of cold-finger volumes is insensitive to initial pressures greater than ∼50% full-scale, we advocate using serial gas expansions with dry air at ∼76% full-scale and choosing an optimum reference flask volume via Eq. (4). Furthermore, based on Eq. (5), the lowest relative uncertainty of cold-finger volume measurements (between 0.0021 and 0.0023) can be achieved using the smallest possible corridor (V2) with a cold-finger greater than or equal to ∼12 cm3. Under these conditions, the minimum achievable relative uncertainties correspond to absolute volume uncertainties that are slightly larger than the additional volumes created by CDG diaphragm deflections during V1 determinations. Therefore, the CDG deflection volumes may be safely ignored without significantly reducing accuracy.
If the manometric system is set up as recommended using comparable CDG’s, then the relative uncertainty of mole measurements will be minimized to between ∼0.0026 and ∼0.0027 (Figure 6). Likewise, 14C-based calculations will be less vulnerable to manometric uncertainties over a broader range of sample compositions if V1 is measured optimally. If higher precision is needed, then the manometric system could employ a higher precision pressure gauge and/or be housed in a temperature-controlled oven (Zhao et al. Reference Zhao, Tans and Thoning1997). However, if the higher precision gauge is a capacitance manometer, then determinations of V1 and subsequent manometric measurements must include corrections for volume changes due to diaphragm deflections, which can be parameterized as V = V1,o + ΔV(P), where V1,o is the volume of the cold-finger at 0 Torr and ΔV(P) ≈ (ΔVmax/Pmax) × P (see derivations in Supplementary Materials). Ultimately, all of these efforts to optimize cold-finger volume measurements are practical, low-cost approaches that could improve the precision of manometric measurements and our ability to answer scientific questions.
ACKNOWLEDGMENTS
This work was supported under NSF grant and a Minghua Zhang Early Career Faculty Innovation Award to S. R. Beaupré. We thank Dick Jacobs (MKS Instruments, Inc.), Ellen R. M. Druffel (University of California, Irvine), and Ann P. McNichol (Woods Hole Oceanographic Institution) for intellectual support, and two anonymous reviewers for helpful comments. The authors declare no competing financial interests.
SUPPLEMENTARY MATERIAL
To view supplementary material for this article, please visit https://doi.org/10.1017/RDC.2019.43