1 Introduction
At first sight, walls appear as the most relevant constituent of turbulence confined or limited by solid surfaces, and it seems natural to assume that they should be the source and organising agent of wall-bounded turbulence. Consequently, many efforts have been devoted to understanding the structure of turbulence in the presence of walls. Particularly interesting is the region within the so-called log layer (Coles & Hirst Reference Coles and Hirst1969), where most of the dissipation resides in the asymptotic limit of infinite Reynolds number (Marusic et al. Reference Marusic, Monty, Hultmark and Smits2013). The seminal work by Townsend (Reference Townsend1976) conceived the flow across the log layer as a self-similar population of eddies of different sizes attached to the wall and organised according to the remaining physical quantities once viscosity is neglected, i.e. the friction velocity and the distance to the wall. In the present work, we propose an extension of Townsend’s model where the length and velocity scales of the momentum-carrying eddies are controlled by the turbulent energy production rate without any direct reference to the distance to the wall.
In addition to Townsend’s attached-eddy model (Townsend Reference Townsend1976) and subsequent refinements by Perry & Chong (Reference Perry and Chong1982), Meneveau & Marusic (Reference Meneveau and Marusic2013) and Agostini & Leschziner (Reference Agostini and Leschziner2017), among others (for a comprehensive review, see Marusic & Monty Reference Marusic and Monty2019), the presence of walls is key for many low-order models and theories aiming to understand the outer-layer dynamics. In the hairpin packet model (Adrian, Meinhart & Tomkins Reference Adrian, Meinhart and Tomkins2000), arch-like eddies are created at the wall and migrate away from it, although other theories advocate for the opposite scenario of larger eddies creating top-down effects (Hunt & Morrison Reference Hunt and Morrison2000). Alternative models by Davidson, Nickels & Krogstad (Reference Davidson, Nickels and Krogstad2006) and Davidson & Krogstad (Reference Davidson and Krogstad2009) do not require wall-attached eddies but still rely on the distance to the wall as a fundamental scaling property of the flow. The aforementioned proportionality of the sizes of eddies with the wall-normal distance was originally hypothesised as an asymptotic limit at very high Reynolds numbers and used in the classical derivation of the logarithmic velocity profile (Prandtl Reference Prandtl1925; Millikan Reference Millikan, Hartog and Peters1938) and later iterations (Rotta Reference Rotta1962; Coles & Hirst Reference Coles and Hirst1969; Wosnik, Castillo & George Reference Wosnik, Castillo and George2000; Oberlack Reference Oberlack2001; Buschmann & Gad-el Hak Reference Buschmann and Gad-el Hak2003), but it has been observed experimentally and numerically in spectra and correlations at relatively modest Reynolds numbers in pipes (Morrison & Kronauer Reference Morrison and Kronauer1969; Perry & Abell Reference Perry and Abell1975, Reference Perry and Abell1977; Bullock, Cooper & Abernathy Reference Bullock, Cooper and Abernathy1978; Kim & Adrian Reference Kim and Adrian1999; McKeon et al. Reference McKeon, Li, Jiang, Morrison and Smits2004; Guala, Hommema & Adrian Reference Guala, Hommema and Adrian2006; Bailey et al. Reference Bailey, Hultmark, Smits and Schultz2008; Hultmark et al. Reference Hultmark, Vallikivi, Bailey and Smits2012) and in turbulent channels and flat-plate boundary layers (Tomkins & Adrian Reference Tomkins and Adrian2003; del Álamo et al. Reference del Álamo, Jiménez, Zandonade and Moser2004; Hoyas & Jiménez Reference Hoyas and Jiménez2006, Reference Hoyas and Jiménez2008; Monty et al. Reference Monty, Stewart, Williams and Chong2007; Vallikivi, Ganapathisubramani & Smits Reference Vallikivi, Ganapathisubramani and Smits2015; Chandran et al. Reference Chandran, Baidya, Monty and Marusic2017). In this framework, the mechanism by which eddies ‘feel’ the distance to the wall is through the no-transpiration boundary condition, i.e. impermeability.
Previous studies have also revealed that the outer flow can survive independently of the particular configuration of the eddies closest to the wall. The most well-known examples are the roughness experiments where properties of the logarithmic and outer layers remain essentially unaltered despite the fact that roughness modifies significantly the near-wall region (Nikuradse Reference Nikuradse1933; Perry & Abell Reference Perry and Abell1977; Jiménez Reference Jiménez2004; Bakken et al. Reference Bakken, Krogstad, Ashrafian and Andersson2005; Flores & Jiménez Reference Flores and Jiménez2006; Flores, Jiménez & del Álamo Reference Flores, Jiménez and del Álamo2007). The independence of the outer layer with respect to the details of the near-wall region was formulated by Townsend (Reference Townsend1976) in the context of rough walls, and it is usually referred to as Townsend’s similarity hypothesis. The numerical study by Chung, Monty & Ooi (Reference Chung, Monty and Ooi2014) assessed an idealised version of Townsend’s similarity hypothesis by introducing slip velocities parallel to the wall while still invoking the no-transpiration condition for the wall-normal velocity. Flores & Jiménez (Reference Flores and Jiménez2006) showed that the characteristics of the outer part of a channel flow remain unchanged when perturbing the velocities at the wall. Although transpiration at the wall was allowed, it was only for a selected set of wavenumbers and the wall was still perceived as impermeable by most of the flow scales. Mizuno & Jiménez (Reference Mizuno and Jiménez2013) performed computations of turbulent channels in which the wall was substituted by an off-wall boundary condition mimicking the expected behaviour from an extended log layer (and hence a wall), bypassing the buffer layer, with relatively few deleterious effects on the flow far from the boundaries.
Other works have pointed out that the main role of the wall is to maintain the mean shear and that the flow motions are created at all wall-normal distances independently of others (Lee, Kim & Moin Reference Lee, Kim and Moin1990; del Álamo & Jiménez Reference del Álamo and Jiménez2006; Flores & Jiménez Reference Flores and Jiménez2006; Mizuno & Jiménez Reference Mizuno and Jiménez2011; Jiménez Reference Jiménez2013; Lozano-Durán & Jiménez Reference Lozano-Durán and Jiménez2014b ; Dong et al. Reference Dong, Lozano-Durán, Sekimoto and Jiménez2017). In particular, Mizuno & Jiménez (Reference Mizuno and Jiménez2011) found that a mixing length based on the mean local shear is a better representation than the distance to the wall as characteristic length scale. Lee et al. (Reference Lee, Kim and Moin1990) revealed that streaky structures in homogeneous turbulence at high shear rates, in which there is shear but no walls, are similar to those observed in channels. Dong et al. (Reference Dong, Lozano-Durán, Sekimoto and Jiménez2017) further showed that there is indeed a smooth transition between the structures of homogeneous shear turbulence and the attached eddies of wall-bounded flows. Consistent with the previous idea, it was shown by Tuerke & Jiménez (Reference Tuerke and Jiménez2013) that even minor artificial changes in the mean shear can lead to significant modifications of the turbulence structure. A growing body of evidence also indicates that the generation of the log-layer eddies originates from the interaction with the mean shear via a linear lift-up effect (del Álamo & Jiménez Reference del Álamo and Jiménez2006; Hwang & Cossu Reference Hwang and Cossu2010; Moarref et al. Reference Moarref, Sharma, Tropp and McKeon2013; Alizard Reference Alizard2015), and Hwang & Bengana (Reference Hwang and Bengana2016) have further shown that attached log-layer eddies follow an individual self-sustaining process independently of the details of the surrounding scales.
Among the previous studies, the underlying tentative consensus is that most of the energy- and momentum-carrying eddies of the log layer are attached, in the sense that they span the full distance from the wall to their maximum height (Townsend Reference Townsend1961), and that they evolve independently of the details of the buffer-layer dynamics or even other scales. Recent surveys have been given by Adrian (Reference Adrian2007), Smits, McKeon & Marusic (Reference Smits, McKeon and Marusic2011) and Jiménez (Reference Jiménez2012), Jiménez (Reference Jiménez2018). However, the wall-normal distance remains a foundational element for most theories and models for wall turbulence, and the identification of the characteristic scales controlling momentum-carrying eddies consistent with a wall-independent formulation calls for further investigation. In the present work, we propose characteristic velocity, length and time scales of the momentum-carrying eddies (i.e. Townsend’s eddies) by assuming that they are predominantly controlled by the mean momentum flux and mean shear. A preliminary version of the work can be found in Lozano-Durán & Bae (Reference Lozano-Durán and Bae2019).
The paper is organised as follows. The new characteristic scales are presented in § 2. The proposed scaling is assessed in turbulent channel flows with modified mean momentum flux in § 3. The results show that the new scaling is satisfactory for the range of cases investigated. In § 4, we introduce turbulent channels where the no-slip walls are replaced by Robin boundary conditions for the three velocity components. In this new set-up, transpiration is allowed at the boundary, blurring the wall-normal reference imposed by the impermeable wall. We show that the one-point statistics, spectra and three-dimensional structure of the eddies responsible for the momentum transfer of a classic no-slip channel are identical to those obtained by replacing the wall by a Robin boundary condition. Finally, concluding remarks are made in § 5.
2 Scales controlling momentum-carrying eddies
We consider a statistically steady, wall-bounded turbulent flow confined between two parallel walls where
 $u_{i}$
, with
 $i=1,2,3$
, are the streamwise, wall-normal and spanwise velocities, respectively. The pressure is denoted by
 $p$
. The three spatial directions are
 $x_{i}$
, with
 $i=1,2,3$
, and the walls are located at
 $x_{2}=0$
and
 $x_{2}=2h$
, where
 $h$
is the channel half-height. The fluid is incompressible with density
 $\unicode[STIX]{x1D70C}$
and kinematic viscosity
 $\unicode[STIX]{x1D708}$
. We further assume that the flow is homogeneous in the streamwise and spanwise directions.
First, we briefly revisit the classic scaling by Townsend (Reference Townsend1976). The traditional argument for the characteristic velocity of eddies transporting tangential Reynolds stress is that their associated turbulence intensities equilibrate to comply with the mean integrated momentum balance
 $$\begin{eqnarray}\langle u_{1}u_{2}\rangle \approx u_{\unicode[STIX]{x1D70F}}^{2}\left(\frac{x_{2}}{h}-1\right),\end{eqnarray}$$
where the viscous effects have been neglected,
 $\langle \cdot \rangle$
denotes averaging in the homogeneous directions and time, and
 $u_{\unicode[STIX]{x1D70F}}$
is the so-called friction velocity defined as
 $u_{\unicode[STIX]{x1D70F}}=\sqrt{\unicode[STIX]{x1D70F}_{w}/\unicode[STIX]{x1D70C}}$
, where
 $\unicode[STIX]{x1D70F}_{w}$
is total wall shear stress. For a no-slip wall, the friction velocity reduces to
 $u_{\unicode[STIX]{x1D70F}}=\sqrt{\unicode[STIX]{x1D708}\unicode[STIX]{x2202}\langle u_{1}\rangle /\unicode[STIX]{x2202}x_{2}}|_{x_{2}=0}$
. Hence, the relevant velocity scale at all wall-normal distances is identified as
 $u_{\unicode[STIX]{x1D70F}}$
. Regarding the characteristic length scale, the classic theory states that the log-layer motions are too large to be affected by viscosity but small compared to the most restrictive boundary-layer limit
 $O(h)$
. It is argued then that the most meaningful length scale the log-layer eddies can be influenced by is the distance to the wall.
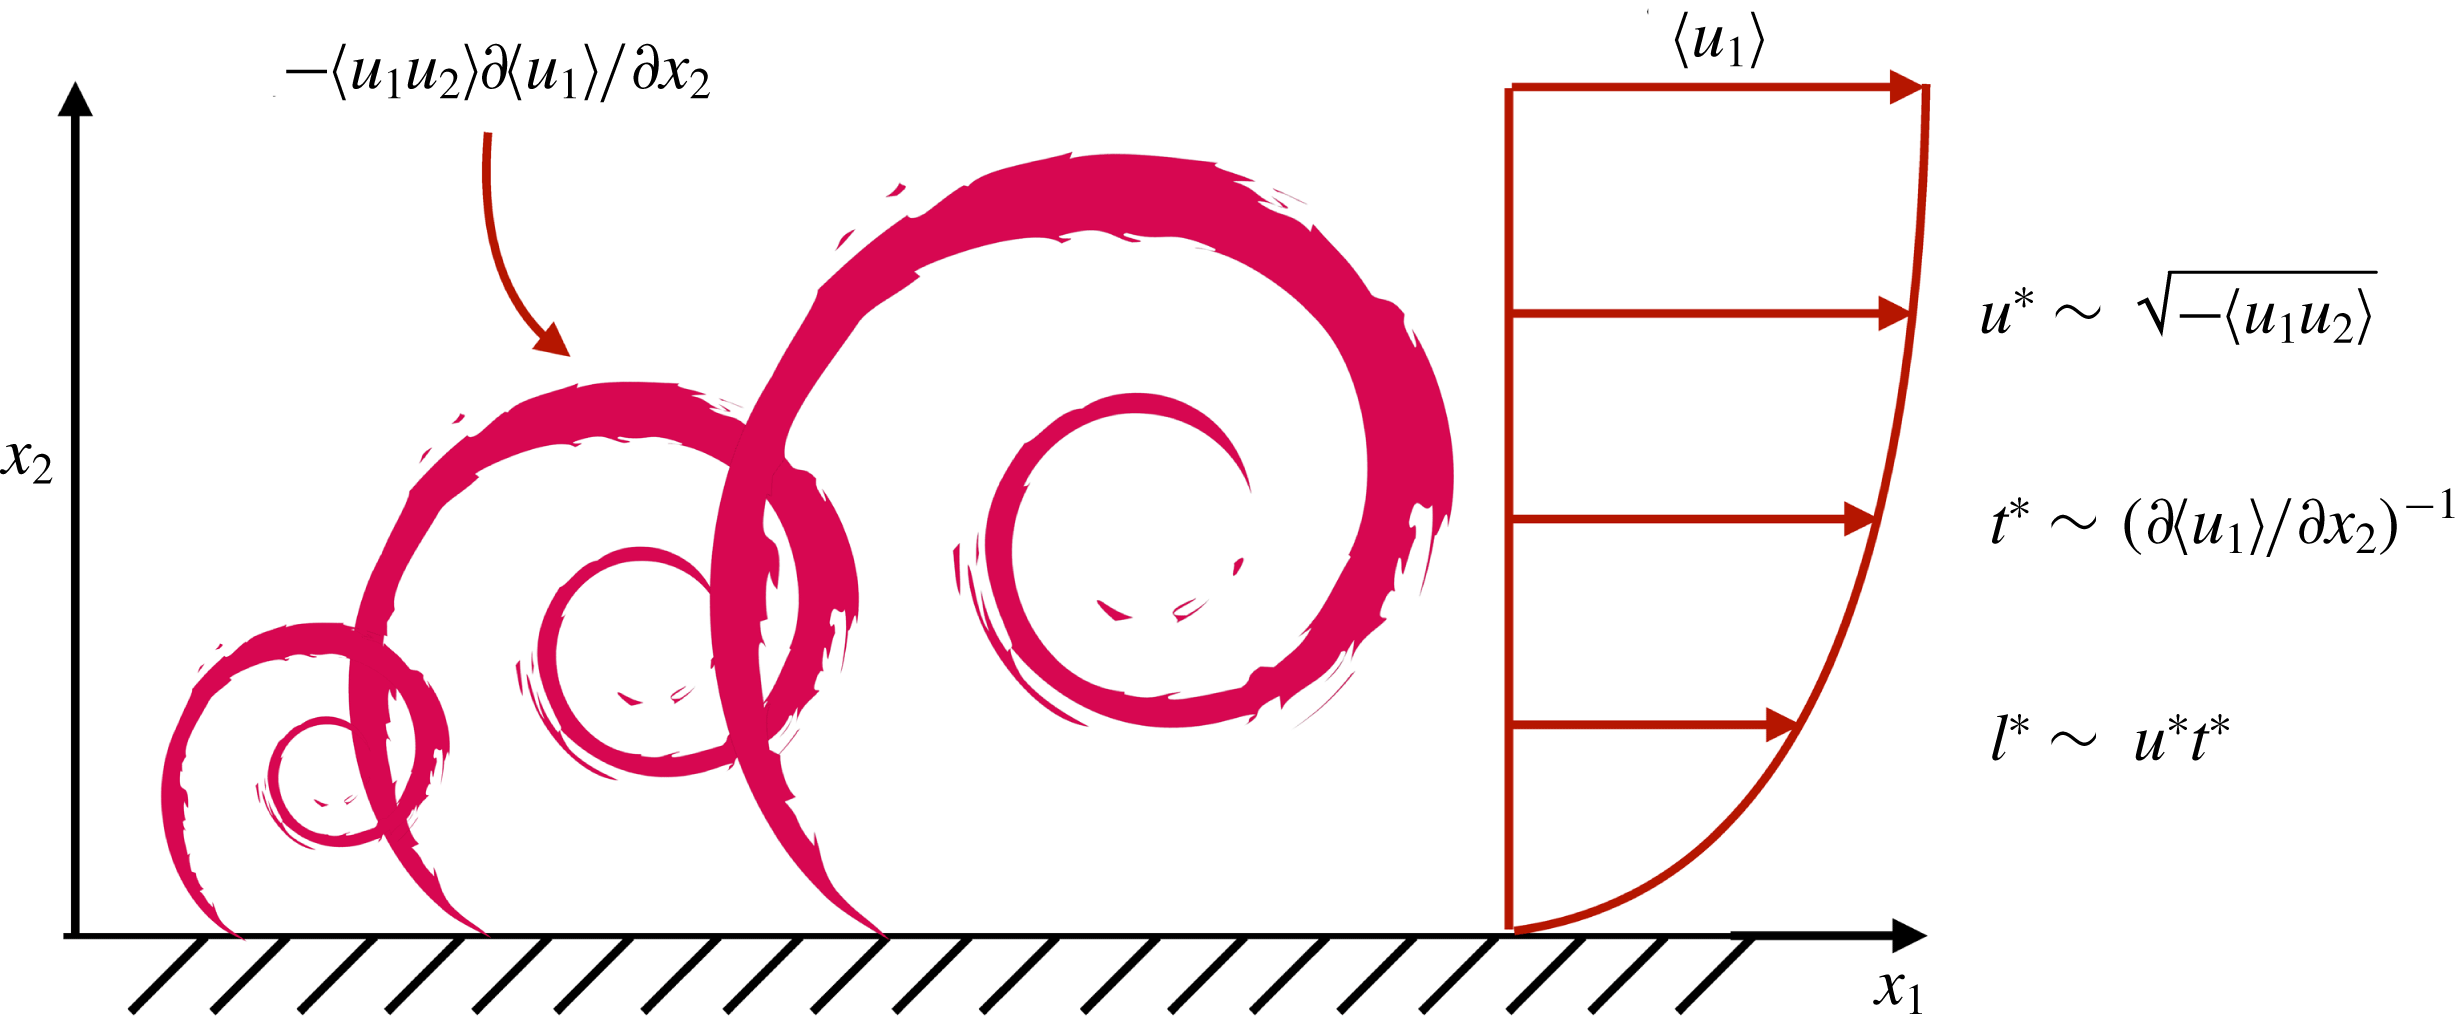
The hypothesis under consideration in the present work is that the wall is not the organising element of the momentum-carrying eddies, whose intensities and sizes are controlled instead by the mean production rate of turbulent kinetic energy, i.e. by the mean momentum flux
 $-\langle u_{1}u_{2}\rangle$
and associated mean shear
 $\unicode[STIX]{x2202}\langle u_{1}\rangle /\unicode[STIX]{x2202}x_{2}$
. The proposed characteristic length
 $l^{\ast }$
, time
 $t^{\ast }$
and velocity
 $u^{\ast }$
scales of wall-attached eddies are sketched in figure 1.
Sketch of wall-attached momentum-carrying eddies of different sizes in a turbulent boundary layer controlled by the mean production rate of turbulent kinetic energy,
 $-\langle u_{1}u_{2}\rangle \unicode[STIX]{x2202}\langle u_{1}\rangle /\unicode[STIX]{x2202}x_{2}$
, and proposed velocity
 $u^{\ast }$
, time
 $t^{\ast }$
and length
 $l^{\ast }$
scales.

The characteristic velocity scale proposed in the present work is dictated by the momentum flux
 $$\begin{eqnarray}u^{\ast }\equiv \sqrt{-\langle u_{1}u_{2}\rangle }.\end{eqnarray}$$
For direct comparisons with the classic scaling
 $u_{\unicode[STIX]{x1D70F}}$
, we can define an alternative characteristic velocity scale by analogy with (2.1) as
 $u^{\star }\equiv \sqrt{-\langle u_{1}u_{2}\rangle /(1-x_{2}/h)}$
(Tuerke & Jiménez Reference Tuerke and Jiménez2013). Note that the factor
 $\sqrt{1-x_{2}/h}$
in the definition of
 $u^{\star }$
is introduced only for convenience and such that
 $u^{\star }$
collapses to
 $u_{\unicode[STIX]{x1D70F}}$
for a channel flow driven by a constant mean pressure gradient.
The scenario proposed for the characteristic time and length scales of wall-attached eddies also differs from the classic theory. Let us consider a momentum-carrying eddy of size
 $l^{\ast }\sim u^{\ast }t^{\ast }$
controlled by the injection of energy from the mean shear and, therefore, with characteristic life span
 $$\begin{eqnarray}t^{\ast }\equiv \left(\frac{\unicode[STIX]{x2202}\langle u_{1}\rangle }{\unicode[STIX]{x2202}x_{2}}\right)^{-1}.\end{eqnarray}$$
The scaling in (2.3) can also be interpreted as the average time for the eddies to extract energy from the mean shear. Considering the scaling proposed for
 $u^{\ast }$
in (2.2), the characteristic length scale is
 $$\begin{eqnarray}l^{\ast }\equiv u^{\ast }t^{\ast }=\sqrt{-\langle u_{1}u_{2}\rangle }\left(\frac{\unicode[STIX]{x2202}\langle u_{1}\rangle }{\unicode[STIX]{x2202}x_{2}}\right)^{-1}.\end{eqnarray}$$
Equation (2.4) can also be obtained by assuming that the momentum-carrying eddies are controlled by the mean production rate of turbulent kinetic energy,
 $P=-\langle u_{1}u_{2}\rangle \unicode[STIX]{x2202}\langle u_{1}\rangle /\unicode[STIX]{x2202}x_{2}\sim u^{\ast 3}/l^{\ast }$
, which together with (2.2) yields an expression identical to (2.4).
For the particular case of a plane channel flow with no-slip walls and constant mean pressure gradient, we recover
 $u^{\star }=u_{\unicode[STIX]{x1D70F}}$
away from the wall. Moreover, at high Reynolds numbers, the characteristic length
 $l^{\ast }$
in the log region of the flow (
 $x_{2}\lesssim 0.2h$
) with mean shear
 $\unicode[STIX]{x2202}\langle u_{1}\rangle /\unicode[STIX]{x2202}x_{2}=u_{\unicode[STIX]{x1D70F}}/(\unicode[STIX]{x1D705}x_{2})$
reduces to
 $$\begin{eqnarray}l^{\ast }=u_{\unicode[STIX]{x1D70F}}\sqrt{1-x_{2}/h}\left(\frac{u_{\unicode[STIX]{x1D70F}}}{\unicode[STIX]{x1D705}x_{2}}\right)^{-1}=\unicode[STIX]{x1D705}x_{2}\sqrt{1-x_{2}/h}\approx \unicode[STIX]{x1D705}x_{2},\end{eqnarray}$$
which is proportional to the distance to the wall as commonly discussed in the literature. Therefore, the extension of the characteristic scales proposed above collapses to Townsend’s model for a canonical case. It is important to remark that, despite the fact that the velocity and length scales specified by
 $u^{\star }$
and
 $l^{\ast }$
coincide with their classic counterparts
 $u_{\unicode[STIX]{x1D70F}}$
and
 $x_{2}$
for the traditional channel flow, the former are conceptually different, as they remain agnostic to the location of the wall.
3 Turbulent channel driven by
 $x_{2}$
-dependent body force

3.1 Numerical scheme and computational domain
We perform a set of direct numerical simulations (DNS) of plane turbulent channel flows by solving the incompressible Navier–Stokes equations with a staggered, second-order, finite difference (Orlandi Reference Orlandi2000) and a fractional-step method (Kim & Moin Reference Kim and Moin1985) with a third-order Runge–Kutta time-advancing scheme (Wray Reference Wray1990). Periodic boundary conditions are imposed in the streamwise and spanwise directions, and no slip at the walls. The code has been validated in previous studies in turbulent channel flows (Lozano-Durán & Bae Reference Lozano-Durán and Bae2016; Bae et al. Reference Bae, Lozano-Durán, Bose and Moin2018a ,Reference Bae, Lozano-Durán, Bose and Moin b ) and flat-plate boundary layers (Lozano-Durán, Hack & Moin Reference Lozano-Durán, Hack and Moin2018).
Wall units are denoted by the superscript
 $^{+}$
and defined in terms of the kinematic viscosity
 $\unicode[STIX]{x1D708}$
and friction velocity at the wall
 $u_{\unicode[STIX]{x1D70F}}$
. Accordingly, the friction Reynolds number is
 $Re_{\unicode[STIX]{x1D70F}}=u_{\unicode[STIX]{x1D70F}}h/\unicode[STIX]{x1D708}$
. Velocities normalised by
 $u^{\ast }$
and
 $u^{\star }$
are denoted by the superscripts
 $^{\ast }$
and
 $^{\star }$
, respectively. Fluctuating quantities with respect to the mean are represented by
 $(\cdot )^{\prime }$
. The computational domain for the present simulations is
 $2\unicode[STIX]{x03C0}h\times 2h\times \unicode[STIX]{x03C0}h$
in the streamwise, wall-normal and spanwise directions, respectively. It has been shown that this domain size is large enough to accurately predict one-point statistics for
 $Re_{\unicode[STIX]{x1D70F}}$
up to 4200 (Lozano-Durán & Jiménez Reference Lozano-Durán and Jiménez2014a
).
We compare our results with DNS data from del Álamo & Jiménez (Reference del Álamo and Jiménez2003) and Hoyas & Jiménez (Reference Hoyas and Jiménez2006) at
 $Re_{\unicode[STIX]{x1D70F}}\approx 550$
, 950 and 2000, which are labelled as NS550, NS950 and NS2000, respectively. The three cases have computational domains equal to
 $8\unicode[STIX]{x03C0}h\times 2h\times 3\unicode[STIX]{x03C0}h$
in the streamwise, wall-normal and spanwise directions, respectively.
3.2 Numerical experiments of channels driven by
$x_{2}$
-dependent body force

We devise two sets of conceptual numerical experiments to unravel the characteristic scales of the outer-layer motions. The first set of experiments is a channel flow with no-slip walls driven by an
 $x_{2}$
-dependent body force per unit mass of the form
 $$\begin{eqnarray}f_{1}=\frac{u_{\unicode[STIX]{x1D70F}}^{2}}{h}[1+\unicode[STIX]{x1D716}(2x_{2}/h-x_{2}^{2}/h^{2})-2/3\unicode[STIX]{x1D716}],\quad f_{2}=0,\quad f_{3}=0,\end{eqnarray}$$
where
 $f_{i}$
is the component of the force in the
 $i$
th direction, and
 $\unicode[STIX]{x1D716}$
is a non-dimensional adjustable parameter. Equation (3.1) is such that
 $Re_{\unicode[STIX]{x1D70F}}$
remains unchanged with
 $\unicode[STIX]{x1D716}$
. For
 $\unicode[STIX]{x1D716}=0$
, we recover the constant body force typically used to drive the channel,
 $f_{1}=u_{\unicode[STIX]{x1D70F}}^{2}/h$
. The goal of (3.1) is to alter the natural balance between eddies, which are forced to readjust their intensities to accommodate the new momentum flux. Two cases are considered at
 $Re_{\unicode[STIX]{x1D70F}}\approx 550$
:
 $\unicode[STIX]{x1D716}=4$
, labelled as NS550-p; and
 $\unicode[STIX]{x1D716}=-2$
, labelled as NS550-n, where NS denotes no-slip boundary condition at the walls. Note that case NS550 corresponds to
 $\unicode[STIX]{x1D716}=0$
.
The second set of experiments intends to clarify the characteristic length scales of the active energy-containing eddies. The change in
 $u^{\ast }$
and
 $t^{\ast }$
from NS550-p and NS550-n is not significant enough to assess conclusively the scaling proposed in (2.4). For that reason, two new simulations, NS550-s1 and NS550-s2, are considered by prescribing a synthetic mean velocity profile of the form
 $$\begin{eqnarray}\frac{\langle u_{1}\rangle }{u_{ref}}=\frac{\unicode[STIX]{x1D6FC}+2}{\unicode[STIX]{x1D6FC}+1}[1-(x_{2}/h-1)^{\unicode[STIX]{x1D6FC}+1}]+\frac{\unicode[STIX]{x1D6FD}+2}{\unicode[STIX]{x1D6FD}+1}[1-(x_{2}/h-1)^{\unicode[STIX]{x1D6FD}+1}],\end{eqnarray}$$
with
 $(\unicode[STIX]{x1D6FC},\unicode[STIX]{x1D6FD})=(41,11)$
and
 $(3,3)$
for NS550-s1 and NS550-s2, respectively. The parameter
 $u_{ref}$
was adjusted to achieve
 $Re_{\unicode[STIX]{x1D70F}}\approx 550$
. The profiles from (3.2) are purposely tailored to create distinguishable
 $l^{\ast }$
with values equal to
 $0.06h$
,
 $0.03h$
and
 $0.04h$
at
 $x_{2}=0.10h$
, for cases NS550, NS550-s1 and NS550-s2, respectively. These last two simulations are similar to channel flows driven by
 $x_{2}$
-dependent body forces discussed above, in the sense that prescribing the mean velocity profile is equivalent to imposing an
 $x_{2}$
-dependent (and time-dependent) forcing as in (3.1). Simulations of turbulent channels with prescribed velocity profiles can also be found in Tuerke & Jiménez (Reference Tuerke and Jiménez2013). All the cases above are designed such that
 $u_{\unicode[STIX]{x1D70F}}$
and
 $x_{2}$
remain unchanged but do not coincide with the scaling proposed by
 $u^{\star }$
and
 $l^{\ast }$
, in contrast with the traditional channel flow, where
 $u^{\star }\approx u_{\unicode[STIX]{x1D70F}}$
and
 $l^{\ast }\approx \unicode[STIX]{x1D705}x_{2}$
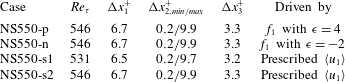
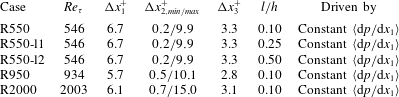
. This will allow us to assess the validity of each scaling. The list of cases is summarised in table 1. All the simulations were run for at least 10 eddy turnover times (defined as
 $h/u_{\unicode[STIX]{x1D70F}}$
) after transients.
Tabulated list of cases for § 3. The numerical experiments are labelled following the convention NS[
 $Re_{\unicode[STIX]{x1D70F}}$
]-[specific case], where NS denotes a channel with no-slip walls. Here
 $\unicode[STIX]{x0394}x_{1}$
,
 $\unicode[STIX]{x0394}x_{2}$
and
 $\unicode[STIX]{x0394}x_{3}$
are the streamwise, wall-normal and spanwise grid resolutions, respectively. The last column shows the method employed to drive the channel flow. See text for details.

3.3 Assessment of characteristic velocity and length scales
We examine scaling (2.2) in turbulent channel flows driven by (3.1). The imposed
 $x_{2}$
-dependent body force breaks the global velocity scale with
 $u_{\unicode[STIX]{x1D70F}}$
, and the new balance for the mean momentum flux requires that
 $$\begin{eqnarray}\langle u_{1}u_{2}\rangle \approx \int _{0}^{x_{2}}f_{1}(x_{2}^{\prime })\,\text{d}x_{2}^{\prime }.\end{eqnarray}$$
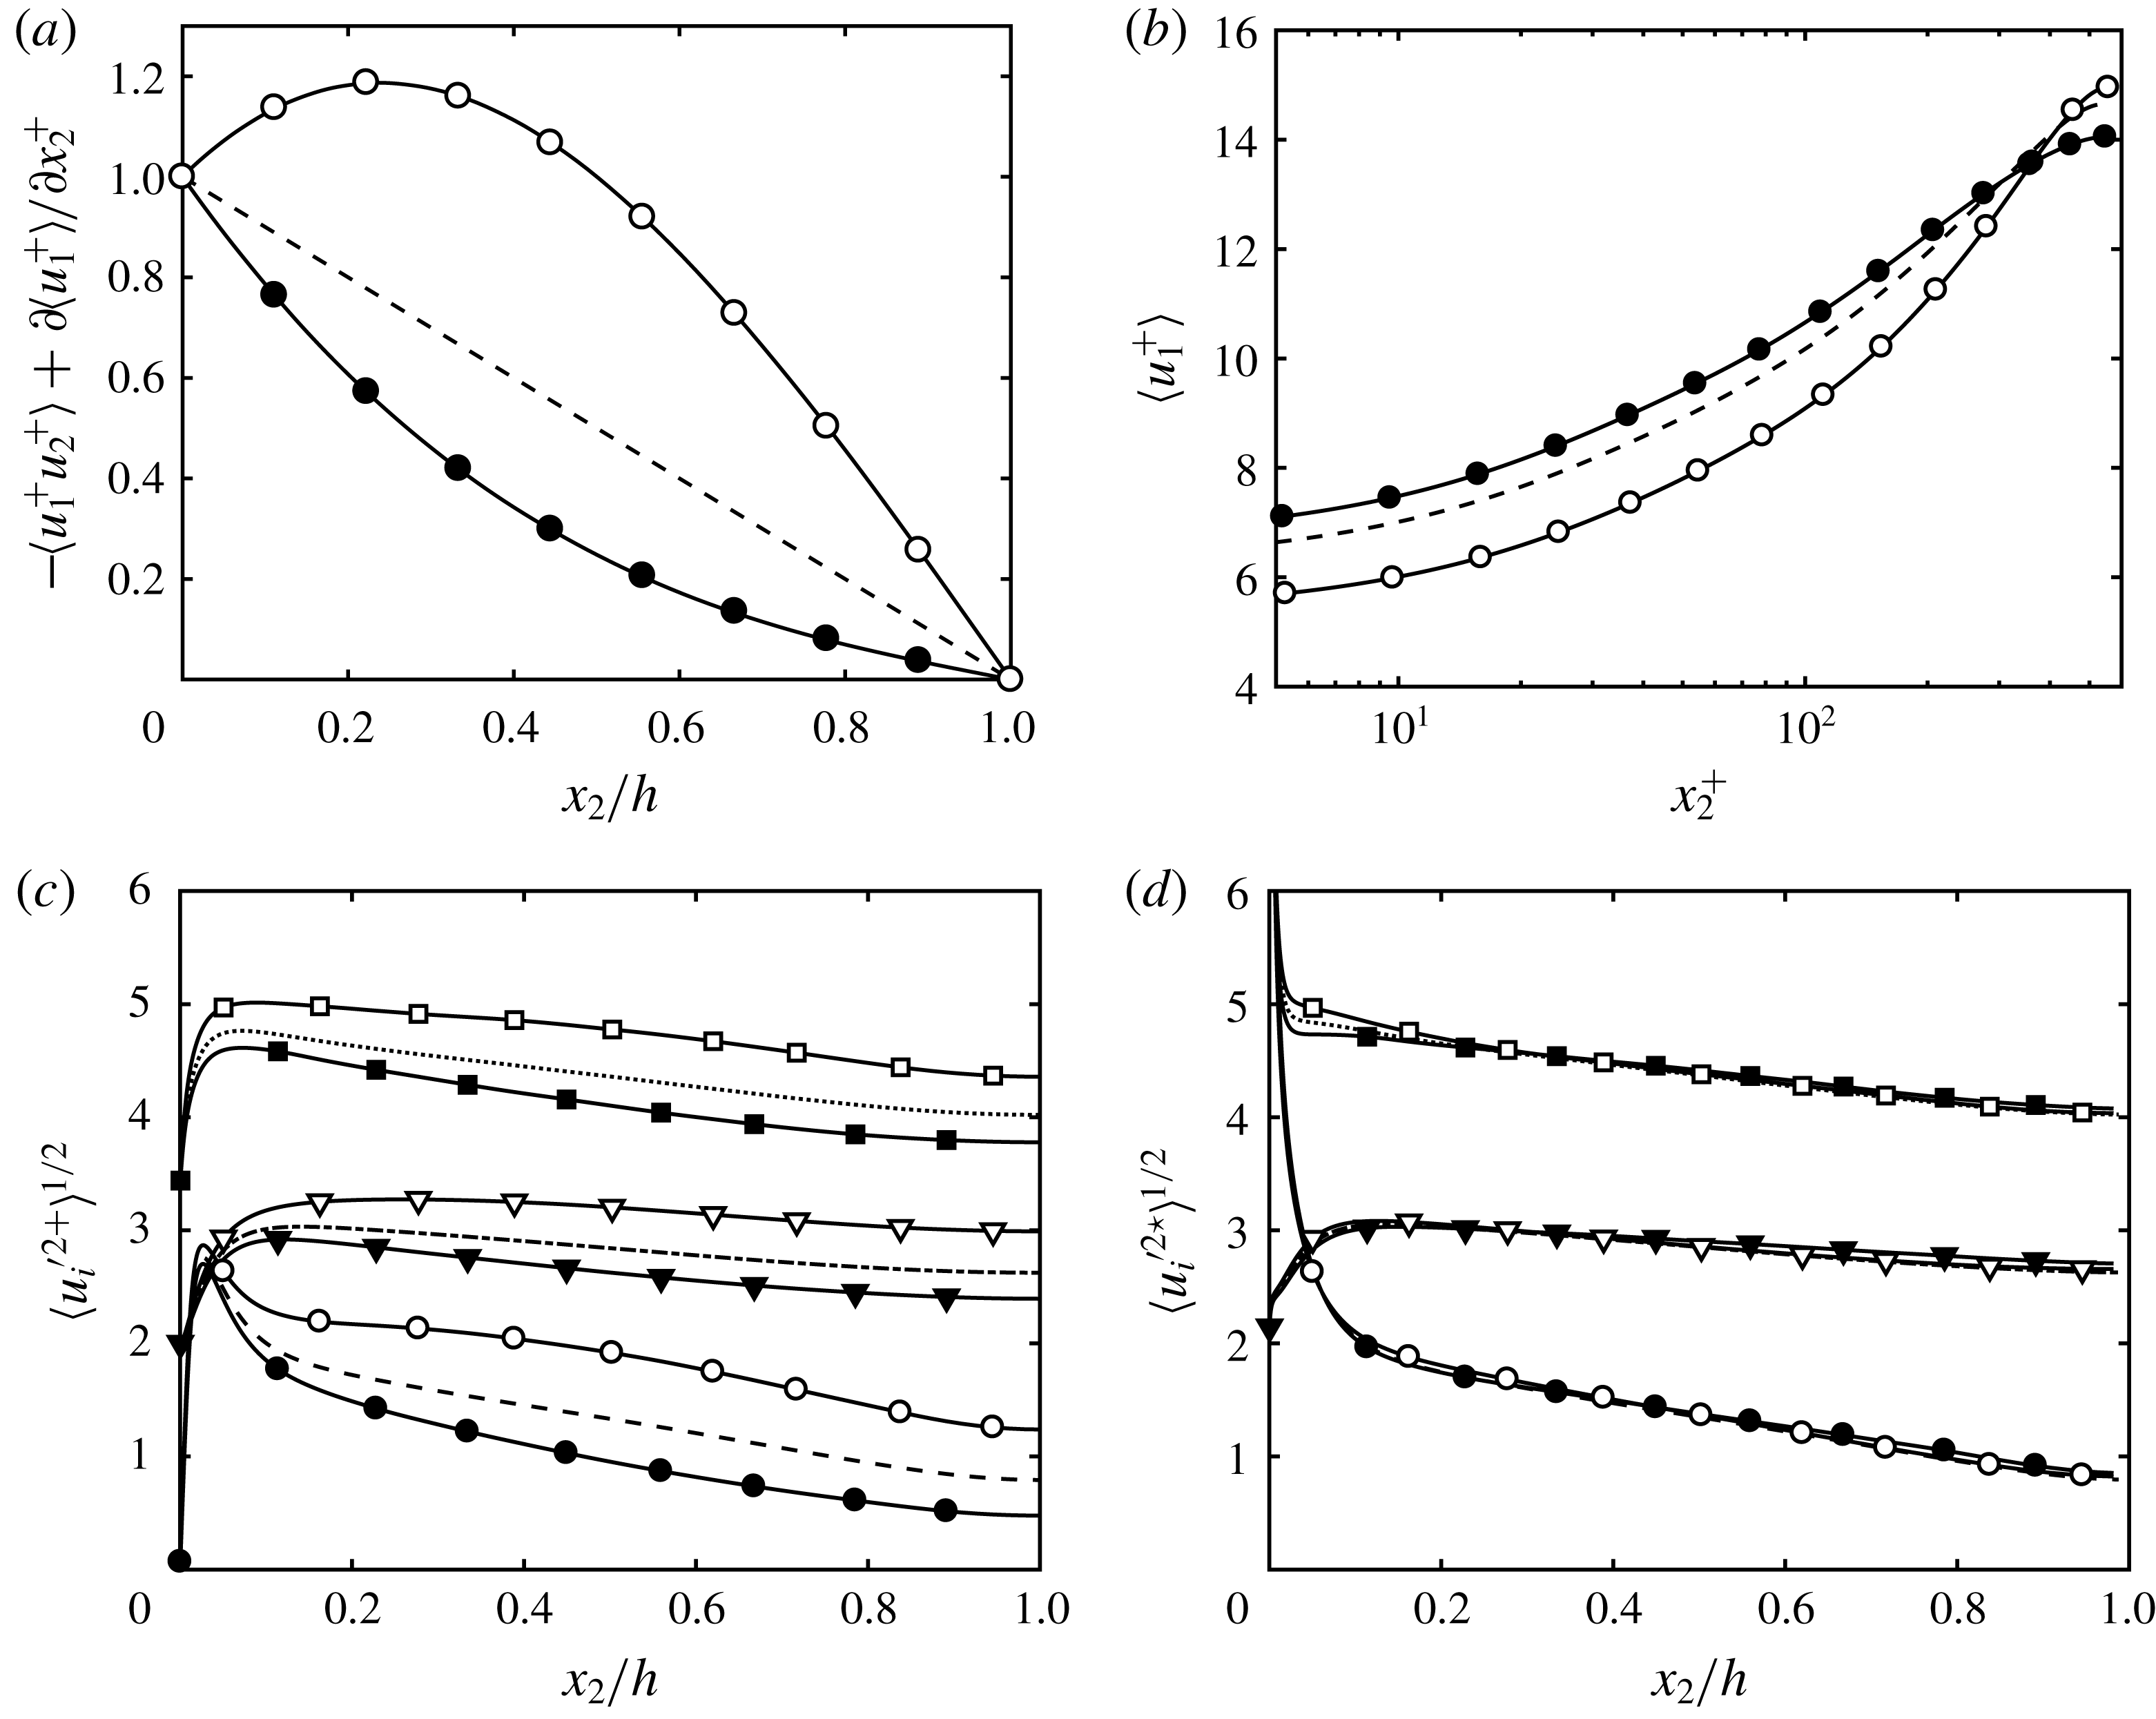
The total stresses consistent with (3.3) for cases NS550-p and NS550-n are shown in figure 2(a). Changes in the momentum flux propagate to the mean velocity profile as dictated by the integrated streamwise mean momentum equation, and the resulting profiles are shown in figure 2(b).
Mean (a) total tangential Reynolds stress and (b) streamwise velocity profile for NS550 (– – –), NS550-p (○) and NS550-n (●). Panels (c,d) contain the streamwise (circles and – – –), wall-normal (triangles and – ⋅ – ⋅ –) and spanwise (squares and
 $\cdots \cdots$
) r.m.s. velocity fluctuations scaled with (c)
 $u_{\unicode[STIX]{x1D70F}}$
and (d)
 $u^{\star }$
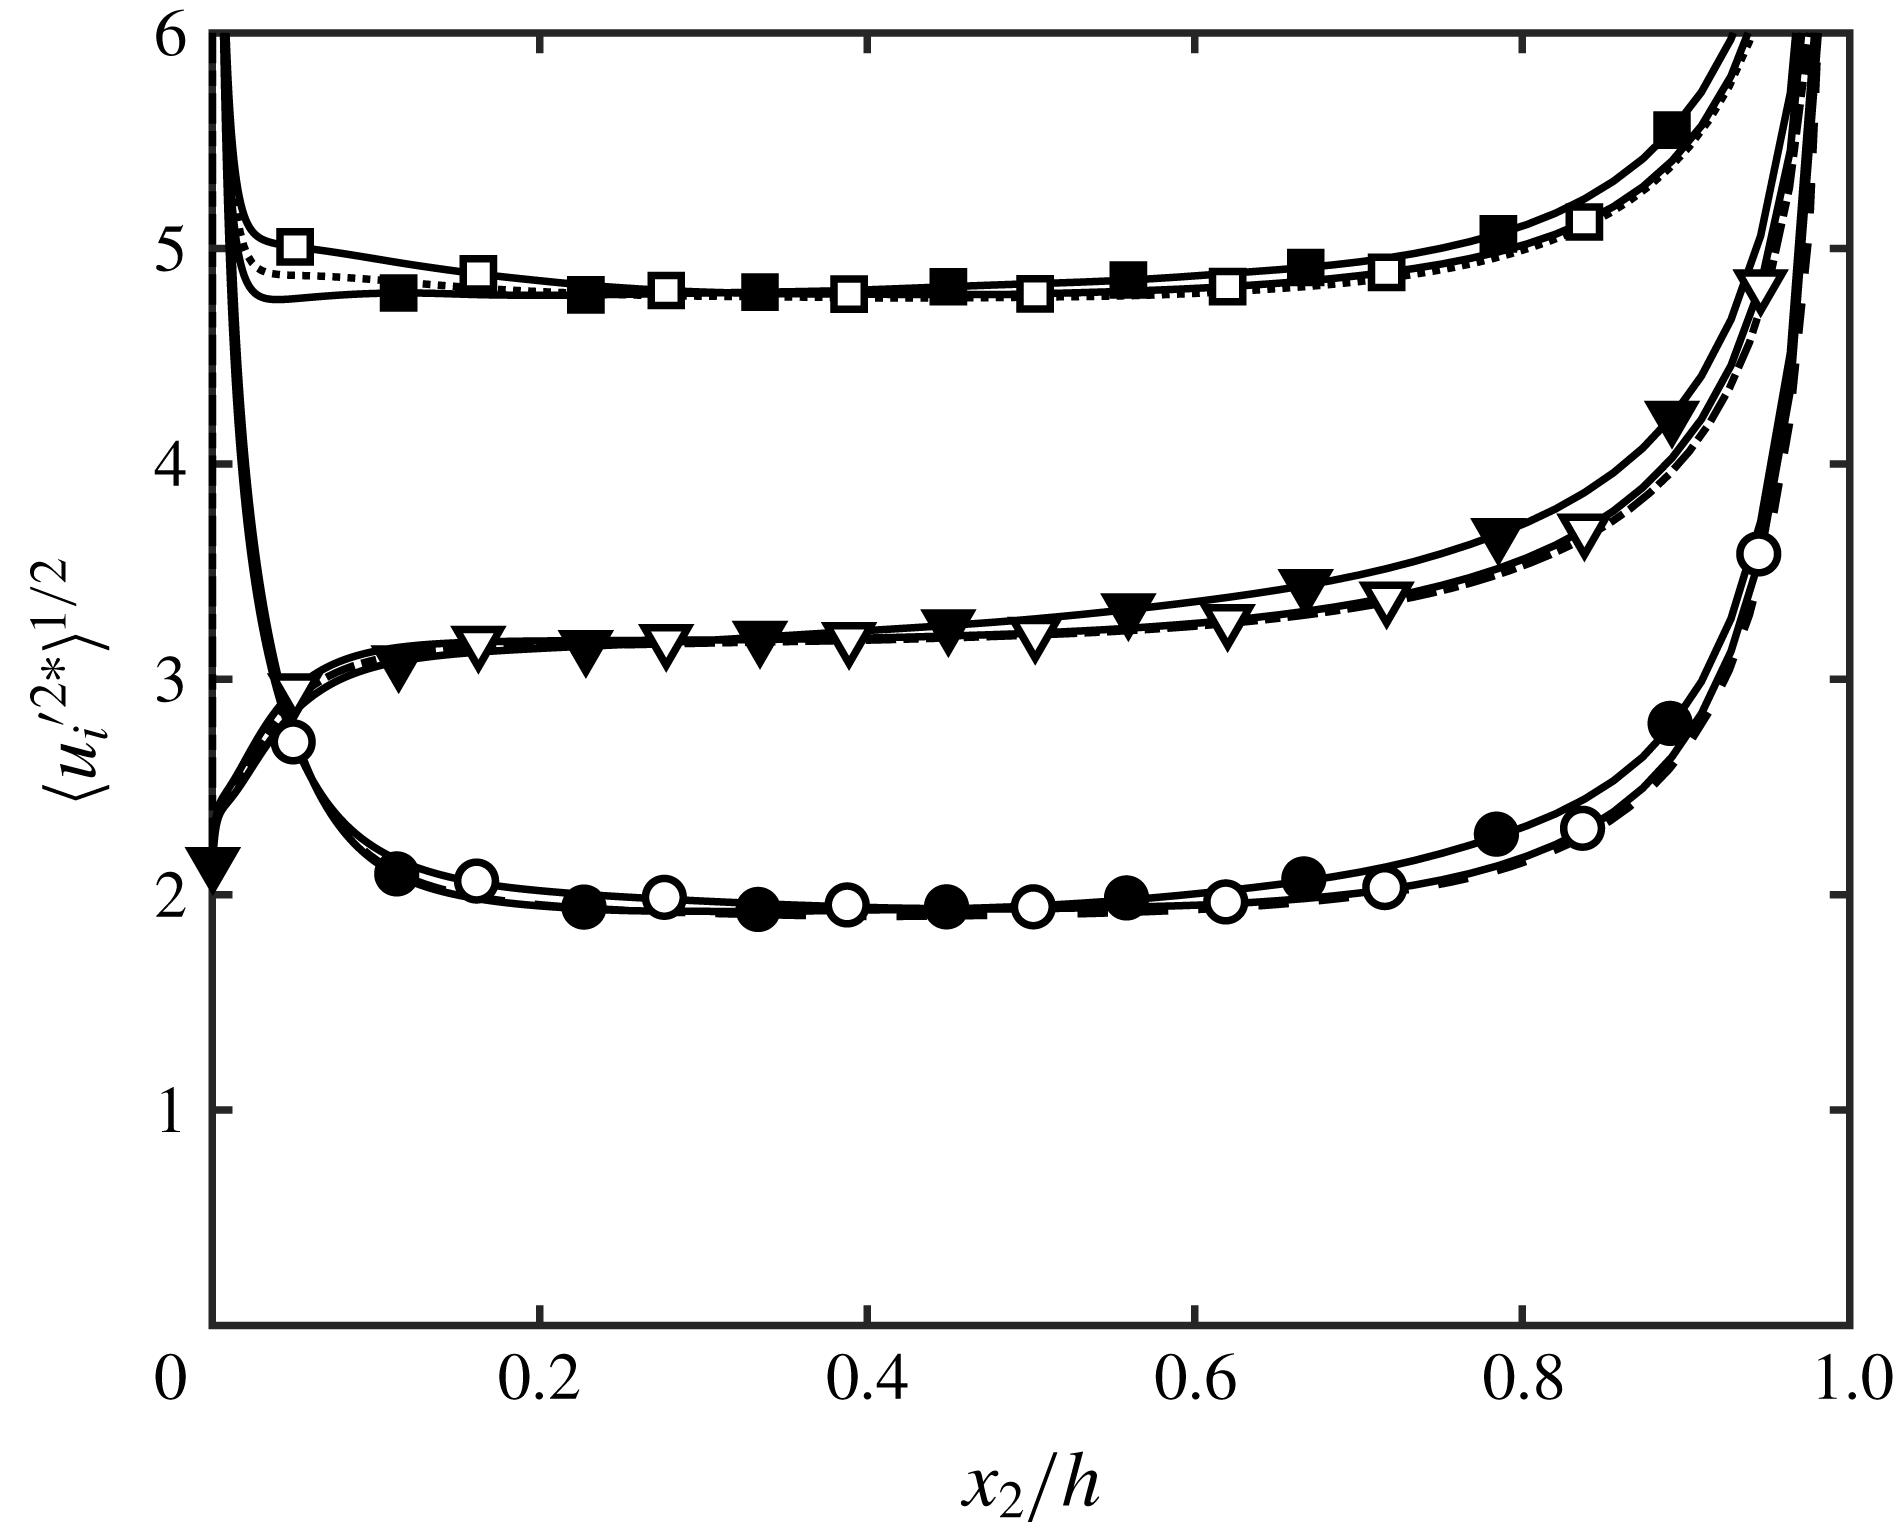
. Symbols are for NS550-p (open) and NS550-n (closed). Lines without symbols are for NS550. For clarity, the profiles for the wall-normal and spanwise r.m.s. velocity fluctuations are shifted vertically by 2.0 and 3.4 wall units.

The three root-mean-squared (r.m.s.) fluctuating velocities for NS550, NS550-p and NS550-n are reported in figure 2(c). The pronounced lack of collapse among the three cases exposes the unsatisfactory scaling with
 $u_{\unicode[STIX]{x1D70F}}$
. Conversely, when the r.m.s. fluctuating velocities are scaled with
 $u^{\star }$
, which can be analytically evaluated for cases NS550-p and NS550-n, the agreement is excellent (figure 2
d). Appendix A shows results using
 $u^{\ast }$
, which does not have any explicit functional dependence on
 $x_{2}$
. Note that the argument above holds for Townsend’s active motions, i.e. those responsible for the mean momentum transfer, and that the inactive motions are expected to scale not with
 $u^{\star }$
(or
 $u^{\ast }$
) but with the bulk velocity or a mixed scale as suggested in previous works (Zagarola & Smits Reference Zagarola and Smits1998; De Graaff & Eaton Reference De Graaff and Eaton2000; del Álamo et al.
Reference del Álamo, Jiménez, Zandonade and Moser2004; Morrison et al.
Reference Morrison, McKeon, Jiang and Smits2004).
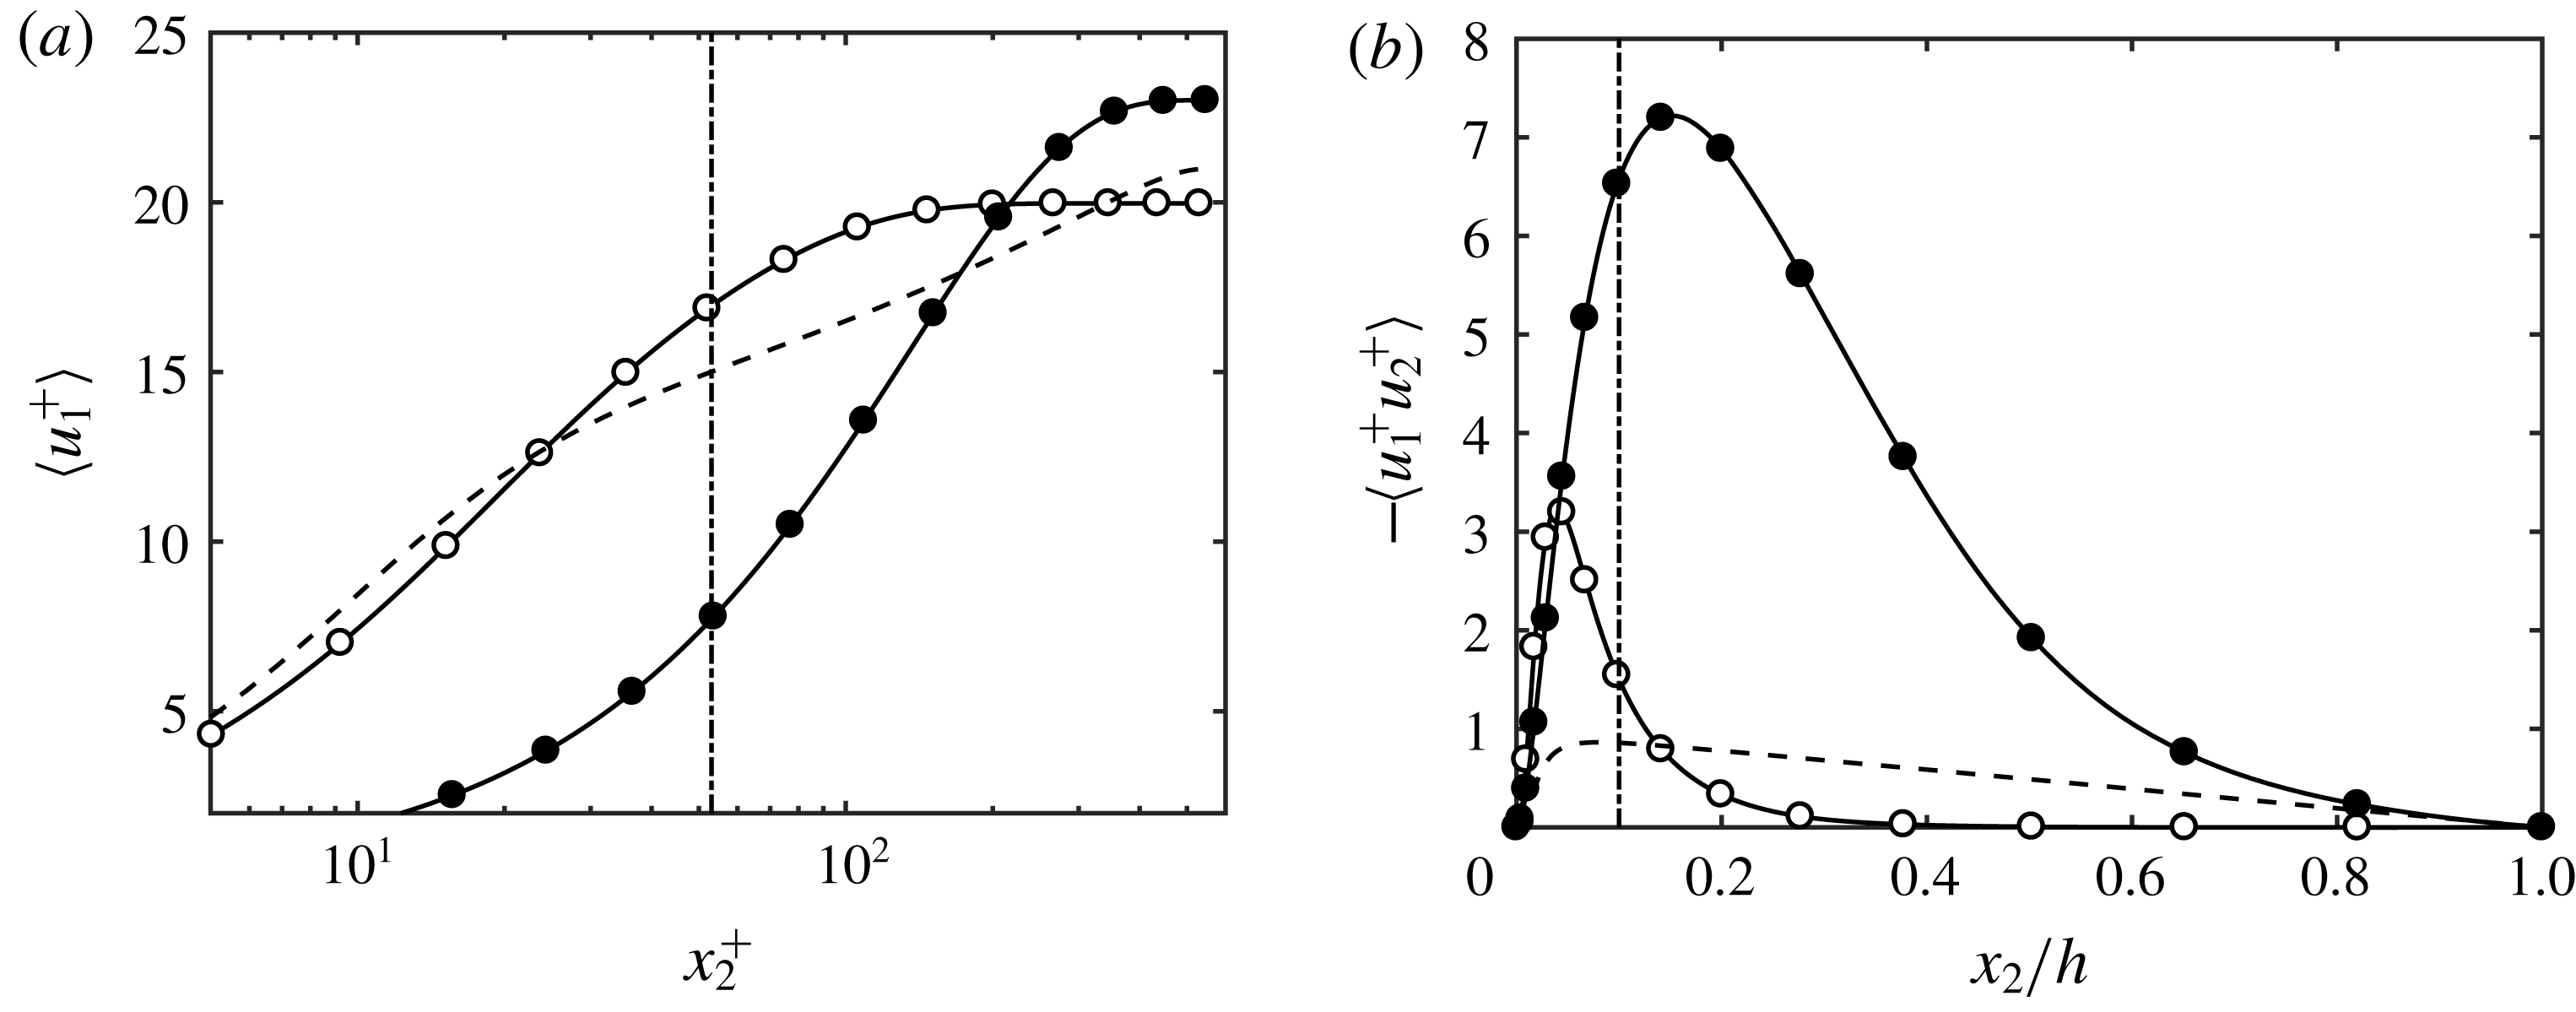
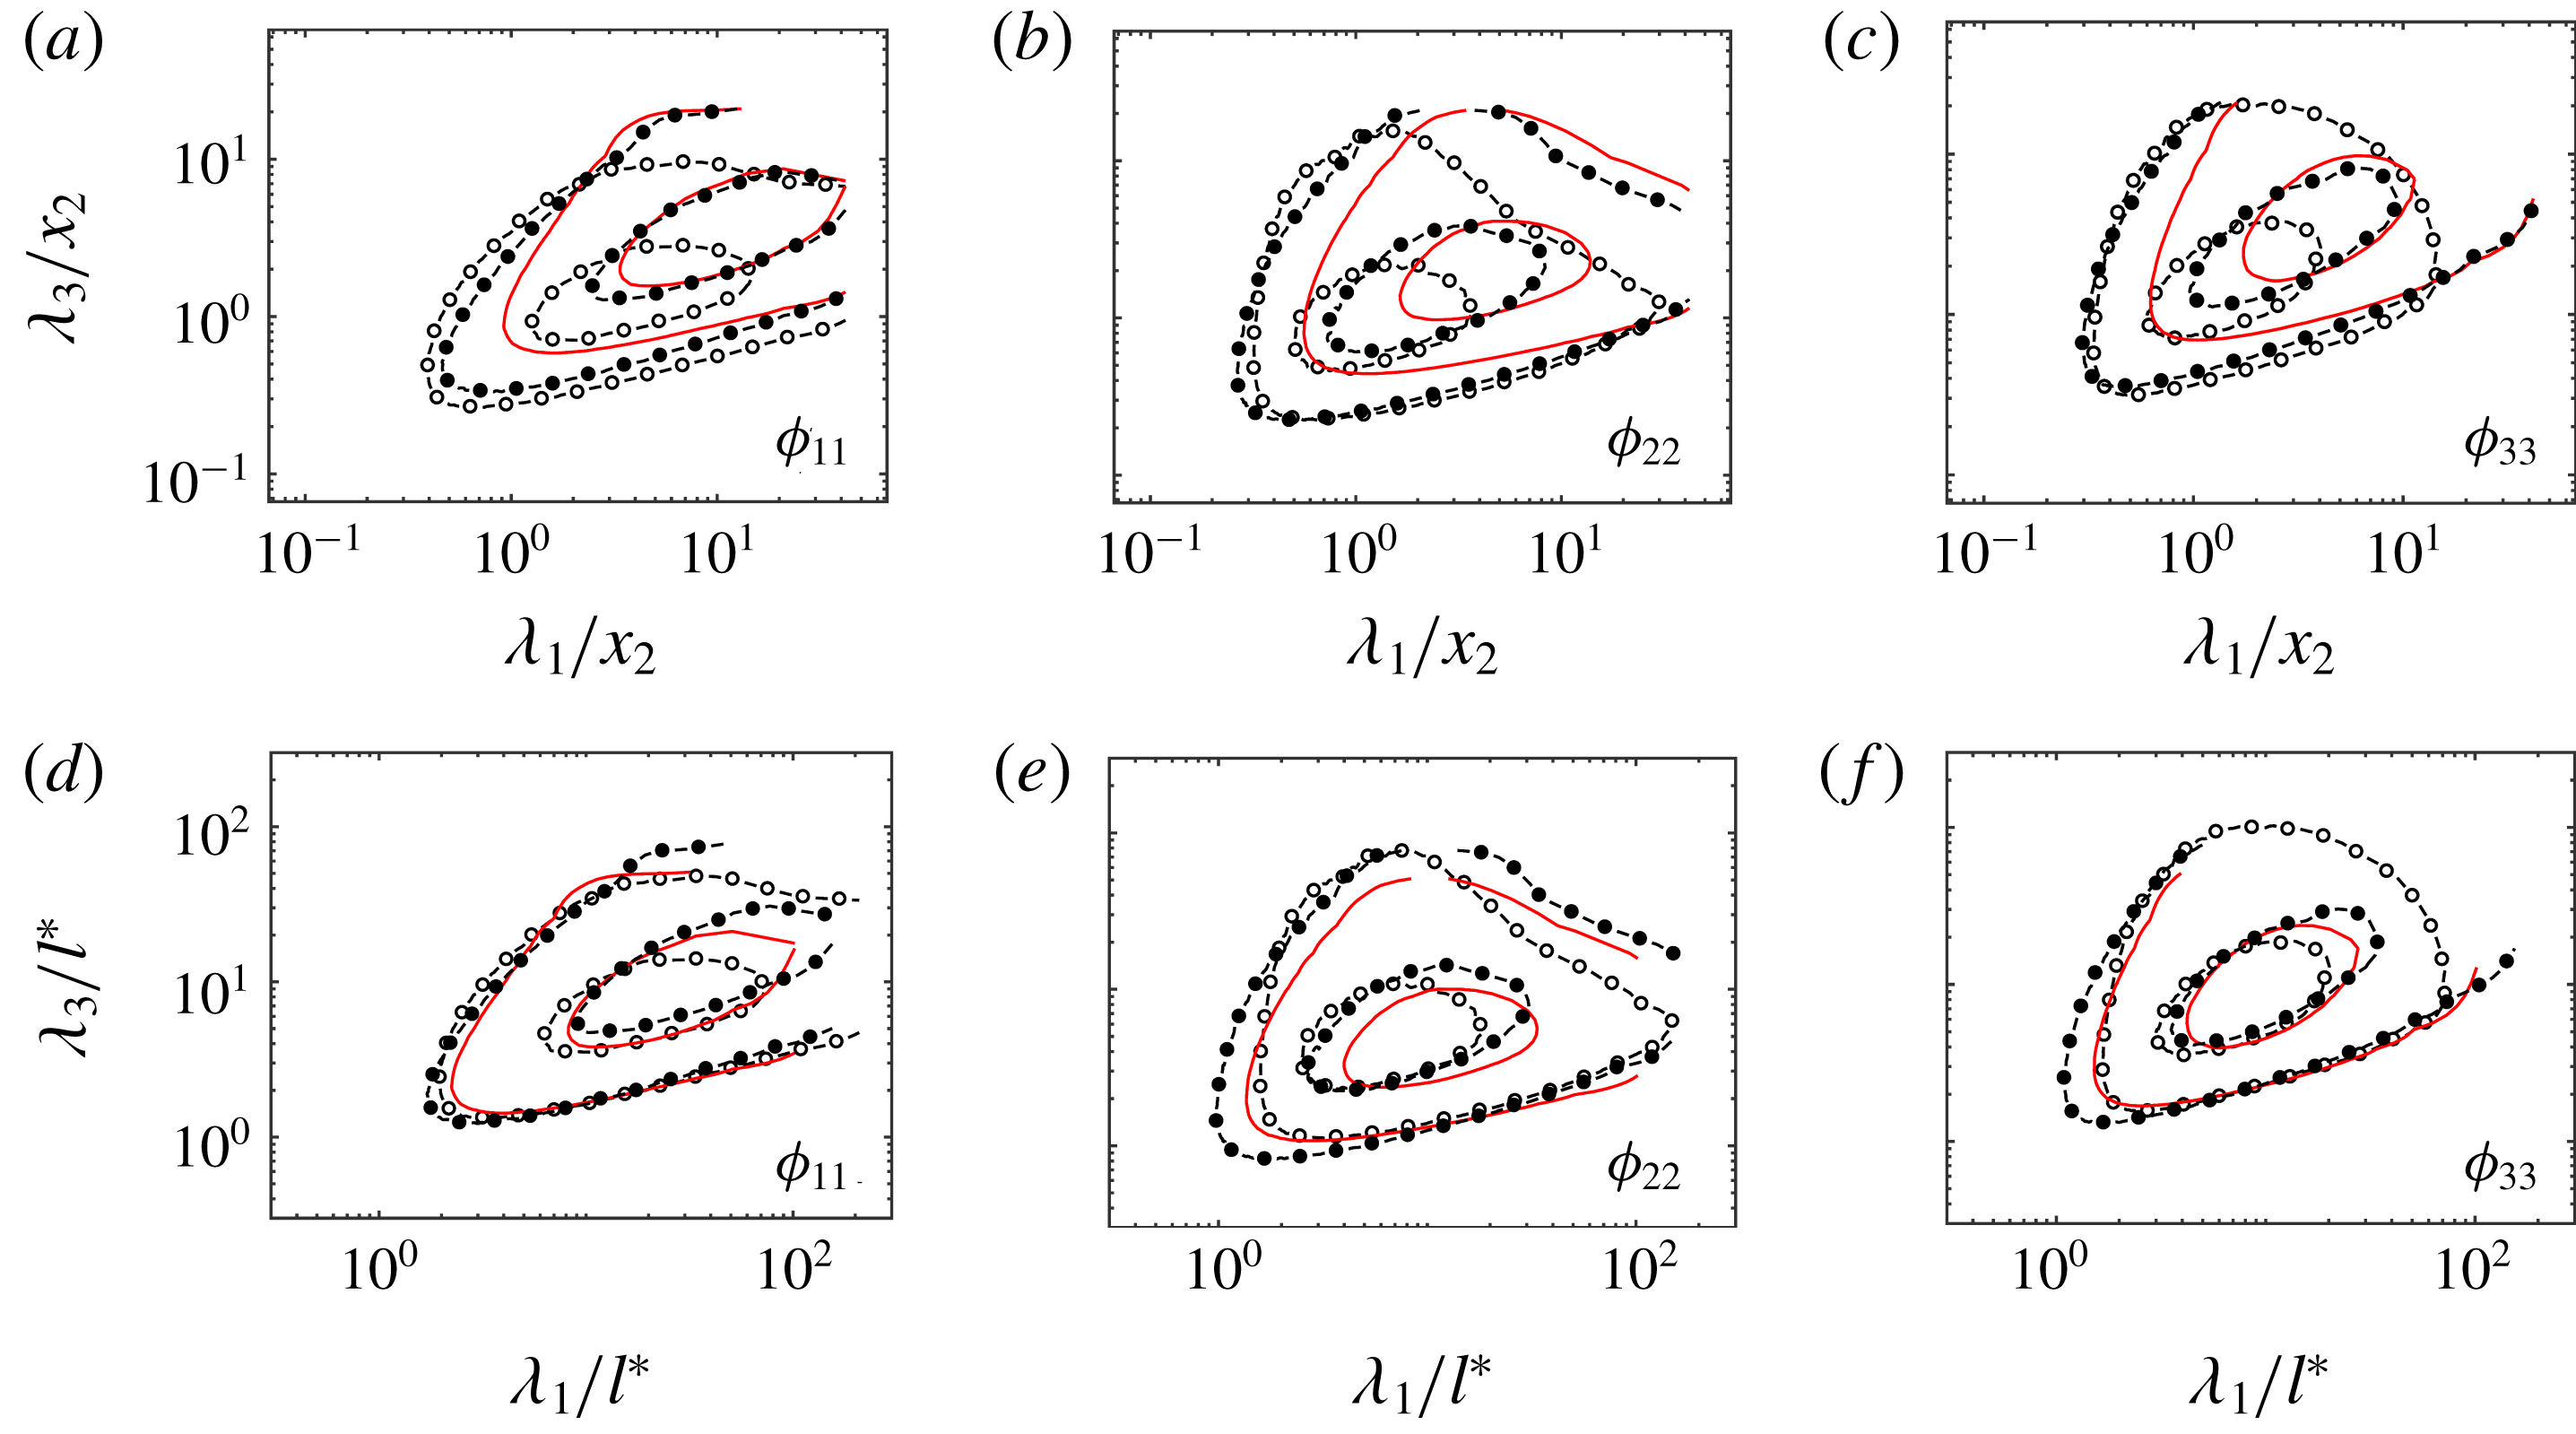
Scaling (2.4) is investigated in cases NS550, NS550-s1 and NS550-s2 with mean velocity profiles shown in figure 3(a). Figure 3(b) contains the tangential Reynolds stress artificially generated to sustain
 $\langle u_{1}\rangle$
. The relevant length scale of the momentum-carrying eddies is examined in figure 4 by comparing the premultiplied, two-dimensional velocity spectra (
 $\unicode[STIX]{x1D719}_{ii}$
,
 $i=1,2,3$
) at
 $x_{2}=0.10h$
as a function of the streamwise and spanwise wavelengths (
 $\unicode[STIX]{x1D706}_{1}$
and
 $\unicode[STIX]{x1D706}_{3}$
) scaled by the distance to the wall (figure 4
a–c) and
 $l^{\ast }$
(figure 4
d–f). The spectra display a noticeable mismatch when the wavelengths are scaled by
 $x_{2}$
, whereas the collapse is appreciably improved when
 $\unicode[STIX]{x1D706}_{1}$
and
 $\unicode[STIX]{x1D706}_{3}$
are normalised by
 $l^{\ast }$
, especially for the most intense spectral cores. Therefore,
 $l^{\ast }$
stands as a more faithful characterisation of the eddy sizes compared to the distance to the wall.
Mean (a) streamwise velocity profile and (b) tangential Reynolds stress for NS550 (– – –), NS550-s1 (○) and NS550-s2 (●). The dash-dotted line is
 $x_{2}=0.1h$
.

Premultiplied streamwise
 $\unicode[STIX]{x1D719}_{11}$
(a,d), wall-normal
 $\unicode[STIX]{x1D719}_{22}$
(b,e) and spanwise
 $\unicode[STIX]{x1D719}_{33}$
(c,f) velocity two-dimensional spectra at
 $x_{2}=0.10h$
for NS550 (——), NS550-s1 (○) and NS550-s2 (●). The wavelengths are scaled by
 $x_{2}$
in (a–c) and by
 $l^{\ast }$
in (d–f). Contours are 0.1 and 0.6 of the maximum.

We further examine the performance of
 $l^{\ast }$
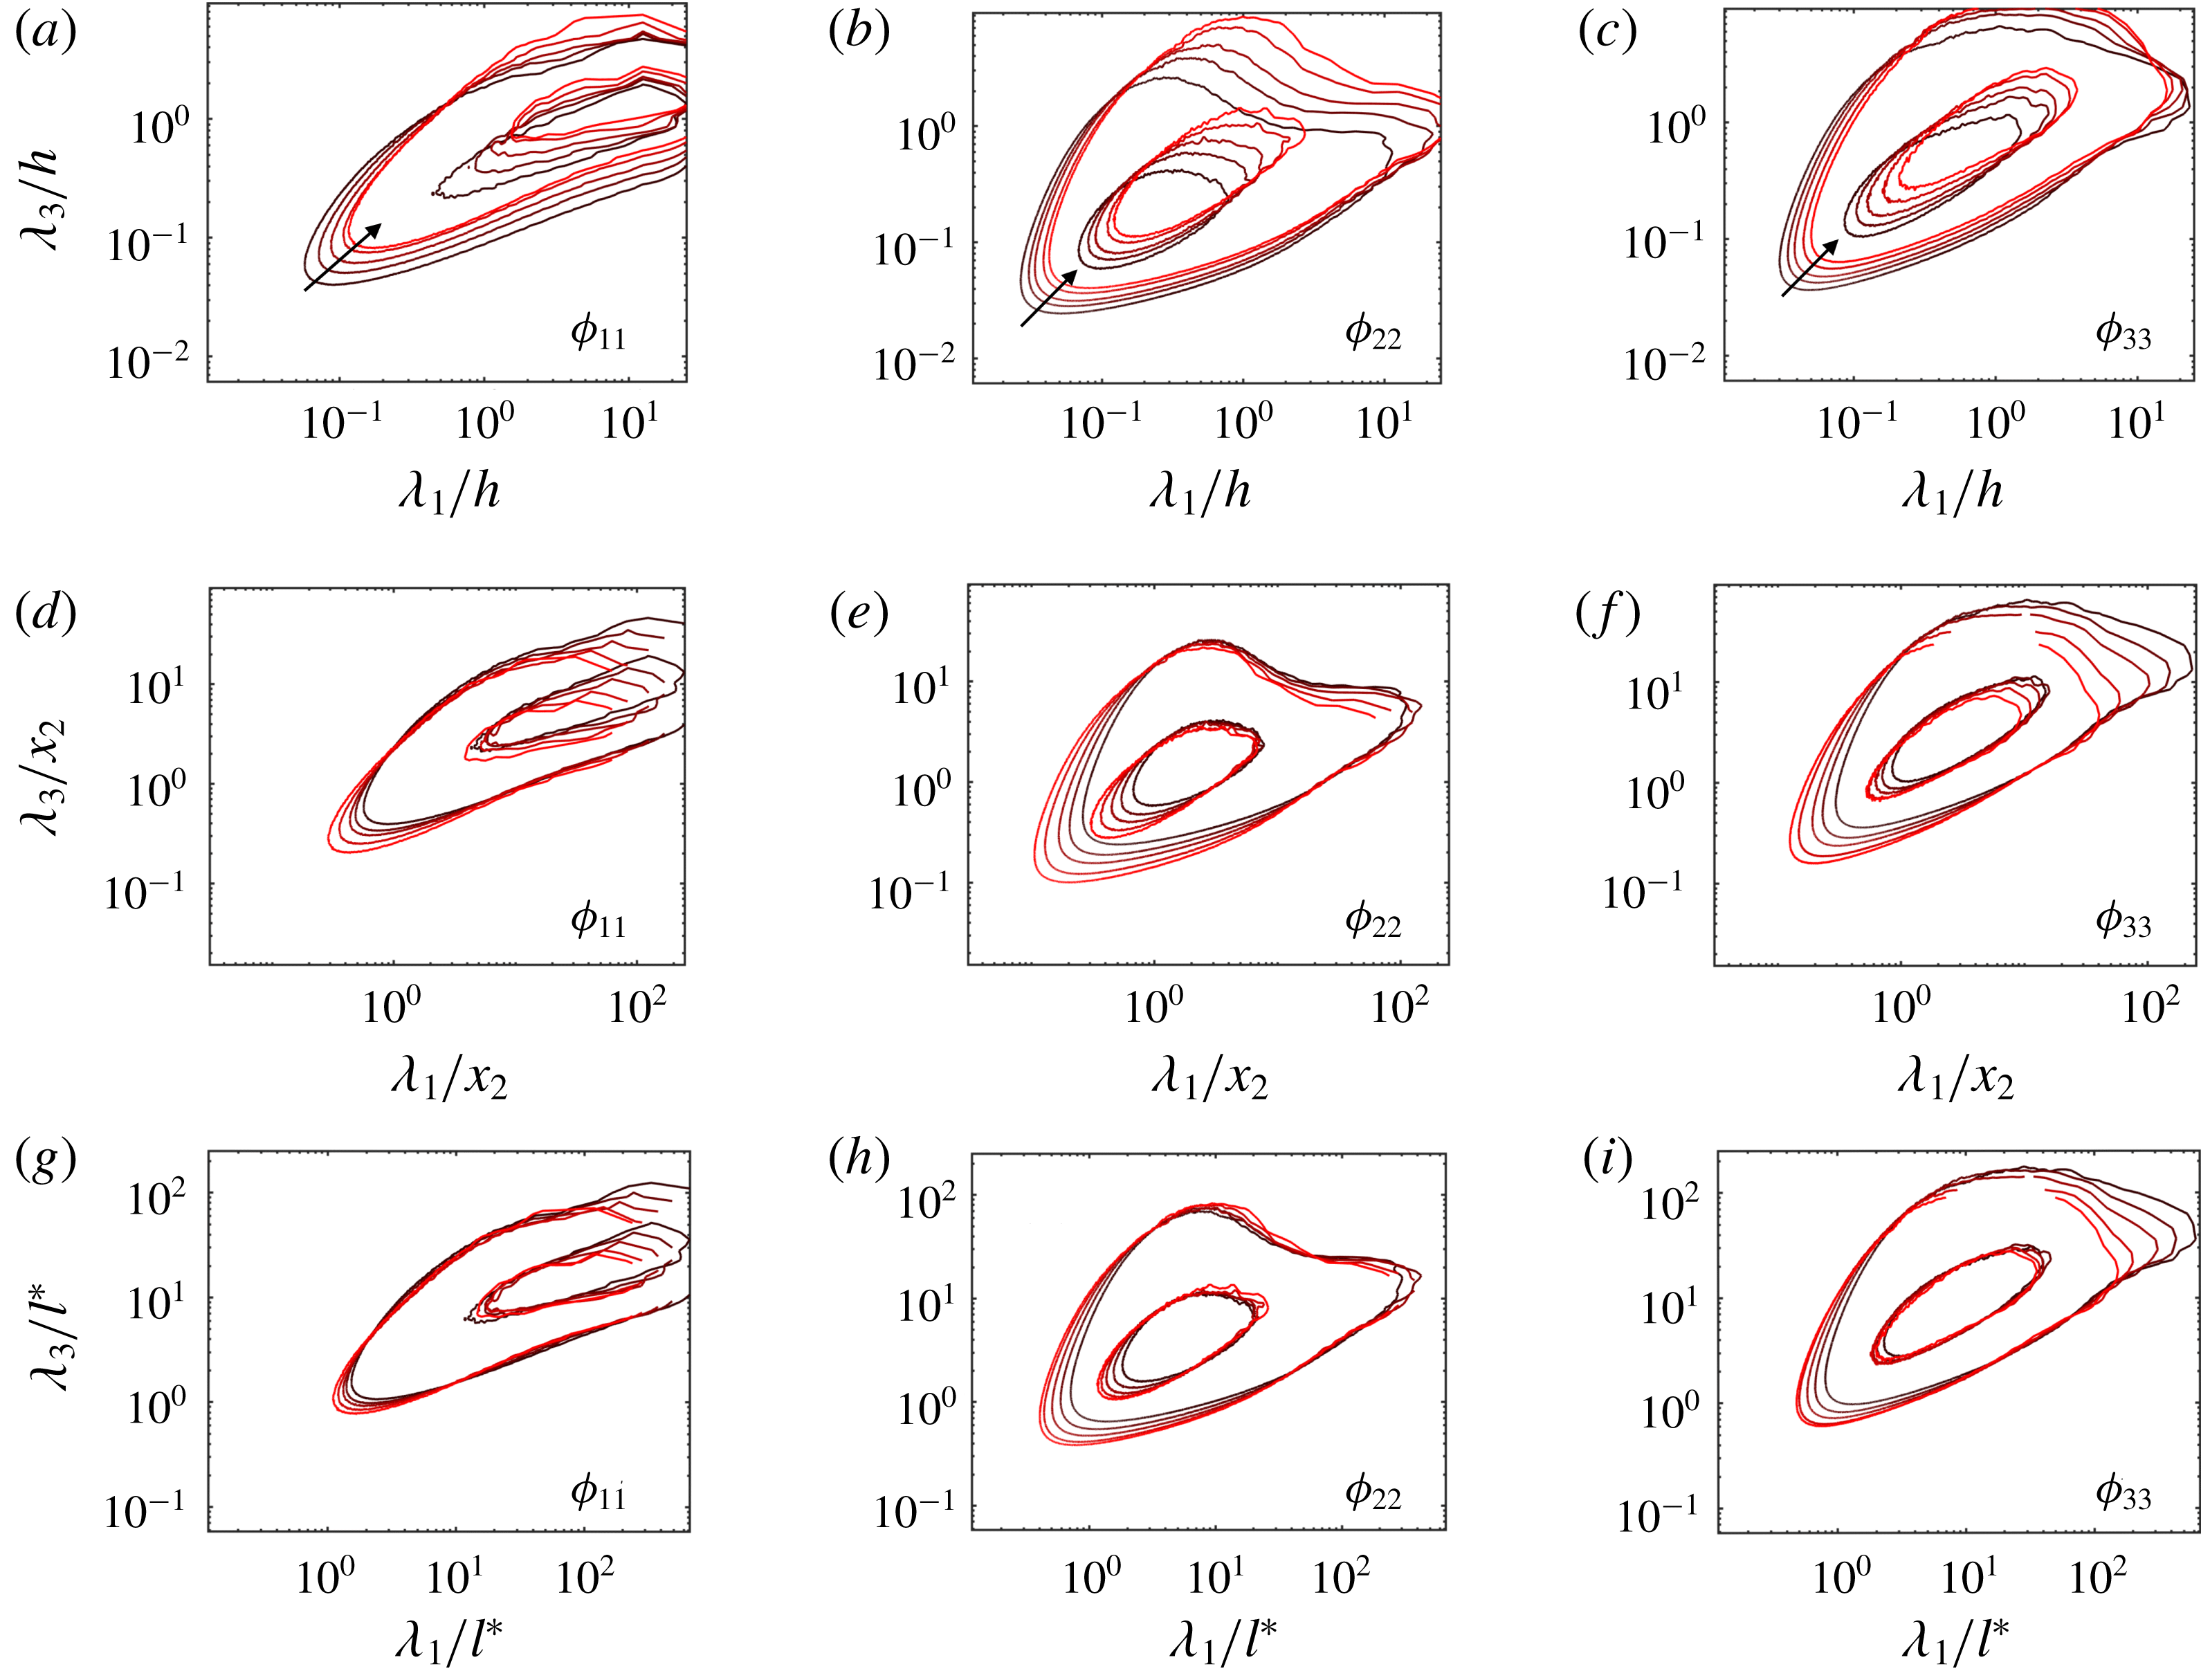
at different wall-normal heights using the traditional channel flow NS2000. Figure 5 shows the premultiplied velocity spectra for various wall-normal distances ranging from
 $x_{2}=0.1h$
to
 $x_{2}=0.4h$
. We test three different length scales to normalise the streamwise and spanwise wavelengths, namely,
 $h$
(figure 5
a–c),
 $x_{2}$
(figure 5
d–f) and
 $l^{\ast }$
(figure 5
g–i). Again, the best collapse is attained for
 $l^{\ast }$
, although
 $x_{2}$
also provides a quantitative improvement with respect to
 $h$
.
Premultiplied streamwise
 $\unicode[STIX]{x1D719}_{11}$
(a,d,g), wall-normal
 $\unicode[STIX]{x1D719}_{22}$
(b,e,h) and spanwise
 $\unicode[STIX]{x1D719}_{33}$
(c,f,i) two-dimensional velocity spectra at
 $x_{2}/h=0.10$
, 0.15, 0.20, 0.30 and 0.40 (from black to red) for NS2000. The wavelengths are scaled by
 $h$
(a–c),
 $x_{2}$
(d–f) and
 $l^{\ast }$
(g–i). Contours are 0.1 and 0.6 of the maximum. The arrows in panels (a–c) indicate increasing distance from the wall.

The normalisation by
 $l^{\ast }$
is still far from perfect, although this may be expected considering that the new scaling is only applicable to the active motions responsible for carrying the tangential momentum flux. For that reason, both the lower spectral contours and the large-scale tails of
 $\unicode[STIX]{x1D719}_{11}$
and
 $\unicode[STIX]{x1D719}_{33}$
are not required to scale with
 $l^{\ast }$
, the former due to contamination from small eddies decoupled from the mean shear, and the latter due to their lack of tangential stress despite their non-zero energy content.
In summary, we have shown that
 $u^{\ast }$
(or
 $u^{\star }$
) and
 $l^{\ast }$
are tenable candidates to represent the characteristic scales of the momentum-carrying eddies in wall-bounded turbulence. Although we have focused on channel flows, we expect
 $u^{\ast }$
and
 $l^{\ast }$
to perform similarly in turbulent boundary layers. The proposed scales are still consistent with the classic scaling provided by
 $u_{\unicode[STIX]{x1D70F}}$
and
 $x_{2}$
for canonical flows, and can be considered as an extension for more general shear-dominated turbulence.
4 Turbulent channel with Robin boundary conditions
In this section, we analyse the significance of the distance to the wall for the outer flow by using turbulent channel flows where the no-slip wall is replaced by Robin boundary conditions. The new set-up allows for instantaneous velocities at the boundaries and, in particular, for wall-normal transpiration. No transpiration is considered to be the most distinctive feature of walls, and it is commonly understood as the mean by which the log-layer motions ‘feel’ the distance to the wall. Hence, the non-zero
 $u_{2}$
at
 $x_{2}=0$
(and
 $x_{2}=2h$
) introduced by the Robin boundary condition is intended to assess the role of impermeable walls as organising agents of wall-attached eddies.
4.1 Numerical experiments of channels with Robin boundary conditions
We perform a set of DNS of turbulent channel flows using the same numerical scheme and computational domain as in § 3.1. The no-slip wall is replaced by a Robin boundary condition of the form
 $$\begin{eqnarray}u_{i}|_{w}=\left.l\,\frac{\unicode[STIX]{x2202}u_{i}}{\unicode[STIX]{x2202}n}\right|_{w},\quad i=1,2,3,\end{eqnarray}$$
where the subscript
 $w$
refers to quantities evaluated at the wall, and
 $n$
is the wall-normal (or boundary-normal) direction. We define
 $l$
to be the slip length, which, in general, may be a function of the spatial wall-parallel coordinates and time. The choice of
 $l$
must comply with the symmetries of the flow and, particularly for a channel flow configuration, (4.1) should satisfy
 $$\begin{eqnarray}\langle u_{i}|_{w}\rangle =\left\langle \left.l\,\frac{\unicode[STIX]{x2202}u_{i}}{\unicode[STIX]{x2202}x_{2}}\right|_{w}\right\rangle =0,\quad i=2,3.\end{eqnarray}$$
In the present study, we consider a constant value for
 $l$
. This is consistent with (4.2) because
 $\langle u_{i}|_{w}\rangle =0$
and
 $\langle \unicode[STIX]{x2202}u_{i}/\unicode[STIX]{x2202}x_{2}|_{w}\rangle =0$
for
 $i=2,3$
. The cases simulated are summarised in table 2. All the simulations were run for at least 10 eddy turnover times after transients. Throughout the text, we occasionally refer to cases with the Robin boundary condition as Robin-bounded and those with the no-slip condition as wall-bounded. Robin boundary conditions have been previously employed in the wall-parallel directions to model the flow over hydrophobic surfaces (Min & Kim Reference Min and Kim2004; Martell, Perot & Rothstein Reference Martell, Perot and Rothstein2009; Park, Park & Kim Reference Park, Park and Kim2013; Jelly, Jung & Zaki Reference Jelly, Jung and Zaki2014; Seo, García-Mayoral & Mani Reference Seo, García-Mayoral and Mani2015; Seo & Mani Reference Seo and Mani2016), but note that in the present study the boundary condition is also applied to the boundary-normal velocity, which is seldom done in the literature. The slip lengths used here are also larger than the typical values in hydrophobic works.
Tabulated list of cases for § 4. The numerical experiments are labelled following the convention R[
 $Re_{\unicode[STIX]{x1D70F}}$
]-[specific case], where R denotes a channel with Robin boundary condition. Here
 $\unicode[STIX]{x0394}x_{1}$
,
 $\unicode[STIX]{x0394}x_{2}$
and
 $\unicode[STIX]{x0394}x_{3}$
are the streamwise, boundary-normal and spanwise grid resolutions, respectively. The slip length used in the Robin boundary condition is
 $l$
. The last column shows the method employed to drive the channel flow. See text for details.

The motivation of using (4.1) is to provide a boundary for the flow that deviates from the behaviour of a regular wall. Indeed, for large values of
 $l$
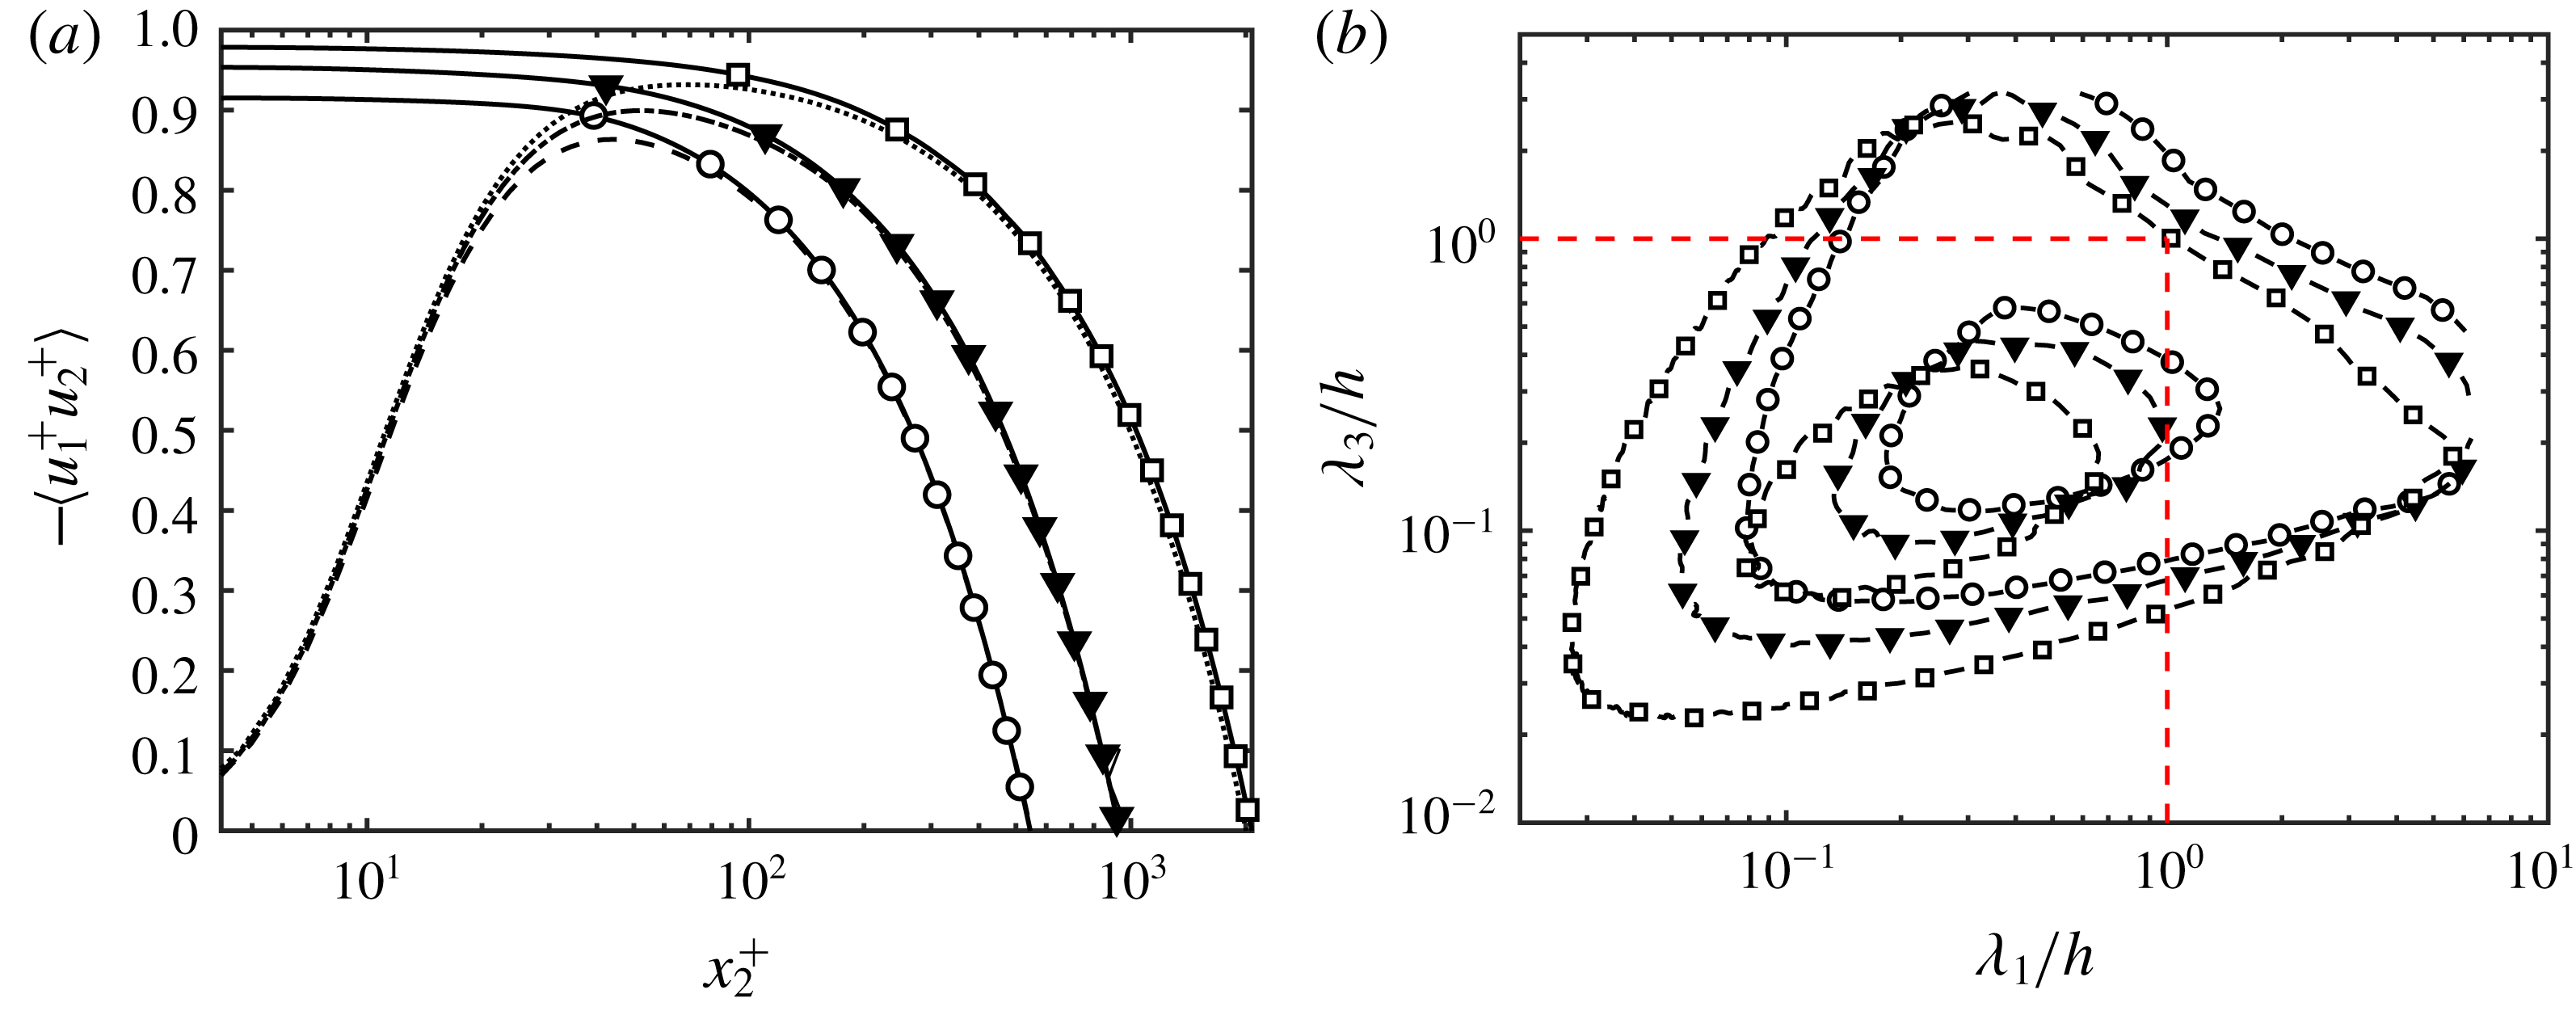
, (4.1) constitutes a significant modification of the classic no-slip boundary condition by suppressing the formation of near-wall viscous layers (Lozano-Durán & Bae Reference Lozano-Durán and Bae2016). The mean tangential Reynolds stress is shown in figure 6(a) for cases R550, R950 and R2000 with slip length
 $l=0.10h$
. For the three Reynolds numbers under consideration,
 $-\langle u_{1}u_{2}\rangle$
captures more than 90 % of the total stress, and this was the criterion used to select
 $l=0.10h$
as the reference slip length. As the Reynolds number increases, so does the contribution of
 $-\langle u_{1}u_{2}\rangle$
close to the wall at the expense of reducing the formation of near-wall viscous layers that appear prior to the proximity of the wall. Far from the boundaries, the tangential momentum flux is linear for the same reason as in wall-bounded channels, i.e. to balance the constant mean pressure gradient driving the flow. Cases R550-l1 and R550-l2 are for
 $l=0.25h$
and
 $l=0.50h$
, respectively, and are intended to test the effect of increasing slip lengths.
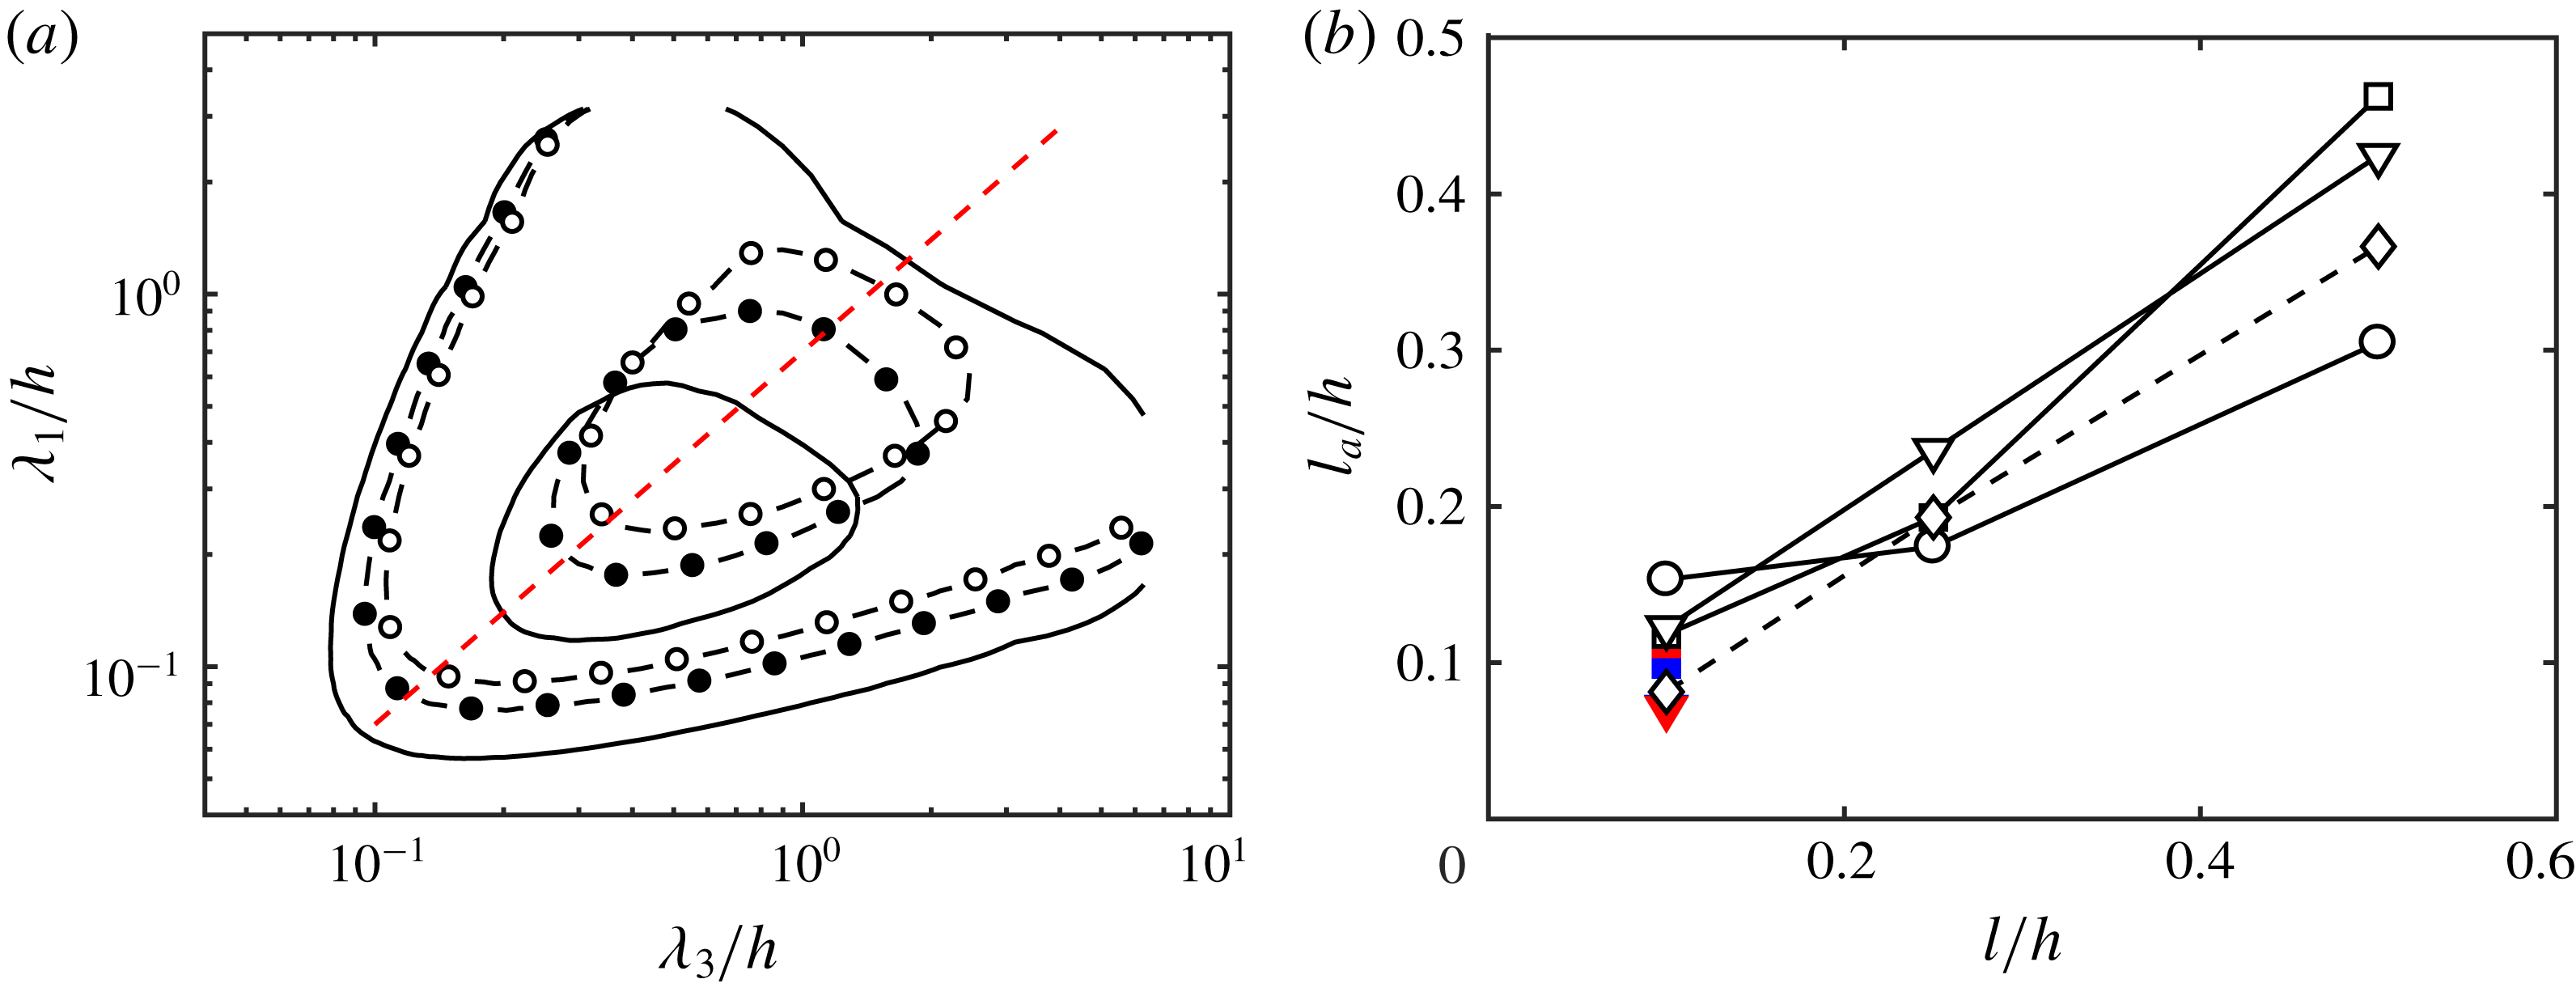
(a) Mean tangential Reynolds stress as a function of the wall-normal (or boundary-normal) coordinate for R550 (○), R950 (▾), R2000 (▫), NS550 (– – –), NS950 (– - – -) and NS2000 (
 $\cdots \cdots$
). (b) Premultiplied boundary-normal two-dimensional velocity spectra for Robin-bounded channels at
 $x_{2}/h=0$
. Contours are 0.1 and 0.6 of the maximum. The red dashed lines are
 $\unicode[STIX]{x1D706}_{1}/h=1$
and
 $\unicode[STIX]{x1D706}_{3}/h=1$
. Symbols are as in panel (a).

Another two important properties of the Robin boundary condition are that it allows for transpiration at all flow scales, and it does not encode any specific information regarding the linear wall-normal scaling of the log-layer eddies. The spectral density of the wall-normal velocity,
 $\unicode[STIX]{x1D719}_{22}$
, evaluated at
 $x_{2}/h=0$
for Robin-bounded cases is shown in figure 6(b) as a function of the streamwise and spanwise wavelengths,
 $\unicode[STIX]{x1D706}_{1}$
and
 $\unicode[STIX]{x1D706}_{3}$
, respectively. The spectra are non-zero at the boundary with a non-negligible contribution from wavelengths up to
 $\unicode[STIX]{x1D706}_{1}$
and
 $\unicode[STIX]{x1D706}_{3}$
of
 $O(h)$
. Moreover, the spectral energies obtained by integrating
 $\unicode[STIX]{x1D719}_{22}$
at
 $x_{2}/h=0$
are approximately
 $u_{\unicode[STIX]{x1D70F}}^{2}$
, that is, of the same order as the values in the bulk flow. This implies that the Robin boundary should alter the behaviour of eddies with sizes up to
 $O(h)$
if they are controlled by the distance to the wall as commonly hypothesised (Townsend Reference Townsend1976).
One could still argue that
 $\langle u_{2}|_{w}\rangle$
is zero, analogously to the scenario encountered for impermeable walls. However, note that this is also the case for
 $\langle u_{2}\rangle$
at each wall-normal location for a no-slip channel, and that (4.2), and hence
 $\langle u_{2}|_{w}\rangle =0$
, is just the immediate consequence of the symmetries of the channel flow configuration rather than a result of the impermeability constraint. The only reminiscence of the wall in the Robin boundary condition comes from the fact that, by construction of (4.1), the velocities and their corresponding boundary-normal derivatives are expected to show similar length scales in the vicinity of
 $x_{2}=0$
akin to the production and dissipation in the buffer region of a smooth wall.
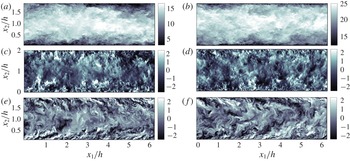
Instantaneous flow fields for the three velocity components at
 $Re_{\unicode[STIX]{x1D70F}}=2000$
for NS2000 and R2000 are compared in figure 7. The similarities between the two visualisations are striking, and their resemblance is confirmed by the quantitative analysis of the flow statistics presented in the following sections. Note that the Robin boundary condition is introduced in the present work just as a means to confine the flow within a boundary that differs from a no-slip wall, especially regarding transpiration. In this sense, the Robin boundary condition is just a tool and it does not aim to model any particular flow phenomena. Moreover, the focus of this paper lies on the outer region and we are less interested in the structure of the flow at the boundary. Nonetheless, a further characterisation of the flow at
 $x_{2}/h=0$
is provided in appendix B for completeness.
Instantaneous
 $x_{1}$
–
 $x_{2}$
planes of the streamwise (a,b), wall-normal (c,d) and spanwise (e,f) velocities for turbulent channels at
 $Re_{\unicode[STIX]{x1D70F}}=2000$
. (a,c,e) are for R2000, and (b,d,f) are for NS2000. The colour bars show velocity in wall units.

4.2 One-point statistics and spectra
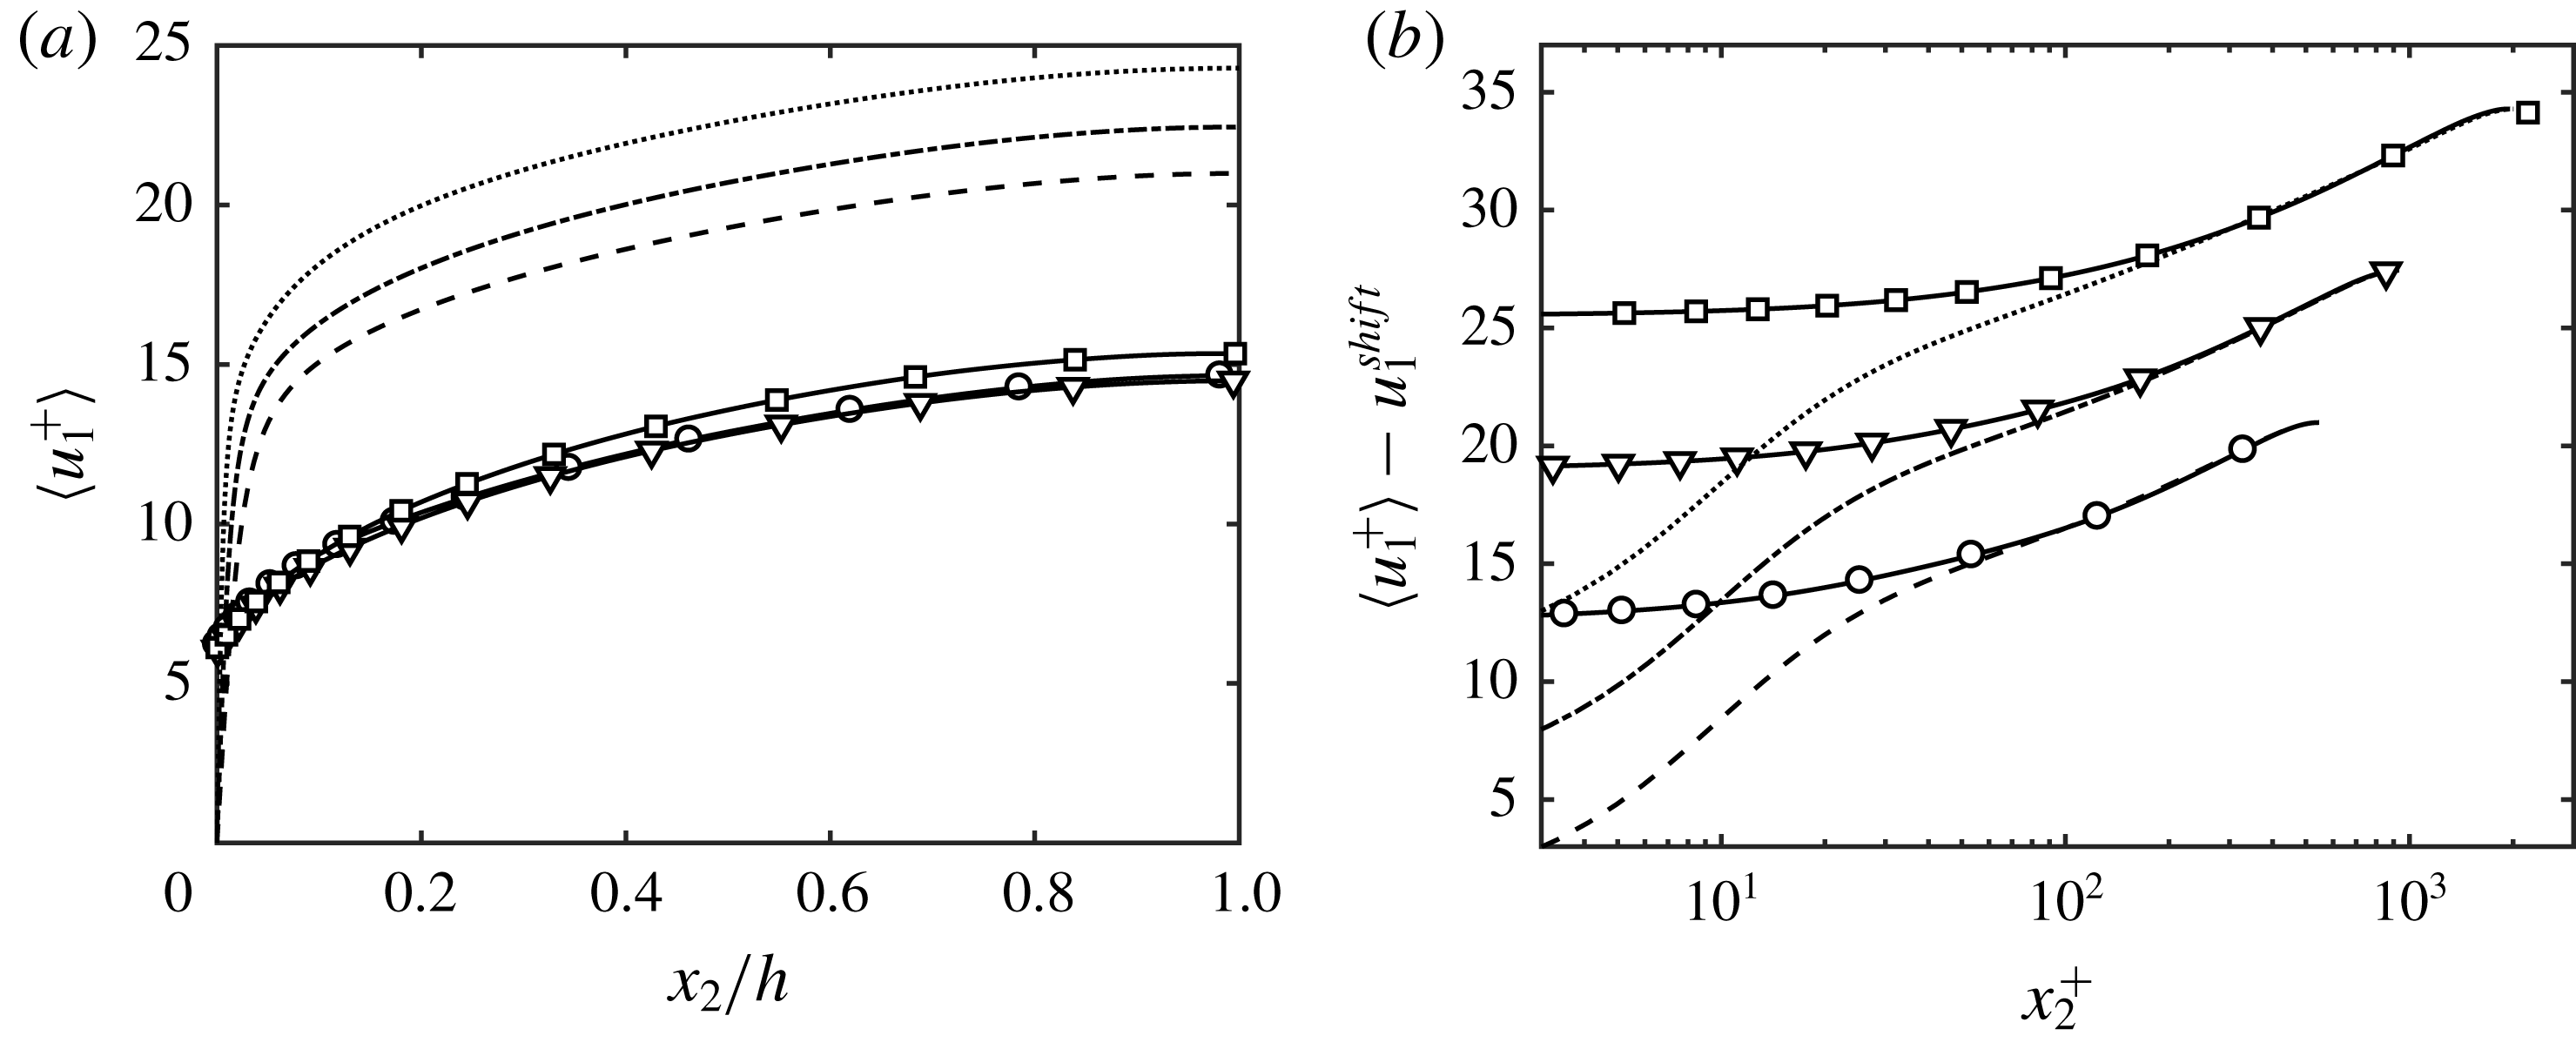
The mean streamwise velocities for the Robin-bounded and wall-bounded channel flows are compared in figure 8. In figure 8(b), the mean profiles for Robin-bounded cases are vertically displaced to match the centreline velocity of the corresponding no-slip case. A first observation is that the shape of
 $\langle u_{1}\rangle$
remains roughly identical for
 $x_{2}\gtrsim 0.10h$
, and the Robin boundary condition is mainly responsible for a reduction of the total mass flux. The shifts required to match the Robin-bounded cases to their no-slip counterpart were positive and equal to 6.4, 8.0 and 8.9 plus units for R550, R950 and R2000, respectively. Nonetheless, we will not emphasise these values, as they can be trivially changed either by adding a constant uniform velocity to the right-hand side of the Robin boundary condition (4.1), or by a Galilean transformation of the velocity field.
The observations from figure 8 can be connected to the law of the wall (Prandtl Reference Prandtl1925; von Kármán Reference von Kármán1930; Millikan Reference Millikan, Hartog and Peters1938; Townsend Reference Townsend1976),
 $$\begin{eqnarray}\langle u_{1}^{+}\rangle =\frac{1}{\unicode[STIX]{x1D705}}\log (x_{2}^{+})+B+\unicode[STIX]{x1D6F1},\end{eqnarray}$$
where
 $\unicode[STIX]{x1D705}$
and
 $B$
are the von Kármán and intercept constants for no-slip walls, respectively, and
 $\unicode[STIX]{x1D6F1}$
is an additional velocity displacement. The friction velocity for Robin-bounded cases is
 $u_{\unicode[STIX]{x1D70F}}=\sqrt{\unicode[STIX]{x1D708}\unicode[STIX]{x2202}\langle u_{1}\rangle /\unicode[STIX]{x2202}x_{2}-\langle u_{1}u_{2}\rangle }|_{x_{2}=0}$
. Hence, the Robin boundary condition introduces a non-zero tangential Reynolds stress at the wall, which acts as an effective drag with a major impact on
 $\unicode[STIX]{x1D6F1}$
(see Nikuradse Reference Nikuradse1933; Jiménez Reference Jiménez2004). On the other hand, we can hypothesise that the
 $x_{2}$
-dependent component,
 ${\sim}(1/\unicode[STIX]{x1D705})\log (x_{2})$
, is mainly controlled by the momentum flux for
 $x_{2}>0$
.
Mean streamwise velocity profiles as a function of
 $x_{2}$
in (a) linear scale and (b) logarithmic scale for R550 (○), R950 (▿), R2000 (▫), NS550 (– – –), NS950 (– - – -) and NS2000 (
 $\cdots \cdots$
). In panel (b), the velocity profiles of Robin-bounded cases are vertically shifted such that the centreline velocity coincides with their corresponding wall-bounded case. For clarity, profiles at
 $Re_{\unicode[STIX]{x1D70F}}\approx 950$
and
 $Re_{\unicode[STIX]{x1D70F}}\approx 2000$
are additionally shifted by 5 and 10 plus units, respectively.

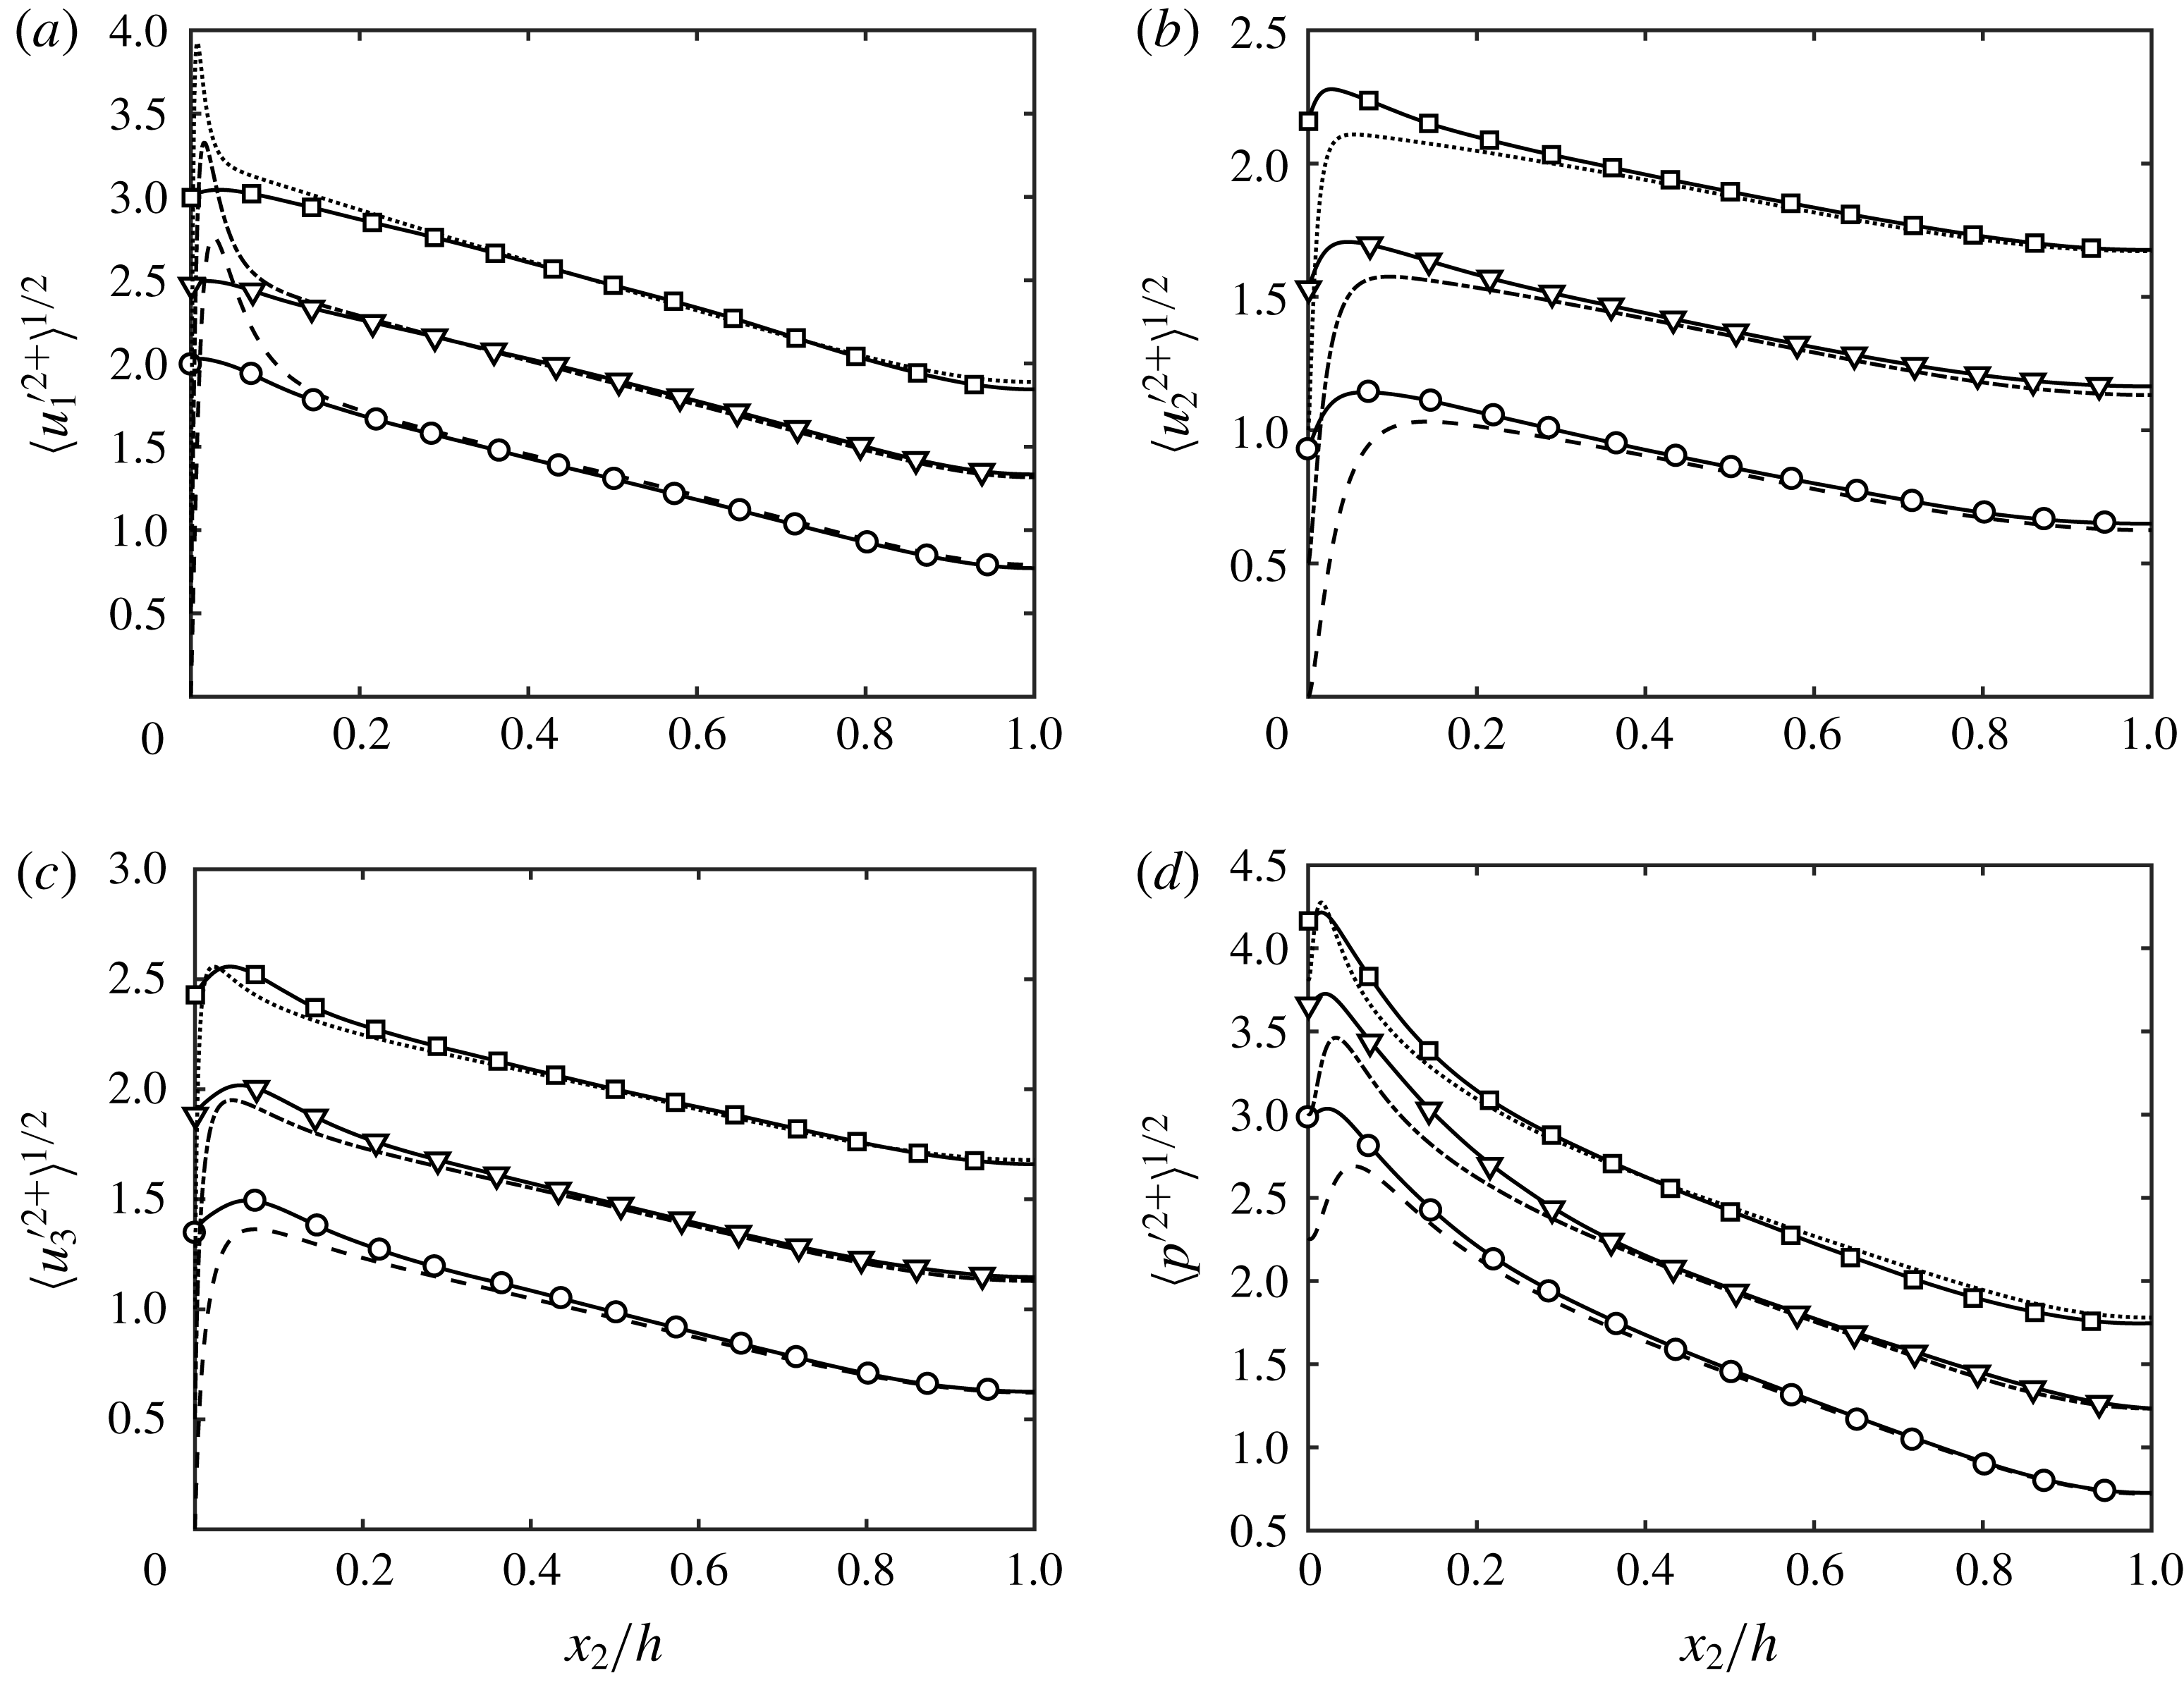
The r.m.s. velocity fluctuations for the Robin-bounded and wall-bounded channels are shown in figure 9(a–c). The lack of a near-wall peak at
 $x_{2}^{+}\approx 15$
for the Robin-bounded streamwise velocity fluctuations is a consequence of the interruption of the classic near-wall cycle (Jiménez & Moin Reference Jiménez and Moin1991; Jiménez & Pinelli Reference Jiménez and Pinelli1999), which is also confirmed by visual inspection of the instantaneous near-wall velocities (see appendix B). The most remarkable observation from figure 9 is that the Robin-bounded fluctuating velocities match quantitatively their wall-bounded counterparts for
 $x_{2}\gtrsim 0.10h$
despite the lack of impermeable walls. The presence of a significant non-zero
 $u_{2}$
in the Robin-bounded cases is evidenced by the r.m.s. of
 $u_{2}$
at
 $x_{2}/h=0$
whose values are comparable to the r.m.s. in the bulk flow. The result is again an indication that the total contribution of the different eddies to the turbulence intensities is insensitive to the presence of impermeable walls. The pressure fluctuations are also accurately reproduced in figure 9(d) for the Robin-bounded cases. The results may appear surprising due to the global nature of the pressure, which is more prone to being affected by the changes in the boundary condition. However, the most important contribution of the pressure is to guarantee local continuity among eddies, and the satisfactory collapse of the r.m.s. velocity fluctuations seen in figure 9(a–c) also implies equally fair results for the pressure fluctuations. This is in accordance with Sillero, Jiménez & Moser (Reference Sillero, Jiménez and Moser2014), who concluded from the pressure correlations in boundary layers that
 $p$
is dominated by localised regions of strongly coupled small-scale structures.
(a) Streamwise, (b) wall-normal (or boundary-normal) and (c) spanwise r.m.s. velocity fluctuations, and (d) r.m.s. pressure fluctuations for R550 (○), R950 (▿), R2000 (▫), NS550 (– – –), NS950 (– - – -) and NS2000 (
 $\cdots \cdots$
). In all panels, the profiles for cases at
 $Re_{\unicode[STIX]{x1D70F}}\approx 950$
and
 $Re_{\unicode[STIX]{x1D70F}}\approx 2000$
are vertically shifted by 0.5 and 1 plus units, respectively, for clarity.

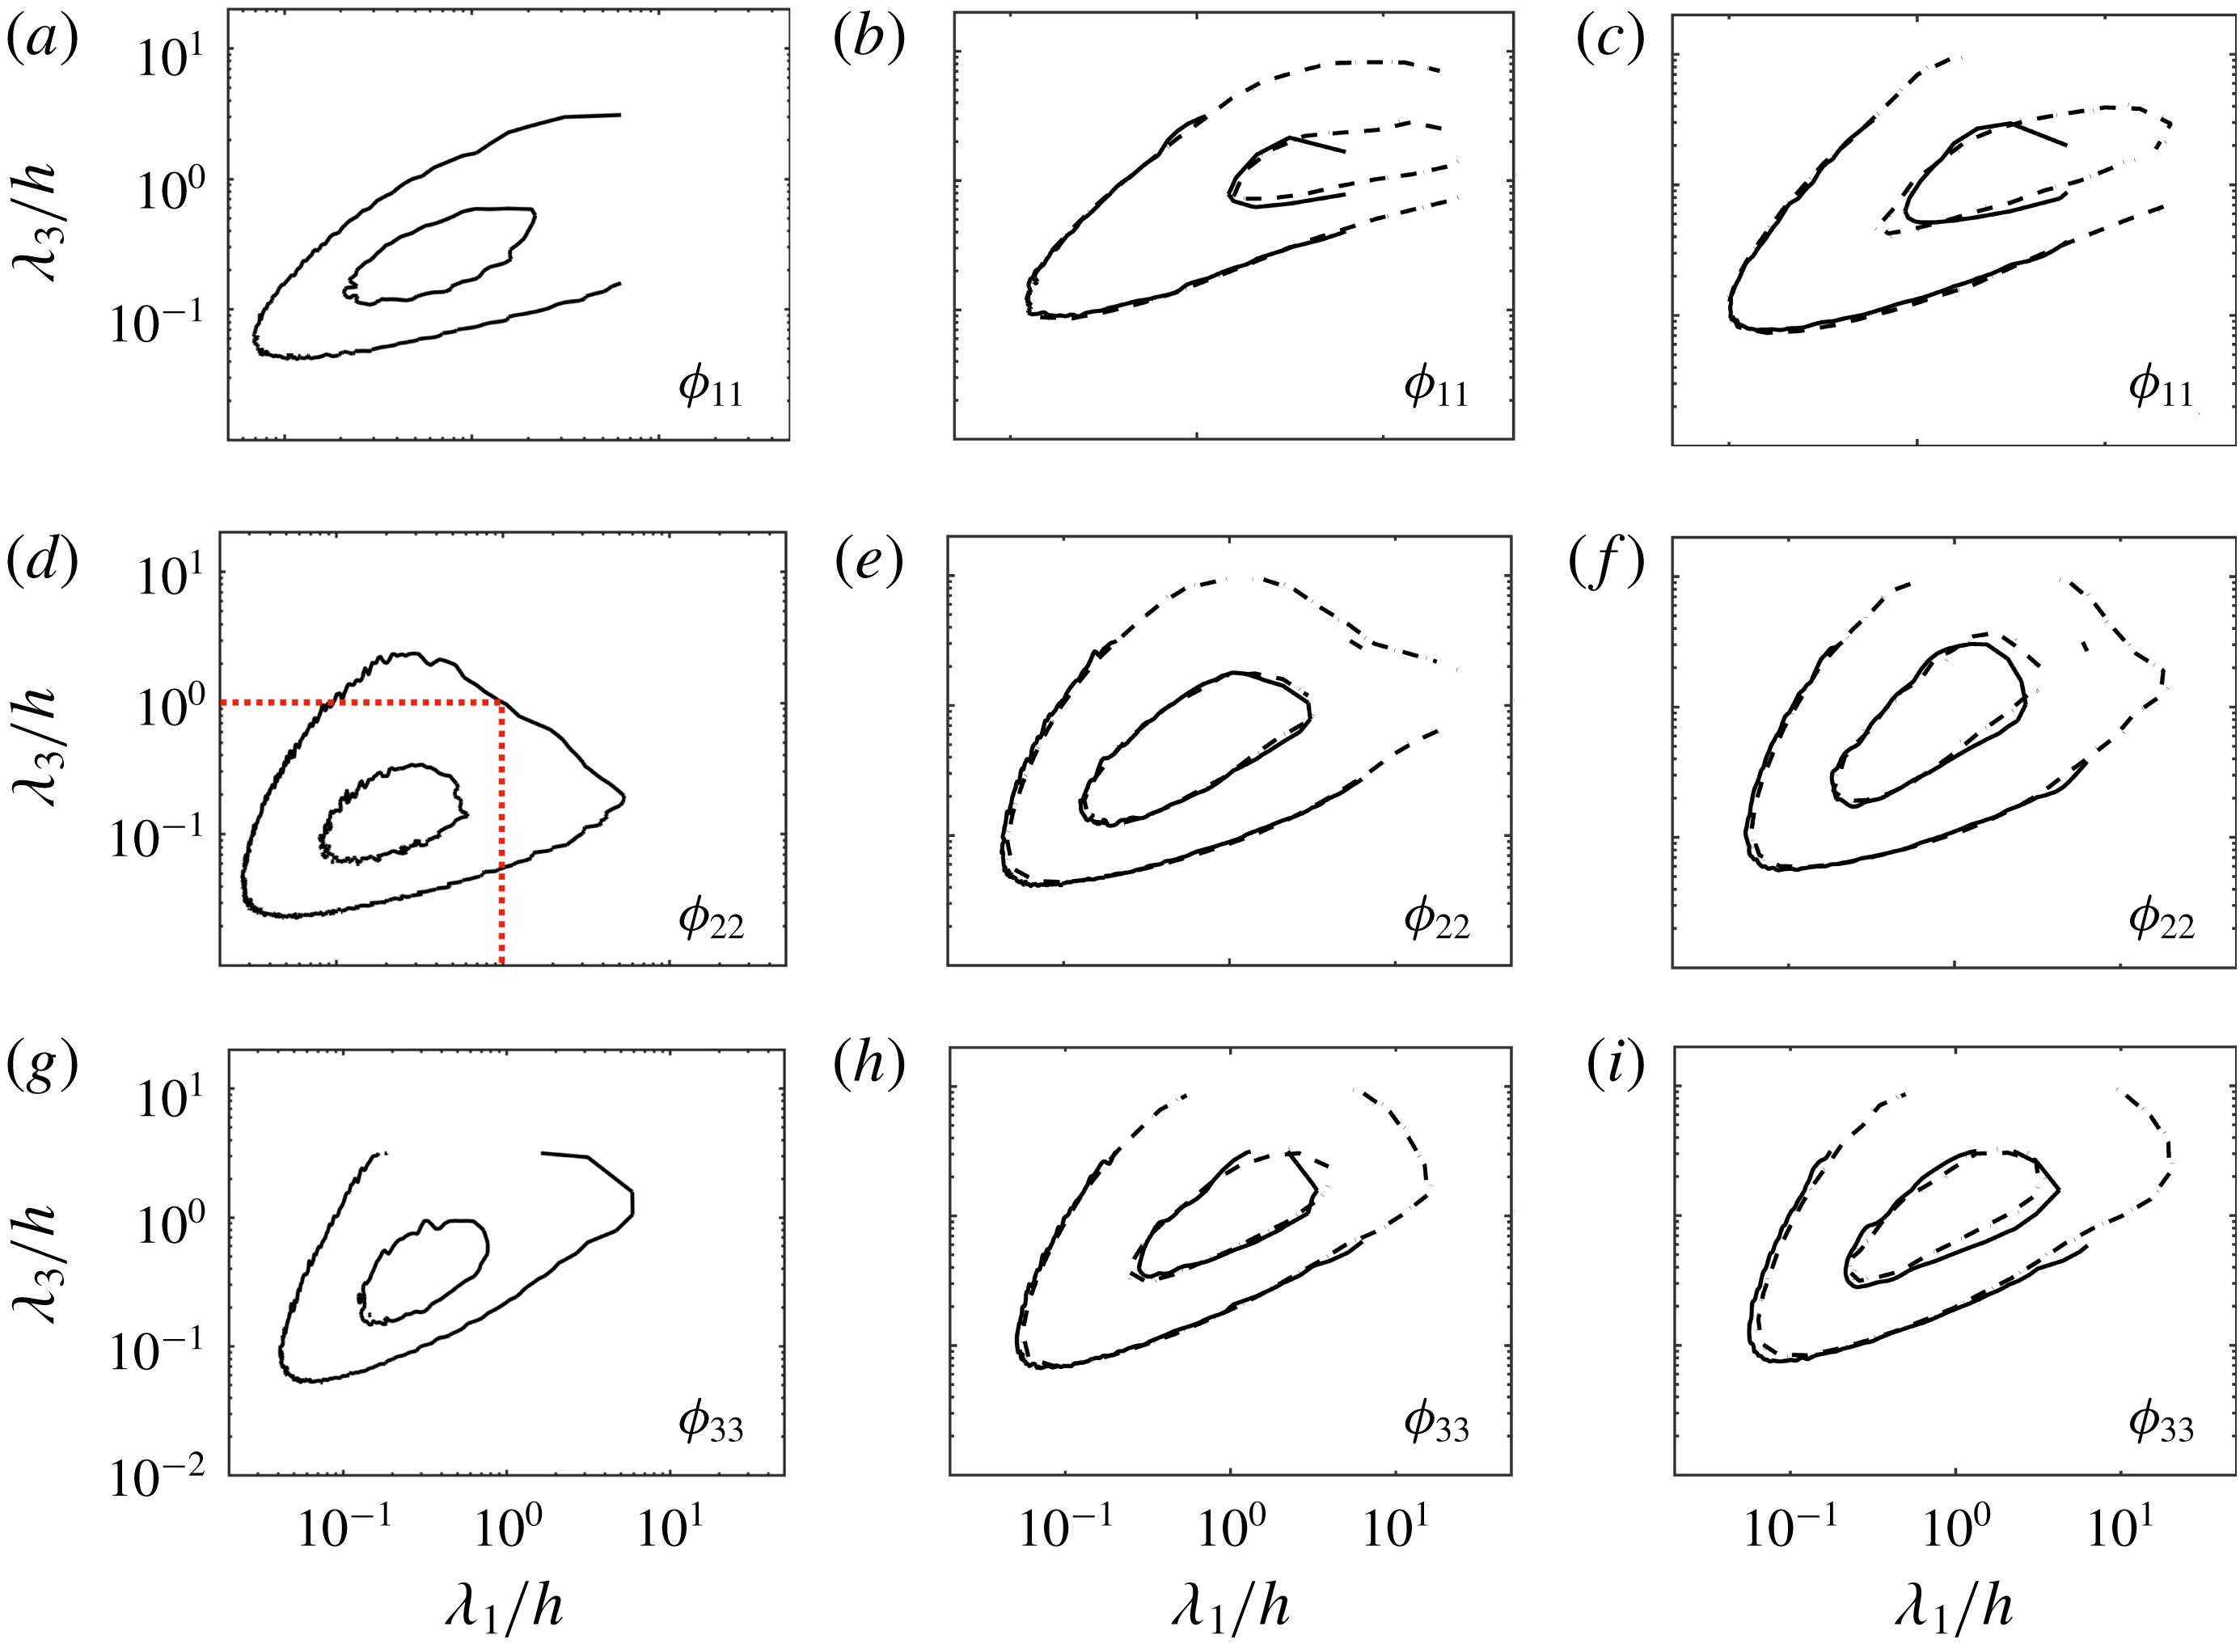
The spectral densities of the three velocity fluctuations,
 $\unicode[STIX]{x1D719}_{11}$
,
 $\unicode[STIX]{x1D719}_{22}$
and
 $\unicode[STIX]{x1D719}_{33}$
, are shown in figure 10 as a function of the streamwise and spanwise wavelengths. Several wall-normal heights are considered for R2000 and NS2000. The spectra for wall-bounded cases are zero at
 $x_{2}/h=0$
. Conversely,
 $\unicode[STIX]{x1D719}_{22}$
is non-zero at the boundary for the Robin-bounded case, and peaks at
 $\unicode[STIX]{x1D706}_{1}\approx 0.3h$
and
 $\unicode[STIX]{x1D706}_{3}\approx 0.10h$
, with a non-negligible contribution from wavelengths up to
 $\unicode[STIX]{x1D706}_{1}$
and
 $\unicode[STIX]{x1D706}_{3}$
of
 $O(h)$
. We can then estimate the flow scales that are expected to be affected by the transpiration of the boundary by assuming that the stress-carrying eddies follow
 $\unicode[STIX]{x1D706}_{1}\approx 1.5x_{2}$
and
 $\unicode[STIX]{x1D706}_{3}\approx x_{2}$
(as shown below in § 4.5). If the boundary is perceived as permeable for scales up to
 $O(h)$
, then attached motions below
 $x_{2}\approx 0.7h$
should adjust accordingly to accommodate transpiration effects, especially if they are organised by the wall. However, inspection of the spectra above
 $x_{2}\approx 0.10h$
shows that the agreement between wall-bounded and Robin-bounded channels is outstanding (figure 10
b,c,e,f,h,i). Consequently, the distance to the boundary (or non-existent wall) is not the relevant length scale controlling the size of the attached eddies, in contrast with the traditional argument by Townsend (Reference Townsend1976). Instead, the resemblance between wall-bounded and Robin-bounded cases presented above should be attributed to the common momentum transfer
 $u_{\unicode[STIX]{x1D70F}}^{2}$
characteristic of both cases as argued in § 2.
Wall-parallel premultiplied streamwise (a–c), wall-normal (or boundary-normal) (d–f) and spanwise (g–i) velocity spectra for R2000 (——) and NS2000 (– – –). The wall-normal (or boundary-normal) locations are
 $x_{2}^{+}=0$
(a,d,g),
 $x_{2}^{+}=1001$
(b,e,h) and
 $x_{2}^{+}=2003$
(c,f,i). Contours are 0.1 and 0.6 of the maximum. The red dotted lines in (d) are
 $\unicode[STIX]{x1D706}_{1}/h=1$
and
 $\unicode[STIX]{x1D706}_{3}/h=1$
.

It also worth noting that the excellent agreement of the one-point statistics and spectra occurs in spite of the absence of very-large-scale motions longer than
 ${\sim}6h$
(Guala et al.
Reference Guala, Hommema and Adrian2006; Balakumar & Adrian Reference Balakumar and Adrian2007) that do not fit within the limited computational domain of the present simulations. The result is consistent with Flores & Jiménez (Reference Flores and Jiménez2010) and Lozano-Durán & Jiménez (Reference Lozano-Durán and Jiménez2014a
), and scales larger than
 ${\sim}6h$
can be essentially modelled as infinitely long (due to the streamwise periodicity of the channel) while still interacting correctly with the smaller well-resolved eddies.
4.3 Existence of a virtual wall versus adaptation layer from the boundary
It could still be argued that the flow is influenced by an effective virtual wall whose origin is vertically displaced with respect to the boundary. In that case, different values of the slip length
 $l$
would be accompanied by changes in the origin of the virtual wall. The virtual-wall argument, often invoked in roughness studies (Raupach, Antonia & Rajagopalan Reference Raupach, Antonia and Rajagopalan1991; Jiménez Reference Jiménez2004), proved not to be necessary in § 4.2, where it was shown that the flow recovers above some wall-normal distance,
 $l_{a}$
, without requiring a shift in
 $x_{2}$
. Nevertheless, the position of the hypothetical virtual wall,
 $\unicode[STIX]{x1D6FF}x_{2}$
, can be estimated by a least-squares fit of the mean velocity profile to the logarithmic law (Raupach et al.
Reference Raupach, Antonia and Rajagopalan1991),
 $$\begin{eqnarray}\langle u_{1}^{+}\rangle =\frac{1}{\unicode[STIX]{x1D705}}\log (x_{2}^{+}-\unicode[STIX]{x1D6FF}x_{2}^{+})+B-\unicode[STIX]{x1D6E5}\langle u_{1}^{+}\rangle ,\end{eqnarray}$$
with
 $\unicode[STIX]{x1D705}=0.392$
and
 $B=4.48$
(Luchini Reference Luchini2017), within the range
 $x_{2}\in [0.1h,0.2h]$
. For this purpose, we will consider two additional cases with
 $l=0.25h$
and
 $l=0.50h$
at
 $Re_{\unicode[STIX]{x1D70F}}\approx 550$
, labelled respectively as R550-l1 and R550-l2 in table 2. The spectral density
 $\unicode[STIX]{x1D719}_{22}$
for the three different slip lengths is reported in figure 11(a) at
 $x_{2}/h=0$
. As
 $l$
increases, the spectrum moves towards higher wavelengths along the ridge
 $\unicode[STIX]{x1D706}_{1}\sim \unicode[STIX]{x1D706}_{3}$
, and transpiration is allowed for larger scales, which in principle should change the location of the virtual wall. However, the virtual wall offset computed with (4.4) is
 $\unicode[STIX]{x1D6FF}x_{2}^{+}\approx O(10)$
for all the Robin-bounded cases in table 2, which is not significant enough to alter in a meaningful manner the energy-containing eddies populating the log layer. Furthermore, when the
 $x_{2}$
direction was remapped into
 $\tilde{x}_{2}=x_{2}+\unicode[STIX]{x1D6FF}x_{2}(1-x_{2}/h)$
(Flores & Jiménez Reference Flores and Jiménez2006), the collapse of the r.m.s. velocity fluctuations worsened despite the minor improvements in
 $\langle u_{1}\rangle$
. Consequently, the results do not comply with the existence of a virtual wall. Note that the same conclusion does not apply to the viscous eddies close to the wall with sizes comparable to
 $\unicode[STIX]{x1D6FF}x_{2}$
, where changes in the permeability of the boundary are expected to have a considerable impact on the near-wall flow dynamics as typically described in flow control strategies (Choi, Moin & Kim Reference Choi, Moin and Kim1994; Abderrahaman-Elena & García-Mayoral Reference Abderrahaman-Elena and García-Mayoral2017).
Instead of a virtual wall, we analyse the results assuming the existence of an adaptation layer from the boundary. The vertical distance from the boundary above which the flow recovers to the nominal no-slip flow statistics,
 $l_{a}$
, is plotted in figure 11(b) and is referred to as the adaptation length. More specifically,
 $l_{a}$
is defined as the maximum boundary-normal distance from which
 $$\begin{eqnarray}{\mathcal{E}}^{+}(x_{2})=|\unicode[STIX]{x1D713}^{+}(x_{2})-\unicode[STIX]{x1D713}_{NS}^{+}(x_{2})|<\unicode[STIX]{x1D6FC},\end{eqnarray}$$
where the subscript NS denotes variables for no-slip cases, and
 $\unicode[STIX]{x1D713}$
takes the value of
 $\langle u_{1}\rangle$
or
 $\langle {u_{i}^{\prime }}^{2}\rangle ^{1/2}$
with
 $i=1,2,3$
, depending on whether the adaptation length refers to the recovery of the mean velocity profile, or the streamwise, boundary-normal or spanwise r.m.s. velocity fluctuations, respectively. The thresholding error
 $\unicode[STIX]{x1D6FC}$
is set to be equal to 0.5 plus units for the mean profile and 0.1 for the r.m.s. velocity fluctuations. The results show that the flow statistics collapse to the corresponding no-slip channel above
 $l_{a}\sim l$
for the quantities assessed and various Reynolds numbers. The selected values of
 $\unicode[STIX]{x1D6FC}$
are admittedly arbitrary and other choices may be preferred without any major consequences other than a vertical shift of the adaptation length in figure 11(b).
(a) Wall-parallel premultiplied boundary-normal velocity spectra at
 $x_{2}^{+}=0$
for R550 (——), R550-l1 (○) and R550-l2 (●). Contours are 0.1 and 0.6 of the maximum. The red dashed line is
 $\unicode[STIX]{x1D706}_{3}=0.7\unicode[STIX]{x1D706}_{1}$
. (b) Adaptation length
 $l_{a}$
for the mean velocity profile (♢), and r.m.s. streamwise (○), boundary-normal (▫) and spanwise (▿) velocity fluctuations as a function of the slip length
 $l$
. Colours are black for R550, blue for R950 and red for R2000.

Then, results from figure 11(b) can be interpreted without the need of a virtual wall if the boundary condition is understood as a flow distortion stirred by the turbulent background for a depth
 $l_{a}^{2}\sim \unicode[STIX]{x1D708}_{t}t$
during a time period of
 $t\sim l_{a}/\langle u_{2}^{2}\rangle ^{1/2}$
, where
 $\unicode[STIX]{x1D708}_{t}$
is the eddy viscosity. Assuming that
 $\unicode[STIX]{x1D708}_{t}\sim \langle u_{1}u_{2}\rangle /\langle \unicode[STIX]{x2202}u_{1}/\unicode[STIX]{x2202}x_{2}\rangle$
, and that the flow follows (4.1) within the adaptation layer defined by
 $x_{2}\lesssim l_{a}$
, then
 $$\begin{eqnarray}l_{a}\sim \frac{\langle u_{1}u_{2}\rangle }{\langle u_{2}^{2}\rangle ^{1/2}\left\langle {\displaystyle \frac{\unicode[STIX]{x2202}u_{1}}{\unicode[STIX]{x2202}x_{2}}}\right\rangle }\approx l\frac{\left\langle {\displaystyle \frac{\unicode[STIX]{x2202}u_{1}}{\unicode[STIX]{x2202}x_{2}}}{\displaystyle \frac{\unicode[STIX]{x2202}u_{2}}{\unicode[STIX]{x2202}x_{2}}}\right\rangle }{\left\langle \left({\displaystyle \frac{\unicode[STIX]{x2202}u_{2}}{\unicode[STIX]{x2202}x_{2}}}\right)^{2}\right\rangle ^{1/2}\left\langle {\displaystyle \frac{\unicode[STIX]{x2202}u_{1}}{\unicode[STIX]{x2202}x_{2}}}\right\rangle },\end{eqnarray}$$
from where it is reasonable to assume that
 $l_{a}\sim l$
in first-order approximation, consistent with the results reported in figure 11(b). The existence of this adaptation layer due to the imposition of an unphysical Robin boundary condition together with the observations from previous sections suggest that both the Robin-bounded and wall-bounded channels share identical flow motions for
 $x_{2}>l_{a}$
once the disturbance by the boundary vanishes.
4.4 Logarithmic layer without inner–outer scale separation
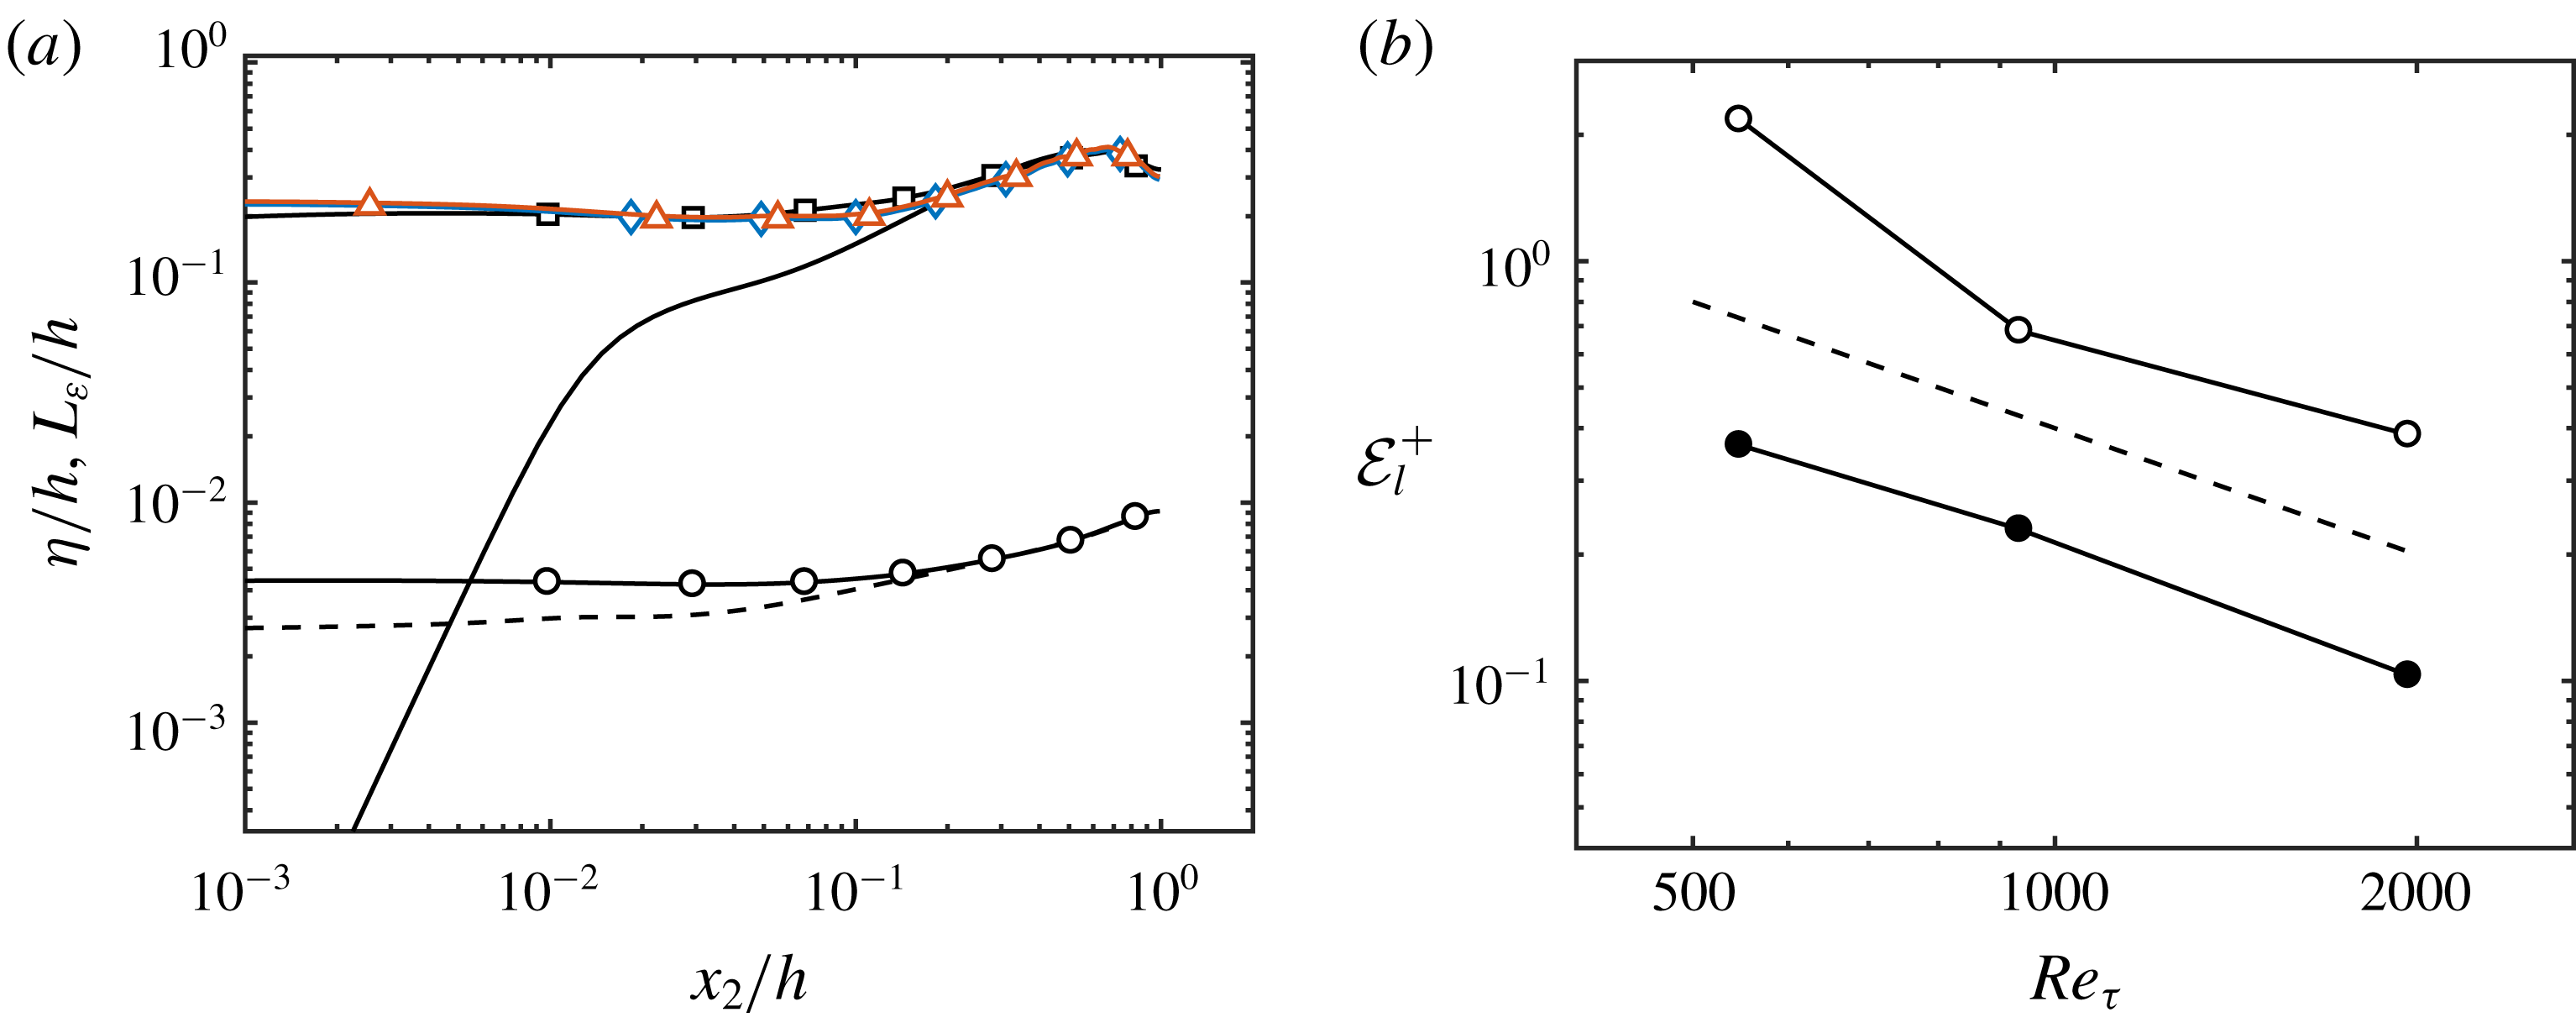
The Robin boundary condition from (4.1) imposes a new length scale to the eddies in the near-wall region. The characteristic flow length scales of the no-slip and Robin-bounded channels are plotted in figure 12(a) as a function of
 $x_{2}$
. The small and large scales are represented by the Kolmogorov length scale
 $\unicode[STIX]{x1D702}=(\unicode[STIX]{x1D708}^{3}/\unicode[STIX]{x1D700})^{1/4}$
and the integral length scale
 $L_{\unicode[STIX]{x1D700}}=(2k/3)^{3/2}/\unicode[STIX]{x1D700}$
, respectively, where
 $\unicode[STIX]{x1D700}$
is the rate of kinetic energy dissipation and
 $k$
is the turbulence kinetic energy. Note that
 $L_{\unicode[STIX]{x1D700}}$
drops rapidly to zero as
 $x_{2}$
approaches the wall for the no-slip channel, whereas it remains roughly constant in the Robin-bounded cases. Moreover, the comparison of
 $L_{\unicode[STIX]{x1D700}}$
at three different
 $Re_{\unicode[STIX]{x1D70F}}$
for the Robin-bounded channels shows that the integral length scale collapses in outer units across the entire boundary-layer thickness, including the region close to
 $x_{2}/h=0$
. These results can be read as the disruption of the classic viscous scaling of the active energy-containing eddies at the wall, i.e. their sizes are a fixed fraction of
 $h$
and do not decrease with
 $Re_{\unicode[STIX]{x1D70F}}$
.
(a) Kolmogorov length scale
 $\unicode[STIX]{x1D702}$
for NS550 (– – –) and R550 (○), and integral length scale
 $L_{\unicode[STIX]{x1D700}}$
for NS550 (——), R550 (▫), R950 (♢) and R2000 (▵). (b)
 ${\mathcal{E}}_{l}$
as a function of
 $Re_{\unicode[STIX]{x1D70F}}$
. Closed and open symbols are for wall-bounded and Robin-bounded cases, respectively. The dashed line is
 ${\mathcal{E}}_{l}^{+}\sim Re_{\unicode[STIX]{x1D70F}}^{-1}$
.

In spite of the lack of inner–outer layer scale separation with increasing
 $Re_{\unicode[STIX]{x1D70F}}$
, the mean velocity profile for Robin-bounded cases (figure 8
a) tends towards a log layer as in wall-bounded channels. This is quantified in figure 12(b), which contains the error function
 $$\begin{eqnarray}{\mathcal{E}}_{l}^{+}=\left[\frac{1}{0.1}\int _{0.1}^{0.2}\left(x_{2}^{+}\frac{\unicode[STIX]{x2202}\langle u_{1}^{+}\rangle }{\unicode[STIX]{x2202}x_{2}^{+}}-\frac{1}{\unicode[STIX]{x1D705}}-\frac{x_{2}}{h}\right)^{2}\text{d}(x_{2}/h)\right]^{1/2},\end{eqnarray}$$
with
 $\unicode[STIX]{x1D705}=0.384$
(Lee & Moser Reference Lee and Moser2015) as a function of
 $Re_{\unicode[STIX]{x1D70F}}$
. Equation (4.7) measures the deviation of
 $x_{2}^{+}\unicode[STIX]{x2202}\langle u_{1}^{+}\rangle /\unicode[STIX]{x2202}x_{2}^{+}$
with respect to its asymptotic value for a well-developed log layer,
 $1/\unicode[STIX]{x1D705}-x_{2}/h$
, within the range
 $x_{2}/h\in [0.1,0.2]$
. The asymptotic value of
 $x_{2}^{+}\unicode[STIX]{x2202}\langle u_{1}^{+}\rangle /\unicode[STIX]{x2202}x_{2}^{+}$
has been derived by several authors using matched asymptotic expansions (Mellor Reference Mellor1972; Afzal & Yajnik Reference Afzal and Yajnik1973; Afzal Reference Afzal1976; Phillips Reference Phillips1987; Jiménez & Moser Reference Jiménez and Moser2007),
 $$\begin{eqnarray}x_{2}^{+}\frac{\unicode[STIX]{x2202}\langle u_{1}^{+}\rangle }{\unicode[STIX]{x2202}x_{2}^{+}}\approx \frac{1}{\unicode[STIX]{x1D705}}+\frac{x_{2}}{h}+\frac{\tilde{\unicode[STIX]{x1D6FD}}}{Re_{\unicode[STIX]{x1D70F}}},\end{eqnarray}$$
with
 $\tilde{\unicode[STIX]{x1D6FD}}$
a Reynolds-number-independent constant. The results, plotted in figure 12(b), show that
 ${\mathcal{E}}_{l}$
is larger for Robin-bounded cases than for wall-bounded cases, but both set-ups converge to the expected value at a rate close to
 $Re_{\unicode[STIX]{x1D70F}}^{-1}$
as predicted by (4.8). The fact that Robin-bounded cases approach a logarithmic profile for increasing
 $Re_{\unicode[STIX]{x1D70F}}$
without the inner–outer scale separation challenges the log-layer formulations derived from Millikan’s argument (see, among others, Millikan Reference Millikan, Hartog and Peters1938; Wosnik et al.
Reference Wosnik, Castillo and George2000; Oberlack Reference Oberlack2001; Buschmann & Gad-el Hak Reference Buschmann and Gad-el Hak2003). Nonetheless, the Reynolds numbers in the present work are too low to attain a well-developed log layer, and therefore the results are indicative but not conclusive of the convergence of Robin-bounded cases to an actual wall-bounded log layer. As we are concerned with the outer layer, the analysis above was performed for a range of wall-normal distances fixed in outer units,
 $x_{2}/h\in [0.1,0.2]$
, and the slip length set to a given fraction of
 $h$
. The effect of keeping the slip length constant in wall units as
 $Re_{\unicode[STIX]{x1D70F}}$
increases is discussed in appendix C, where we show the development of the log layer in the wall-normal direction.
4.5 Wall-attached eddies without walls
A more detailed analysis of the size of the eddies is provided by the investigation of three-dimensional regions of the flow where a quantity of interest is particularly intense. We focus on the regions of high momentum transfer from Lozano-Durán, Flores & Jiménez (Reference Lozano-Durán, Flores and Jiménez2012) (see also Lozano-Durán & Jiménez Reference Lozano-Durán and Jiménez2014b ; Lozano-Durán & Borrell Reference Lozano-Durán and Borrell2016), defined as spatially connected points in the flow satisfying
 $$\begin{eqnarray}-u_{1}^{\prime }u_{2}^{\prime }>H\langle {u_{1}^{\prime }}^{2}\rangle ^{1/2}\langle {u_{2}^{\prime }}^{2}\rangle ^{1/2},\end{eqnarray}$$
where
 $u_{1}^{\prime }u_{2}^{\prime }$
is the instantaneous pointwise fluctuating tangential Reynolds stress, and
 $H$
is a thresholding parameter equal to 1.75 obtained from a percolation analysis (Moisy & Jiménez Reference Moisy and Jiménez2004). Three-dimensional structures are then constructed by connecting neighbouring grid points fulfilling relation (4.9) and using the six-connectivity criterion (Rosenfeld & Kak Reference Rosenfeld and Kak1982). The cases under investigation are NS2000 and R2000, and the total number of structures identified is of the order of
 $10^{6}$
. Since we are interested in the outer-layer eddies, the region
 $x_{2}^{+}<100$
was excluded from case NS2000 in order to avoid spurious contributions from the viscous layer that are not present in R2000. This is consistent with Dong et al. (Reference Dong, Lozano-Durán, Sekimoto and Jiménez2017), who showed that objects identified by (4.9) are artificially elongated in the streamwise direction when the region below
 $x_{2}^{+}=100$
is included.
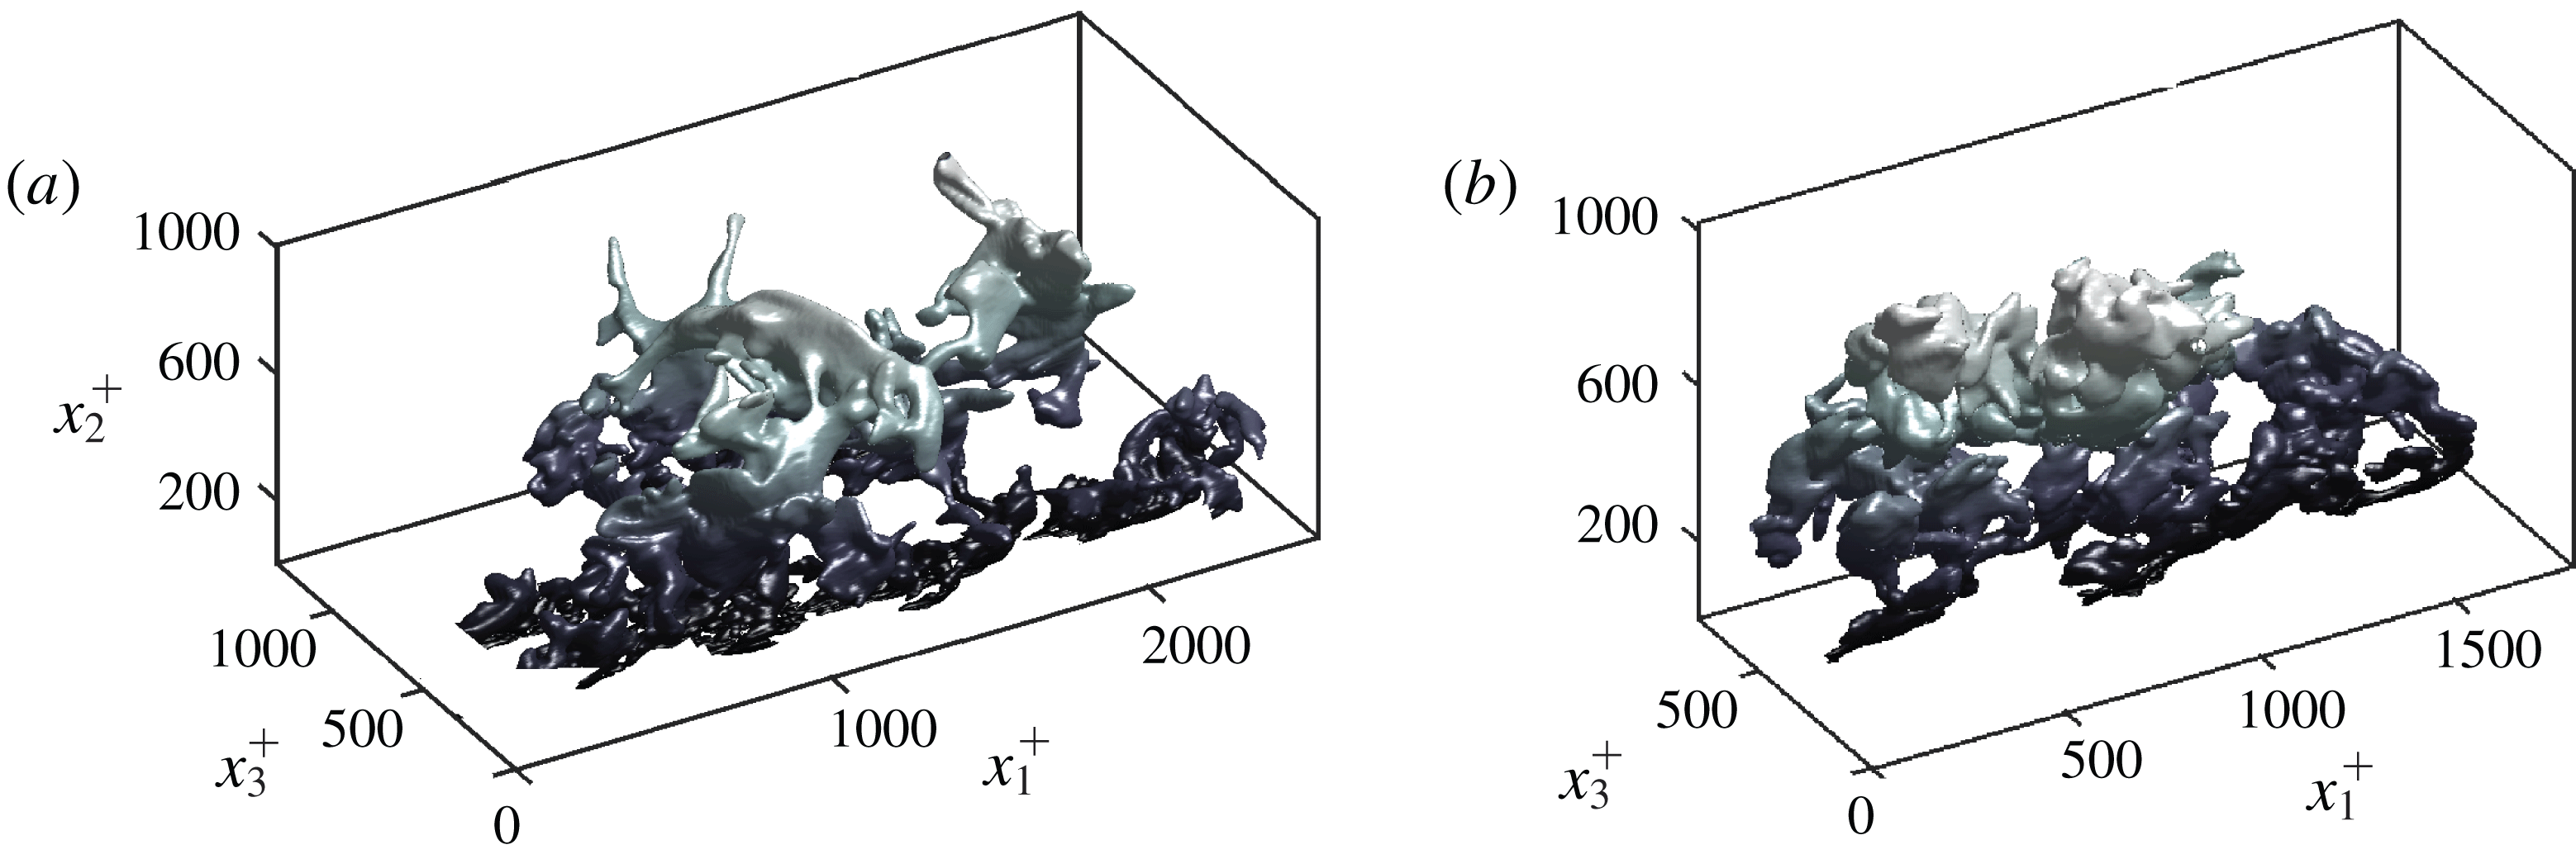
Figure 13 shows two examples of actual objects extracted from NS2000 and R2000, and underlines the complex geometries that may arise. Although visual impressions should not substitute statistical analysis, the comparison between the two examples reinforces the idea that the structures in Robin-bounded and wall-bounded channels are comparatively similar.
Example of instantaneous three-dimensional momentum transfer structures extracted from R2000 (a) and NS2000 (b). The mean flow is from bottom left to top right. Axes are normalised in plus units. The colour gradient indicates distance to the wall/boundary.

Lozano-Durán et al. (Reference Lozano-Durán, Flores and Jiménez2012) and Lozano-Durán & Jiménez (Reference Lozano-Durán and Jiménez2014b
) showed that objects defined by (4.9) are responsible for most of the momentum transfer in the log layer, justifying the choice of intense regions of
 $u_{1}^{\prime }u_{2}^{\prime }$
as representative structures of the flow. Moreover, these regions are geometrically and temporally self-similar and can be considered as sensible contenders for the active wall-attached eddies envisioned by Townsend (Reference Townsend1976). Therefore, it is interesting to compare the geometry of these structures in wall-bounded and Robin-bounded channel flows. The sizes of the objects are measured by circumscribing each structure within a box aligned to the Cartesian axes, whose streamwise, wall-normal (or boundary-normal) and spanwise sizes are denoted by
 $\unicode[STIX]{x1D6E5}_{1}$
,
 $\unicode[STIX]{x1D6E5}_{2}$
and
 $\unicode[STIX]{x1D6E5}_{3}$
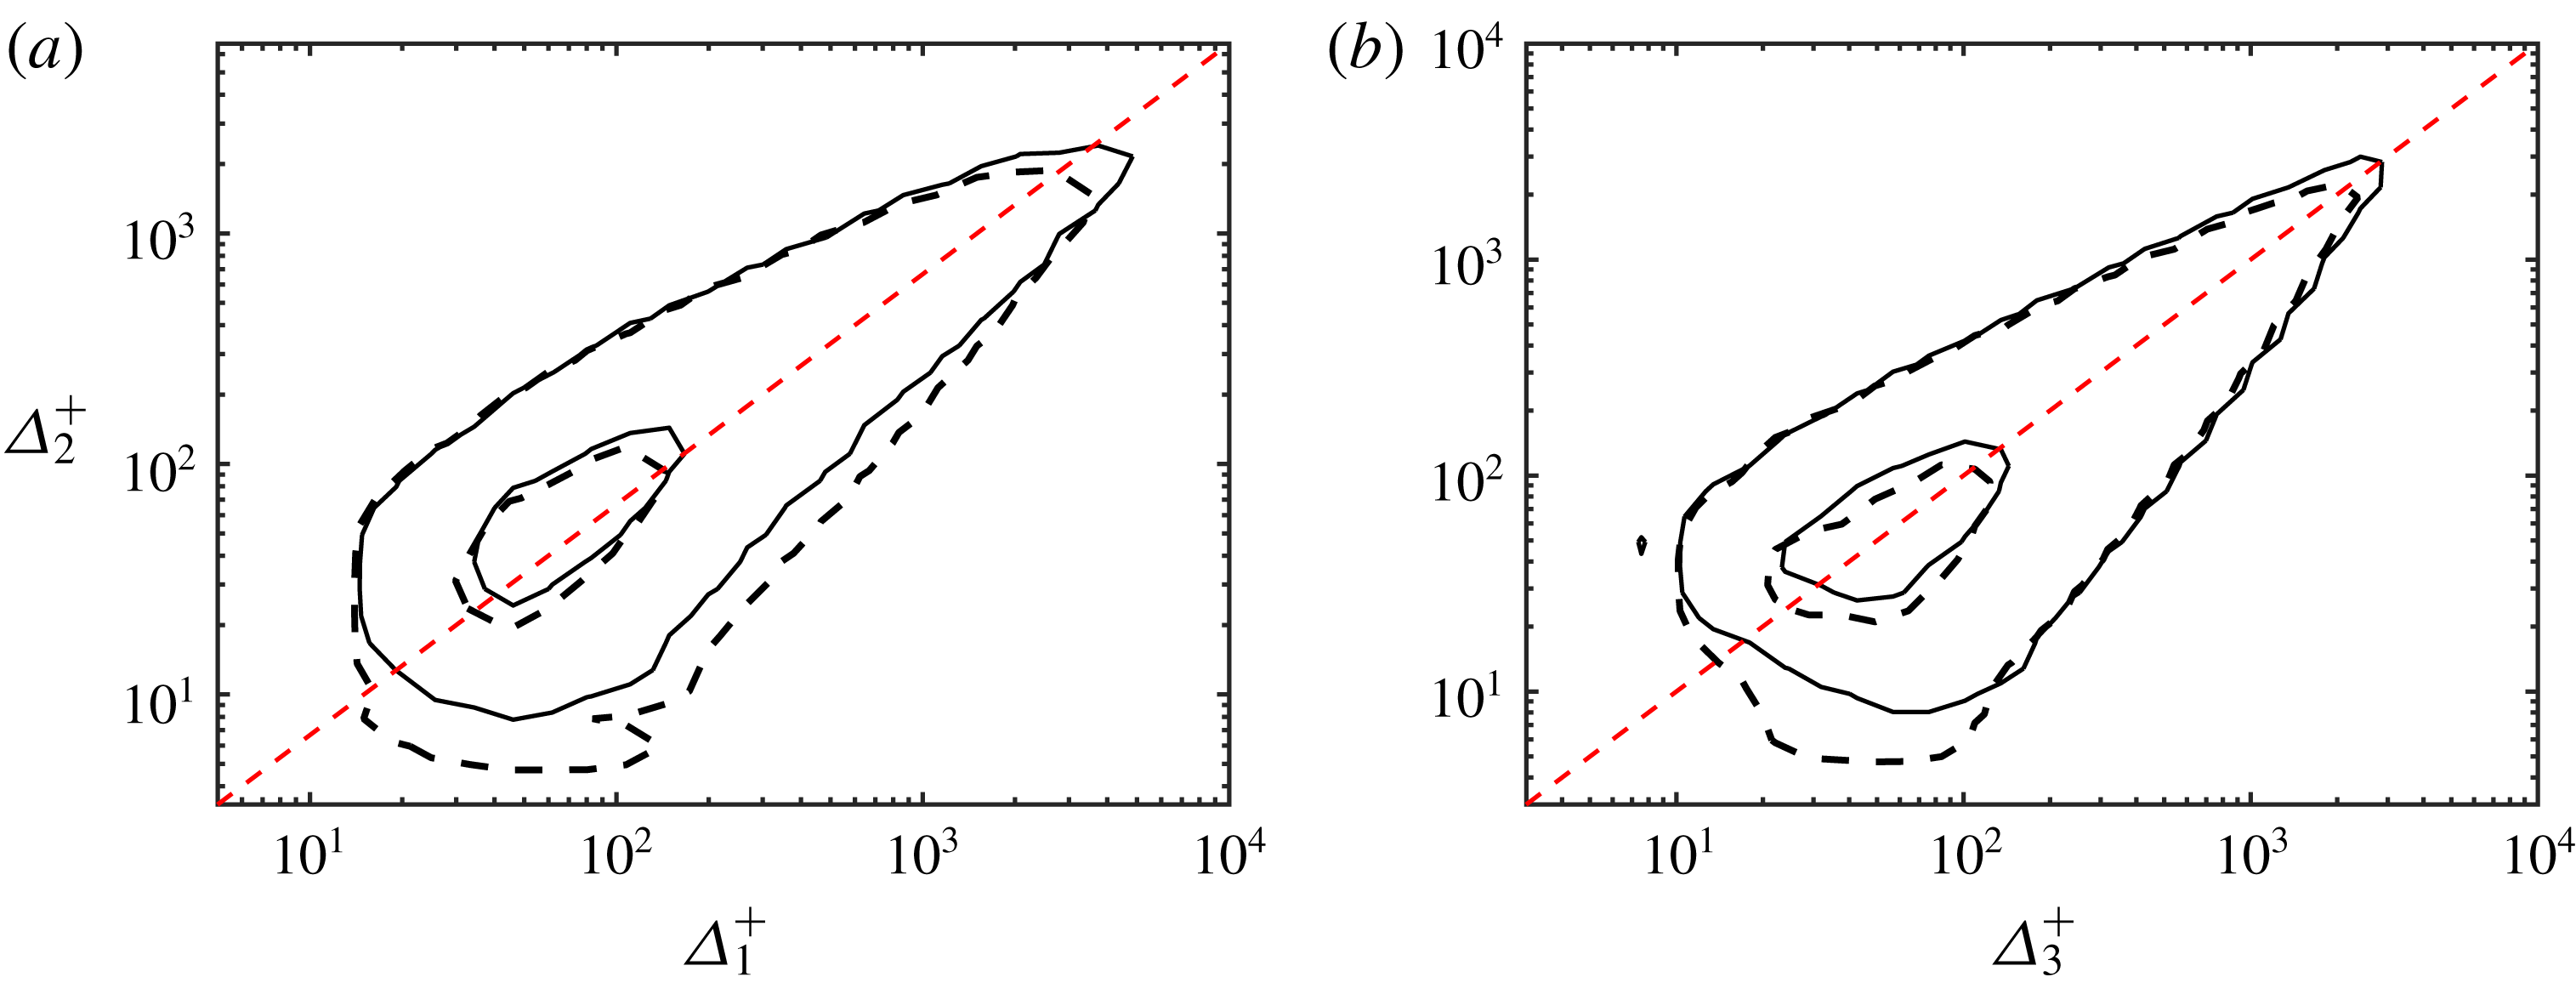
, respectively. Figure 14 shows the joint probability density functions (p.d.f.s) of the logarithms of
 $\unicode[STIX]{x1D6E5}_{i}$
,
 $p(\unicode[STIX]{x1D6E5}_{1},\unicode[STIX]{x1D6E5}_{2})$
and
 $p(\unicode[STIX]{x1D6E5}_{3},\unicode[STIX]{x1D6E5}_{2})$
, for NS2000 and R2000. Both cases collapse remarkably well except for small objects close to the boundary, and follow fairly well-defined linear laws
 $$\begin{eqnarray}\unicode[STIX]{x1D6E5}_{1}\approx 1.5\unicode[STIX]{x1D6E5}_{2}\quad \text{and}\quad \unicode[STIX]{x1D6E5}_{3}\approx \unicode[STIX]{x1D6E5}_{2},\end{eqnarray}$$
consistent with the good agreement obtained for the spectra in § 4.2. The similarity laws in (4.10) were used in § 4.2 to estimate the sizes of the eddies at a given
 $x_{2}$
location. The quantitative resemblance of the momentum eddies in the two flow configurations highlights once again that the impermeability of the wall (and hence the distance to the wall) is not a fundamental feature of the stress-carrying motions in the outer layer of wall-bounded flows.
Joint p.d.f.s of the logarithms of the box sizes of structures, (a)
 $p(\unicode[STIX]{x1D6E5}_{1}^{+},\unicode[STIX]{x1D6E5}_{2}^{+})$
and (b)
 $p(\unicode[STIX]{x1D6E5}_{3}^{+},\unicode[STIX]{x1D6E5}_{2}^{+})$
, for NS2000 (——) and R2000 (– – –). Contours contain 50 % and 99.8 % of the p.d.f. The dashed straight lines are
 $\unicode[STIX]{x1D6E5}_{1}=1.5\unicode[STIX]{x1D6E5}_{2}$
and
 $\unicode[STIX]{x1D6E5}_{1}=\unicode[STIX]{x1D6E5}_{3}$
, respectively.

5 Conclusions
In the present work we have proposed new characteristic velocity, length and time scales for the momentum-carrying eddies in the log layer of wall-bounded turbulence. We have hypothesised that the mean tangential momentum flux and mean shear are the main contributors to the intensities, life span and sizes of the active energy-containing motions in the outer region. The proposed characteristic scales are consistent with the predictions by Townsend’s attached-eddy model and extend its applicability to flows with different mean momentum flux.
The mechanism proposed is as follows. The mean tangential momentum transfer defines a characteristic velocity scale
 $u^{\ast }$
at each wall-normal distance. The role of
 $u^{\ast }$
is twofold: it controls the intensities of both the active eddies and the mean shear. The size of the eddies is governed by the length scale
 $l^{\ast }$
defined in terms of
 $u^{\ast }$
and the characteristic time scaled
 $t^{\ast }$
imposed by the mean shear. In this framework, the no-slip and impermeability constraints of the wall are not directly involved in the organisation of the outer flow, and the role of the wall is relegated to serve as a proxy to sustain the mean momentum flux. The scaling proposed has been successfully assessed through a set of idealised numerical studies in channel flows with
 $x_{2}$
-dependent body forces and modified streamwise velocity profiles.
We have further addressed the question of whether the impermeability of the wall is a foundational component of the outer layer of wall turbulence by designing a new numerical experiment where the walls of the channel are replaced by a Robin boundary condition. In the resulting flow, instantaneous wall transpiration is allowed for scales comparable to the size of the log-layer motions to the extent that the wall-normal distance can no longer be a relevant length scale. We have referred to this configuration as Robin-bounded channel flow as opposed to the traditional wall-bounded channel.
A detailed inspection of the one-point statistics, spectra and three-dimensional structures responsible for the momentum transfer has shown that both wall-bounded and Robin-bounded channel flows share identical outer-layer motions, and we have interpreted this evidence as an indication that the same physical processes occur in both flow configurations. The results are consistent with previous studies on rough walls and idealised numerical experiments with modified walls, although it is important to stress that in the present set-up wall transpiration is allowed for length scales of the order of the log-layer eddies. In that sense, our findings generalise Townsend’s similarity hypothesis for permeable boundaries, and reinforce the conclusion from previous studies which highlighted the secondary role played by the wall.
Acknowledgements
This work was supported by NASA under grant no. NNX15AU93A and by ONR under grant no. N00014-16-S-BA10. The authors thank Professor P. Moin, Professor J. Jiménez, Dr P. Johnson and Dr M. Cho for their insightful comments on previous versions of the manuscript.
Appendix A. Characteristic velocity without wall-normal coordinate
The factor
 $\sqrt{1-x_{2}/h}$
in the definition of
 $u^{\star }$
serves only a practical purpose, i.e.
 $u^{\star }=u_{\unicode[STIX]{x1D70F}}$
for traditional turbulent channel flows. Using
 $u^{\ast }$
instead of
 $u^{\star }$
does not degrade the quality of the scaling reported in § 3.3 except for a region very close to or very far from the wall where the scaling is no longer applicable owing to the presence of viscous effects or the lack of mean shear. Figure 15 (analogous to figure 2
d) shows the scaling of the r.m.s. fluctuating velocities using as characteristic velocity scale
 $u^{\ast }$
. The results show that the r.m.s. velocity fluctuations collapse and remain roughly constant across the layer defined by
 $0.1h<x_{2}<0.8h$
for the cases investigated.
Streamwise (circles and – – –), wall-normal (triangles and – - – -) and spanwise (squares and
 $\cdots \cdots$
) r.m.s. velocity fluctuations scaled with
 $u^{\ast }$
. Symbols are for NS550-p (open) and NS550-n (closed). Lines without symbols are for NS550. For clarity, the profiles for the wall-normal and spanwise r.m.s. velocity fluctuations are shifted vertically by 2.0 and 3.4 wall units.

Appendix B. Flow structure at the boundary for channels with Robin boundary condition
In the present appendix, we document the intensities and sizes of the velocity structures at
 $x_{2}/h=0$
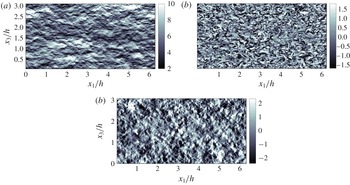
for turbulent channels with Robin boundary conditions. Snapshots of the three instantaneous velocities are shown in figure 16 to provide a qualitative assessment of the characteristic structure of the flow at the boundary. The flow exhibits an elongated structure for the streamwise velocity reminiscent of the traditional near-wall streaks, but with streamwise sizes much shorter than those reported for no-slip channels in the region
 $x_{2}^{+}<10$
. The wall-normal and spanwise velocities show a quasi-isotropic organisation in the wall-parallel plane. The intensities of the three fluctuating velocities at
 $x_{2}/h=0$
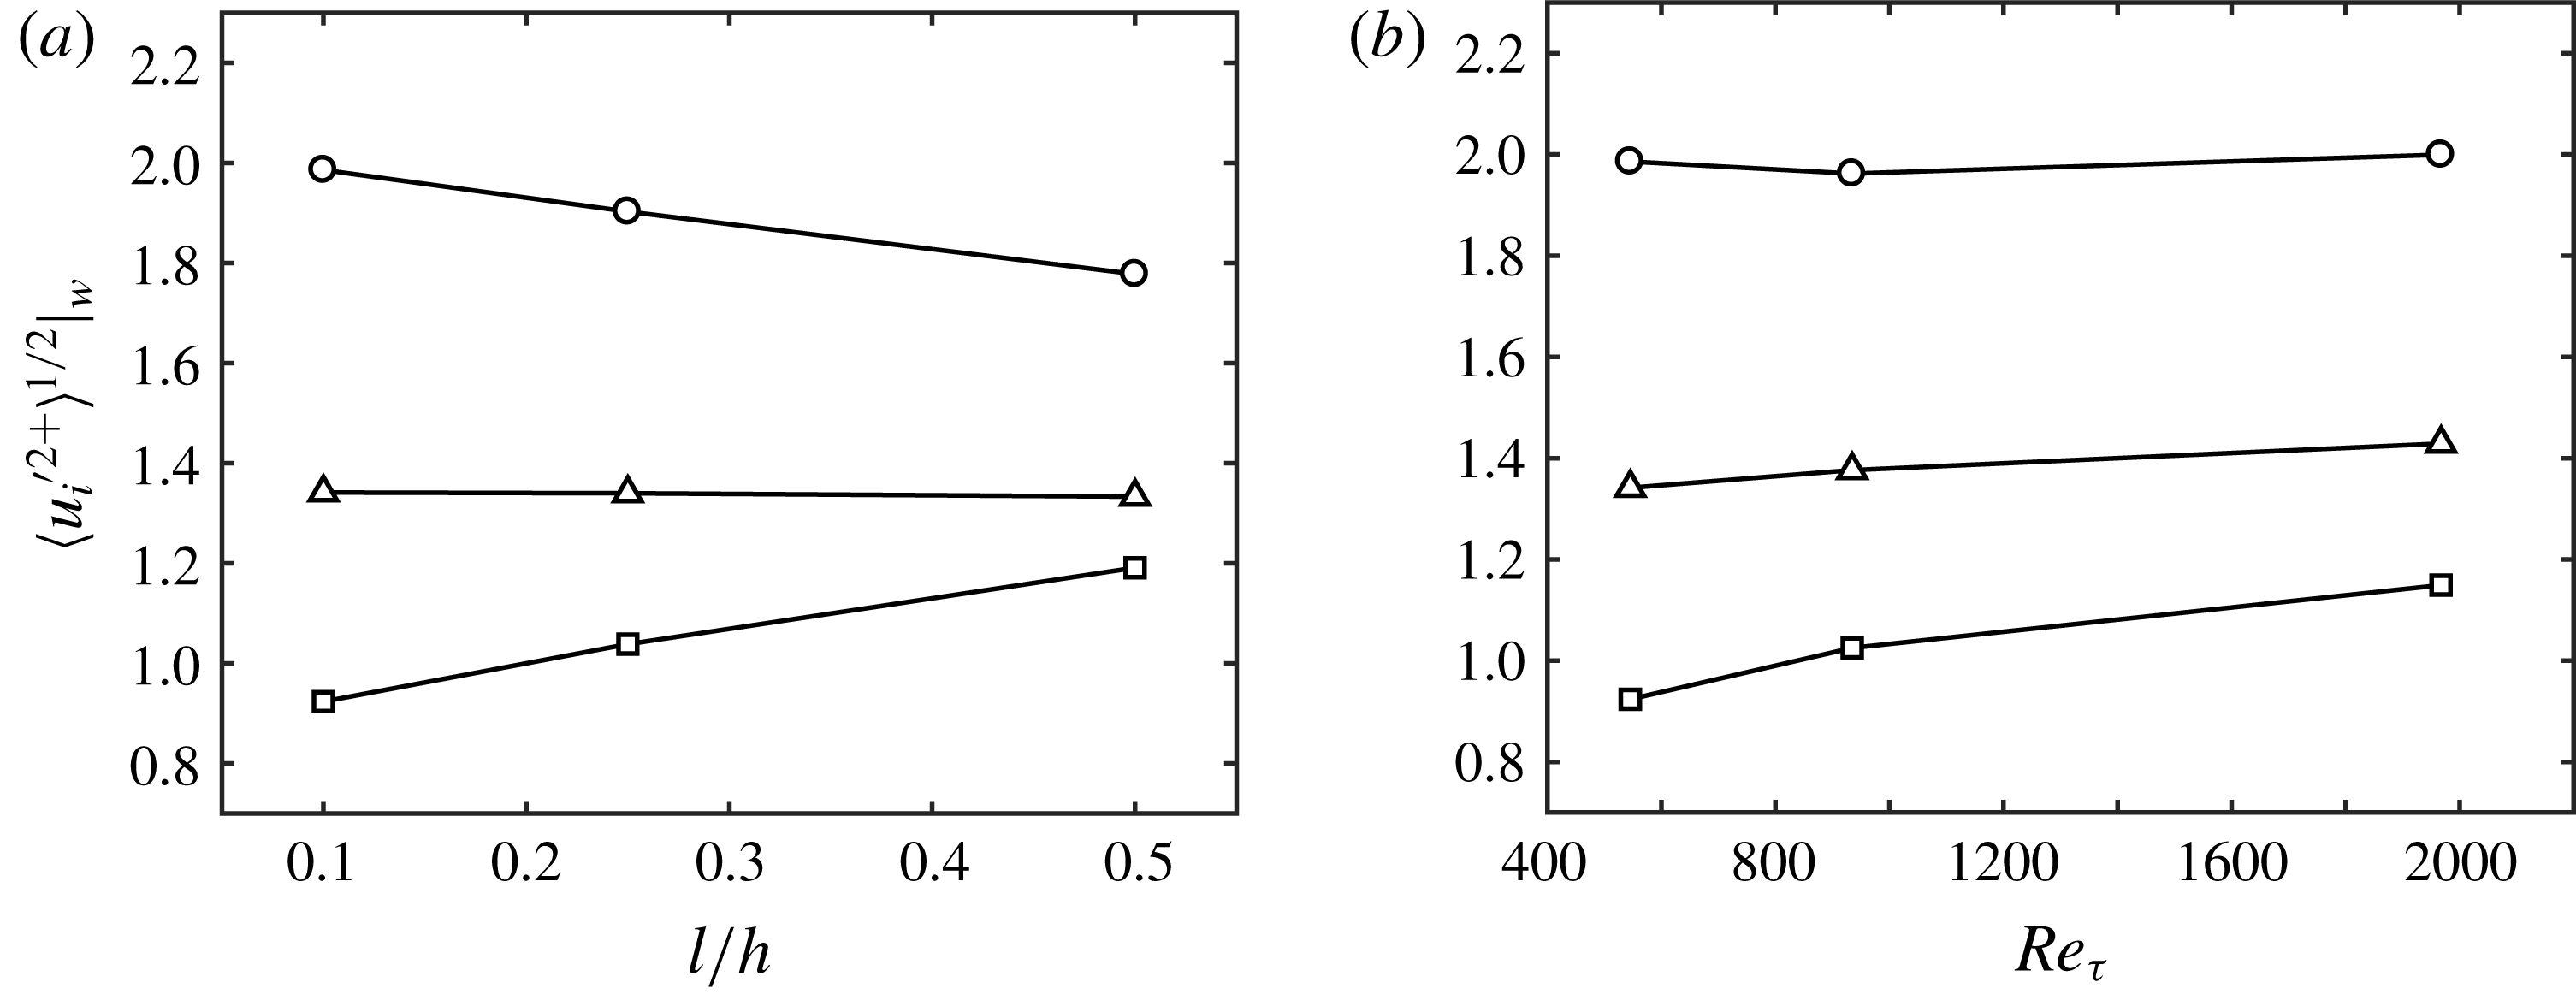
are quantified in figure 17 as a function of the slip length and Reynolds number. Intensities remain fairly constant with
 $Re_{\unicode[STIX]{x1D70F}}$
and change slowly with the slip length. For increasing slip length, the streamwise r.m.s. velocity decreases, whereas the wall-normal r.m.s. velocity increases. The spanwise r.m.s. velocity is roughly constant for the range of slip lengths studied. The trend suggests that the three velocities converge to an isotropic state for increasing slip length, which may be caused by the fact that the Robin boundary condition resembles free slip
 $\unicode[STIX]{x2202}u_{i}/\unicode[STIX]{x2202}x_{2}\approx 0$
in such a limit. Note that the free-slip limit is not of interest in the present work, as the flow is unable to support a mean shear.
Instantaneous
 $x_{1}$
–
 $x_{3}$
planes of the (a) streamwise, (b) wall-normal and (c) spanwise velocity for R2000 at
 $x_{2}/h=0$
. The mean flow is from left to right. The colour bars show velocity normalised in wall units.

Streamwise (○), wall-normal (▫) and spanwise (▵) r.m.s. fluctuating velocities at
 $x_{2}/h=0$
for Robin-bounded cases as a function of (a) slip length and (b) friction Reynolds number.

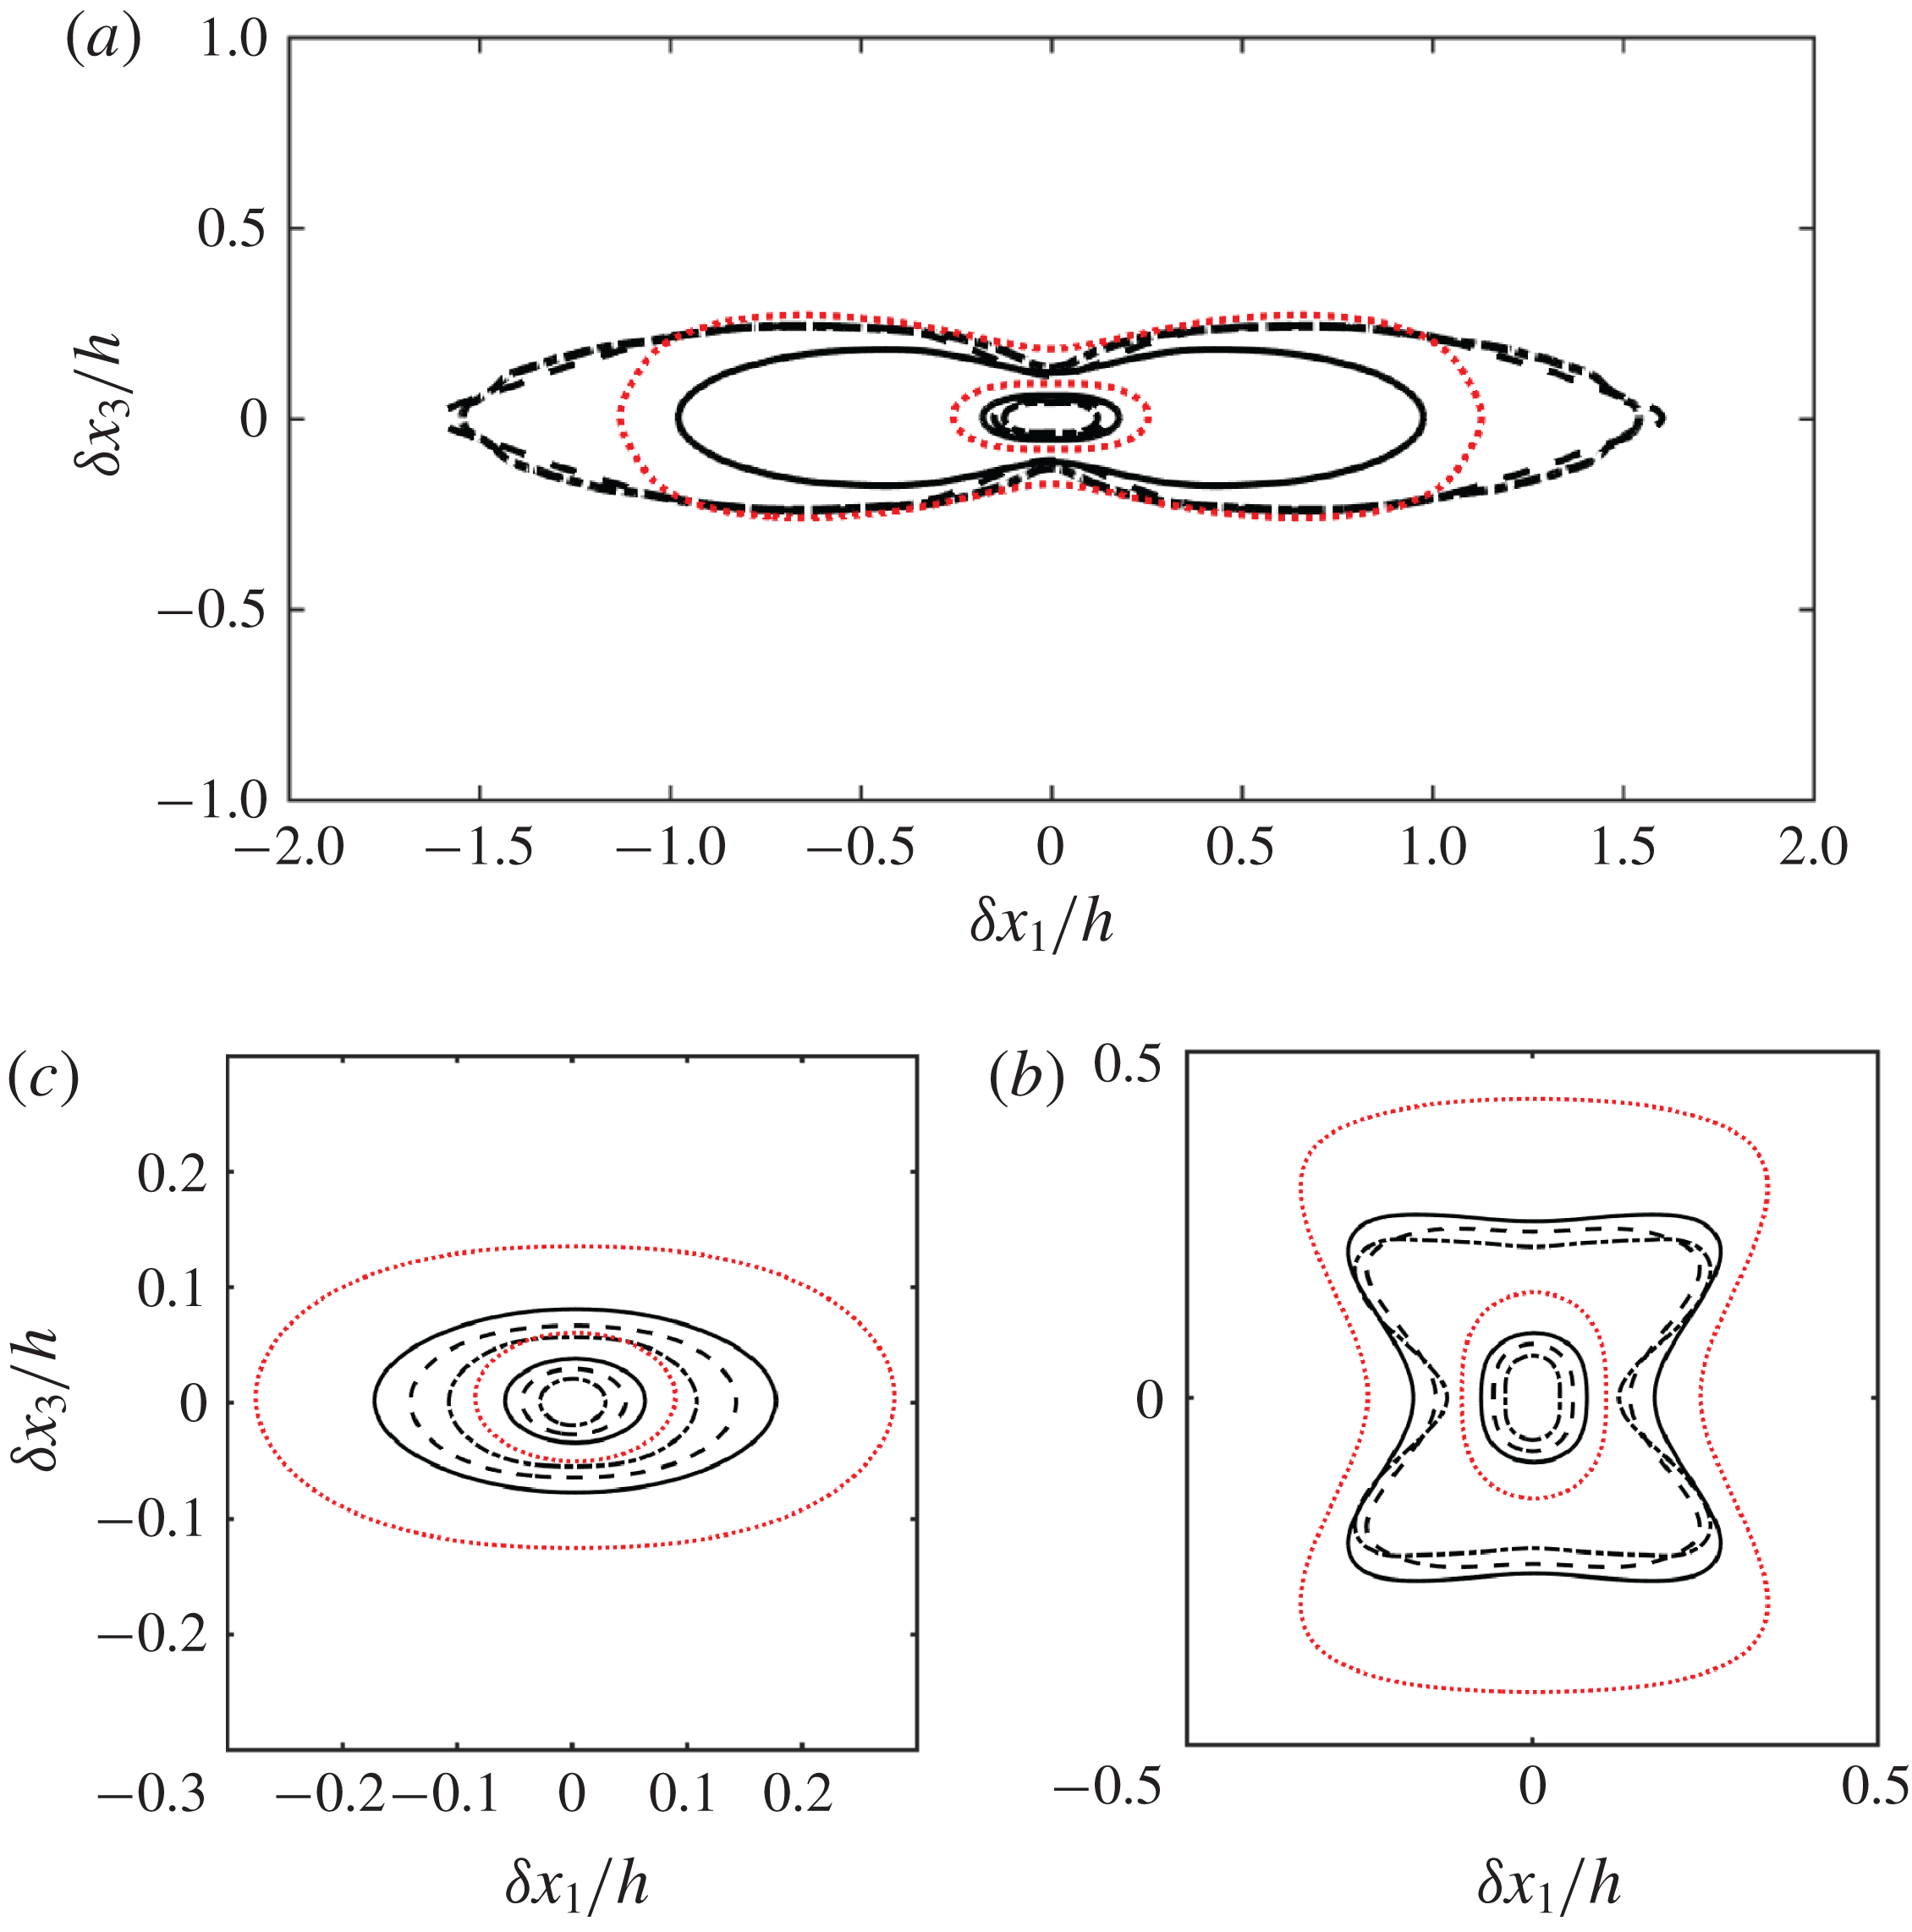
The sizes of the velocity structures are quantified in figure 18 through the two-point correlation of the velocities as a function of the streamwise and spanwise increments
 $\unicode[STIX]{x1D6FF}x_{1}$
and
 $\unicode[STIX]{x1D6FF}x_{3}$
, respectively. For a constant slip length, the isocontours of the correlation scale reasonably well using
 $h$
for
 $u_{1}$
and
 $u_{3}$
, and
 $Re_{\unicode[STIX]{x1D70F}}>550$
. Some dependence on the Reynolds number can be observed for the correlation of the wall-normal velocity, although the scaling with
 $h$
is still superior to the scaling using wall units (not shown). Increasing the slip length while maintaining
 $Re_{\unicode[STIX]{x1D70F}}$
(dotted red line in figure 18) shortens the streamwise velocity correlation and enlarges the size of the
 $u_{2}$
and
 $u_{3}$
structures.
Wall-parallel (
 $x_{1}$
–
 $x_{3}$
) correlations of the (a) streamwise, (b) wall-normal and (c) spanwise velocity for R550 (——), R950 (– – –), R2000 (– - – -) and R550-l1 (
 $\cdots \cdots$
). Contours are 0.05 and 0.5 of the maximum value. The mean flow is from left to right.

Appendix C. Logarithmic layer in Robin-bounded cases with
$l$
fixed in wall units

We perform two additional DNS of Robin-bounded channels with slip length
 $l^{+}=20$
at
 $Re_{\unicode[STIX]{x1D70F}}\approx 550$
(labelled as R550-lplus) and
 $Re_{\unicode[STIX]{x1D70F}}\approx 950$
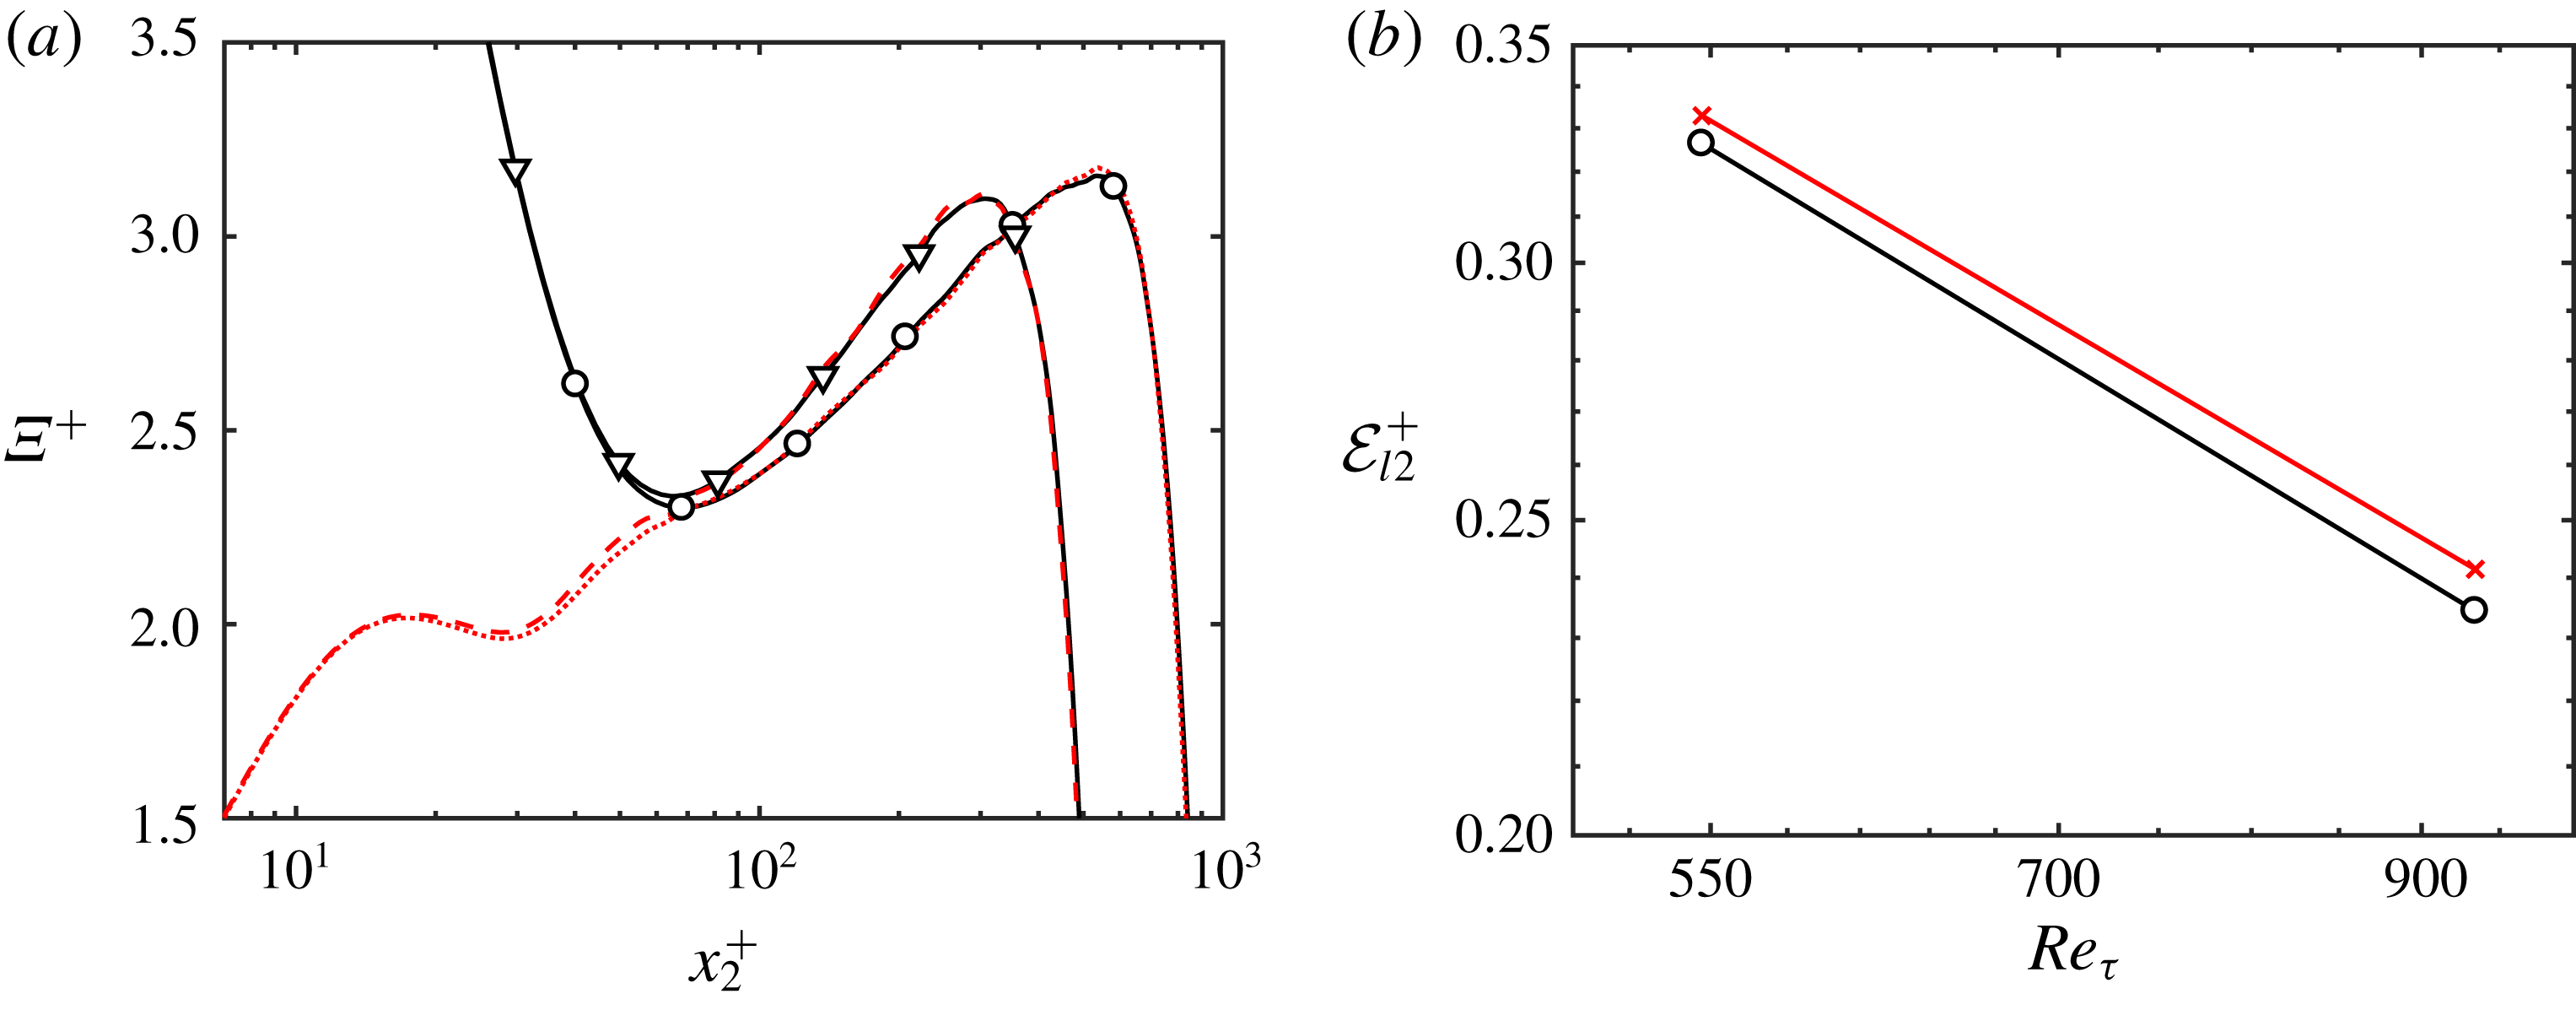
(labelled as R950-lplus). The numerical set-up is identical to that discussed in § 4.1 for cases R550 and R950. Figure 19(a) shows the diagnostic function
 $\unicode[STIX]{x1D6EF}=x_{2}\unicode[STIX]{x2202}\langle u_{1}\rangle /\unicode[STIX]{x2202}x_{2}$
for Robin-bounded cases compared to their no-slip equivalents NS550 and NS950. The agreement between the Robin-bounded and wall-bounded cases is excellent for
 $x_{2}^{+}\gtrsim 70$
. The results are consistent with the adaptation-length argument presented in § 4.3: fixing
 $l$
in wall units introduces a perturbation which propagates in the wall-normal direction for a distance
 $O(\unicode[STIX]{x1D708}/u_{\unicode[STIX]{x1D70F}})$
. While the Reynolds numbers above are too low to develop a well-defined log layer, the collapse of the diagnostic functions reported in figure 19(a) suggests the emergence of a log layer for both wall-bounded and Robin-bounded cases. The deviation from the log layer is further quantified by the error function (see § 4.4)
 $$\begin{eqnarray}{\mathcal{E}}_{l2}^{+}=\left[\frac{1}{0.2-100/Re_{\unicode[STIX]{x1D70F}}}\int _{100/Re_{\unicode[STIX]{x1D70F}}}^{0.2}\left(x_{2}^{+}\frac{\unicode[STIX]{x2202}\langle u_{1}^{+}\rangle }{\unicode[STIX]{x2202}x_{2}^{+}}-\frac{1}{\unicode[STIX]{x1D705}}-\frac{x_{2}}{h}\right)^{2}\text{d}(x_{2}/h)\right]^{1/2},\end{eqnarray}$$
where the lower integration limit is chosen in wall units as expected for the near-wall edge of the log layer. The results, included in figure 19(b), show that Robin-bounded cases with
 $l^{+}=20$
tend to a log layer for
 $x_{2}/h\in [100/Re_{\unicode[STIX]{x1D70F}},0.2]$
with a similar error to and at a similar rate as wall-bounded cases. In the cases presented here, the inner–outer scale separation, defined by
 $h/l$
, increases with
 $Re_{\unicode[STIX]{x1D70F}}$
. Thus the development of a log layer may be anticipated by invoking Millikan’s argument.
(a) Diagnostic function
 $\unicode[STIX]{x1D6EF}=x_{2}\unicode[STIX]{x2202}\langle u_{1}\rangle /\unicode[STIX]{x2202}x_{2}$
for NS550 (▿), NS950 (○), R550-lplus (– – –) and R950-lplus (
 $\cdots \cdots$
). (b) Plot of
 ${\mathcal{E}}_{l2}$
as a function of
 $Re_{\unicode[STIX]{x1D70F}}$
for wall-bounded cases NS550 and NS950 (○), and Robin-bounded cases R550-lplus and R950-lplus (
 $\times$
).