




Crossref Citations

This article has been cited by the following publications. This list is generated based on data provided by Crossref.
Cohen, Mollie J.
Salles Kobilanski, Facundo E.
and
Zechmeister, Elizabeth J.
2018.
Electoral Volatility in Latin America.
The Journal of Politics,
Vol. 80,
Issue. 3,
p.
1017.
Torcal, Mariano
2018.
Oxford Bibliographies in Political Science.
Bodea, Cristina
Bagashka, Tanya
and
Han, Sung Min
2019.
Are Parties Punished for Breaking Electoral Promises? Market Oriented Reforms and the Left in Post-Communist Countries.
SSRN Electronic Journal,
Lago, Ignacio
and
Torcal, Mariano
2020.
Electoral coordination and party system institutionalization.
Party Politics,
Vol. 26,
Issue. 5,
p.
570.
Emanuele, Vincenzo
Chiaramonte, Alessandro
and
Soare, Sorina
2020.
Does the Iron Curtain Still Exist? The Convergence in Electoral Volatility between Eastern and Western Europe.
Government and Opposition,
Vol. 55,
Issue. 2,
p.
308.
Mainwaring, Scott
and
Su, Yen-Pin
2021.
Electoral Volatility in Latin America, 1932–2018.
Studies in Comparative International Development,
Vol. 56,
Issue. 3,
p.
271.
Bagashka, Tanya
Bodea, Cristina
and
Han, Sung Min
2022.
Populism's rise in post‐communist countries: Breaking electoral promises and incumbent left parties’ vote losses.
European Journal of Political Research,
Vol. 61,
Issue. 1,
p.
134.
Kapidžić, Damir
and
Komar, Olivera
2022.
Segmental Volatility in Ethnically Divided Societies: (Re)assessing Party System Stability in Southeast Europe.
Nationalities Papers,
Vol. 50,
Issue. 3,
p.
535.
Choi, Seung-Whan
and
Gozgor, Giray
2022.
Outlier analysis: Natural resources and immigration policy.
PLOS ONE,
Vol. 17,
Issue. 1,
p.
e0261533.
Kouba, Karel
2023.
The Proscription Paradox: Banning Parties Based on Threshold Requirements and Electoral Volatility in Latin America.
Latin American Politics and Society,
Vol. 65,
Issue. 2,
p.
31.
Bochsler, Daniel
and
Hänni, Miriam
2024.
Who benefits from the retrospective vote? Bringing in new parties.
West European Politics,
Vol. 47,
Issue. 2,
p.
303.
Lee, Don S.
and
Casal Bértoa, Fernando
2026.
Does institutional design matter? Constitutional regime types and party system closure in Asia.
World Development,
Vol. 200,
Issue. ,
p.
107217.
In their well-cited 2014 article in the British Journal of Political Science, Eleanor Neff Powell and Joshua A. Tucker examine party system volatility in post-communist Europe.Footnote 1 Following Birch, they highlight the importance of disaggregating volatility into two components: volatility caused by new party entry and old party exit, and volatility caused by vote switching across existing parties.Footnote 2 Whereas Birch refers to these components as ‘replacement volatility’ and ‘electoral volatility’, Powell and Tucker refer to them as ‘Type A Volatility’ and ‘Type B Volatility’. Standard measures of volatility, such as the well-known Pedersen Index, conflate these different components of volatility.Footnote 3 This is problematic if the two components of volatility have different causes and consequences.
The extent to which party system volatility is driven by replacement or electoral volatility is likely to vary across different contexts. In particular, one would expect replacement volatility to play a larger role in democratizing countries (where parties form, disappear, split and merge as they adapt to a new electoral and institutional environment) than in established democracies (where the parties’ identities have stabilized).Footnote 4 Powell and Tucker provide support for this claim when they show that volatility is primarily driven by replacement volatility in the post-communist countries of Eastern Europe, but by electoral volatility in the established democracies of Western Europe.Footnote 5 In this note, we challenge their central claim that replacement volatility in post-communist Europe is driven by long-term economic performance.
Powell and Tucker provide measures of replacement and electoral volatility, and show how they relate to the standard indicator of party system volatility, the Pedersen Index:Footnote 6
where p refers to a party’s vote share, o refers to parties that contested only the election at time t, w refers to parties that contested only the election at time t+1, and stable parties refer to those parties that competed in elections at times t and t+1. They then calculate volatility across eighty-nine pairs of elections in twenty-one post-communist countries from 1989 to 2009. Their data comprise the largest dataset on volatility in post-communist Europe and represent a valuable contribution to the existing literature.
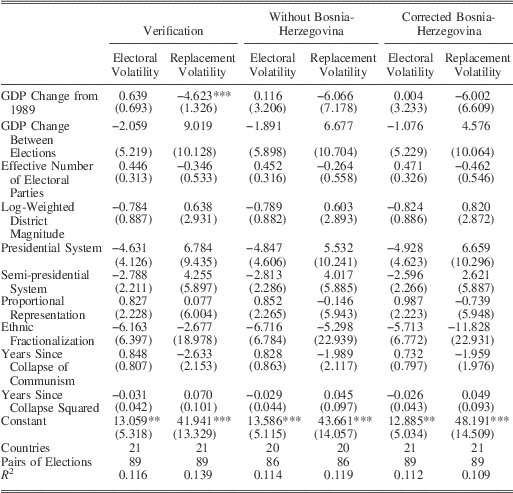
Powell and Tucker use their data to re-examine the causes of party system volatility in post-communist countries. Specifically, they investigate how a host of economic, political and institutional variables that have been employed in previous studies affect replacement and electoral volatility.Footnote 7 Their results, which we were able to verify,Footnote 8 are shown in the first two columns of Table 1. As the results in the first column indicate, there is no evidence that electoral volatility varies in a statistically significant way with any of the covariates from the existing theoretical literature.
Electoral and Replacement Volatility in Post-Communist Europe
Note: Robust standard errors clustered by country are in parentheses. Replacement Volatility (Type A Volatility) refers to volatility caused by new party entry and old party exit. Electoral Volatility (Type B Volatility) refers to volatility caused by vote switching across existing parties. The first two columns correspond exactly to the results found in Powell and Tucker’s preferred model (Model 4) in their Tables 3 and 5 (2014, 16–17). Following Powell and Tucker (Reference Powell and Tucker2014, fn. 34), we do not report the coefficients on a dummy variable that identifies four observations for which information on district magnitude is missing. The next two columns correspond to a model in which we omit the three ‘unusual’ observations from Bosnia-Herzegovina. The last two columns correspond to a model where we substitute in the ‘correct’ GDP Change From 1989 values for the three Bosnia-Herzegovina observations. *p<0.10; **p<0.05; ***p<0.01 (two-tailed).
As already indicated, though, the vast majority of party system volatility in post-communist Europe is driven by replacement volatility. The results in the second column of Table 1 indicate that GDP Change From 1989 is the only statistically significant determinant of replacement volatility. GDP Change From 1989 is calculated as the ratio of GDP in a given election year to GDP in 1989, and is designed to ‘tap into overall voter satisfaction with the performance of the current government […] relative to the previous communist era’.Footnote 9 The negative and statistically significant coefficient on GDP Change From 1989 indicates that replacement volatility decreases with ‘long-term economic recovery’.Footnote 10 Powell and Tucker state that ‘such a finding fits in very well with big-picture theoretical ideas about the extended role of the transition in structuring post-communist political behavior (Kitschelt et al., Reference Kitschelt, Manfeldova, Markowski and Toka1999; Tucker, Reference Tucker2006)’.Footnote 11
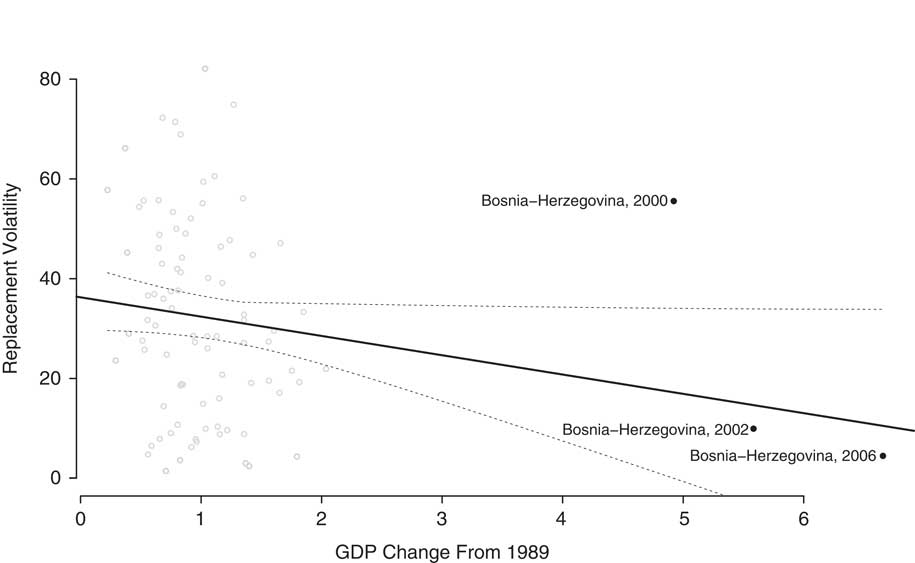
As we now demonstrate, though, there are strong reasons to doubt the claim that long-term economic performance is driving replacement volatility in post-communist Europe. In Figure 1, we plot replacement volatility against GDP Change From 1989. Recall that values of GDP Change From 1989 less than 1 indicate that election-year GDP is less than GDP in 1989, and that values greater than 1 indicate how many times larger election-year GDP is compared to GDP in 1989. The downward-sloping solid black line represents the fitted values from a bivariate regression of replacement volatility against GDP Change From 1989; the dashed black lines represent two-tailed 95 per cent confidence intervals.
Replacement volatility and long-term economic performance in post-communist Europe Note: The figure shows Replacement Volatility (Type A volatility) plotted against GDP Change From 1989 for eighty-nine pairs of elections in twenty-one post-communist countries from 1989 to 2009. The downward-sloping solid black line represents the fitted values from a bivariate regression of Replacement Volatility against GDP Change From 1989; the black dashed lines represent two-tailed 95 per cent confidence intervals. GDP Change From 1989 is calculated as the ratio of GDP in a given election year to GDP in 1989. Values less than 1 indicate that election-year GDP is less than GDP in 1989, whereas values greater than 1 indicate how many times larger election-year GDP is compared to GDP in 1989.
It should be immediately clear that the three observations from Bosnia-Herzegovina are distinct outliers with respect to GDP Change From 1989. Whereas the mean value of this covariate is 5.66 for Bosnia-Herzegovina, it is only 0.98 (σ=0.39) for the remaining eighty-six observations. In fact, the average value for Bosnia-Herzegovina is fully 2.78 times larger than the next-largest value, Poland 2007. An obvious concern is that the negative relationship between replacement volatility and long-term economic performance reported by Powell and Tucker is being driven by the unusual observations for Bosnia-Herzegovina.
To examine this possibility, we re-estimated our models after dropping the observations from Bosnia-Herzegovina. The results, which are shown in Columns 3 and 4 of Table 1, indicate that none of the covariates discussed in the existing theoretical literature has a statistically significant effect on electoral or replacement volatility. Most relevant is the fact that there is no longer any evidence to support Powell and Tucker’s claim that replacement volatility is driven by long-term economic performance. While the coefficient on GDP Change From 1989 remains negative, it is far from being statistically significant; indeed, the standard error is now larger than the coefficient. A jackknife procedure, in which we sequentially drop each country one at a time and then re-estimate the models for each of the reduced datasets, reveals that it is only the outlier observations from Bosnia-Herzegovina that are substantively influencing the results.
Yet the values of GDP Change From 1989 for Bosnia-Herzegovina are not just highly unusual; they are, in fact, incorrect. Recall that GDP Change From 1989 is supposed to be calculated as the ratio of GDP in a given election year to GDP in 1989. This variable comes from Pop-Eleches, who obtained the underlying data from the European Bank for Reconstruction and Development (EBRD).Footnote 12 This underlying data, which were kindly provided by Grigore Pop-Eleches, includes all the information necessary to calculate GDP Change From 1989 for every country in the sample except Bosnia-Herzegovina. The problem with Bosnia-Herzegovina is that the reported GDP data only go back to 1994.Footnote 13 Correspondence with Powell and Tucker reveal that they used 1994, instead of 1989, as the baseline year when calculating the values of GDP Change From 1989 for Bosnia-Herzegovina.
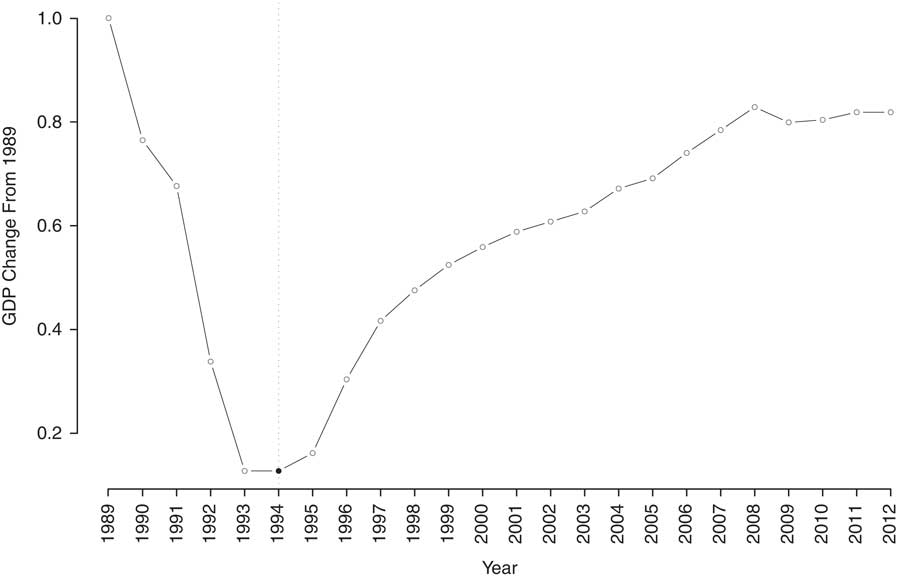
Although a choice like this might ordinarily be expected to cause few problems, this is not the case here. We were able to locate economic data back to 1989 for Bosnia-Herzegovina from the EBRD’s more recent Transition Report 2012.Footnote 14 In Figure 2, we show how real GDP in Bosnia-Herzegovina varies over time using 1989 as the baseline year. It should be immediately obvious that Powell and Tucker’s decision to use 1994 (the filled black circle) as the baseline year produces very misleading values for GDP Change Since 1989. Unlike most of the countries in our sample, Bosnia-Herzegovina had to fight for its independence. The 1992–95 Bosnian war essentially destroyed the nation’s economy, which is clearly visible in Figure 2. Bosnia-Herzegovina’s GDP in 1994 was just 12.7 per cent of what it was in 1989. Although GDP was more than five to six times larger in the 2000s than it was in 1994 (the values calculated by Powell and Tucker), it actually remained less than it was in 1989. Once we use 1989 as the baseline year, it soon becomes clear that the long-term economic performance of Bosnia-Herzegovina is not unusual at all – the mean value of GDP Change Since 1989 is 0.64, less than one standard deviation from the sample mean. In Columns 5 and 6 of Table 1, we present results from models in which we substitute in the correct data for Bosnia-Herzegovina. Using the correct data, there is no evidence that replacement (or electoral) volatility in post-communist Europe is driven by long-term economic performance.
Long-term economic performance in Bosnia-Herzegovina, 1989–2012 Note: Data on real GDP in Bosnia-Herzegovina come from the European Bank for Reconstruction and Development’s Transition Report 2012 (Zettelmeyer, Ricka and Sanfey Reference Zettelmeyer, Ricka and Sanfey2012, 103). GDP is set to 1 in 1989. The filled black dot and vertical dashed gray line indicates the baseline year – 1994 – used by Powell and Tucker (Reference Powell and Tucker2014) for calculating GDP Change Since 1989.
In their recent article, Powell and Tucker revisit the determinants of party system volatility in post-communist Europe. They conclude that replacement volatility is ‘largely a function of long-term economic recovery’.Footnote 15 As we have demonstrated, though, this conclusion is based entirely on a miscalculation of the long-term economic performance of a single country, Bosnia-Herzegovina. To the extent that Powell and Tucker have correctly identified the key theoretical variables in the existing literature, our reanalysis suggests that we know little about what causes party system volatility in post-communist Europe. None of the variables they propose has a statistically significant effect on either electoral or replacement volatility. Given the negative consequences traditionally associated with party system volatility, this area of research cries out for new theoretical development.