1. Introduction
The number of bilateral free trade agreements (FTAs) has increased dramatically in the last decades, both because of the slow progress of multilateral trade liberalization and because it is easier to include new areas, such as environment or labour rights, in bilateral agreements (Limão, Reference Limão2016). The EU is actively taking part in this trend. Important FTAs with South Korea, Canada, and Japan are already in force, an agreement in principle with Mercosur was reached in 2019, and negotiations with Australia, New Zealand, Indonesia, and several other countries are underway.
Research suggests that FTAs have been effective in boosting bilateral trade (Baier and Bergstrand, Reference Baier and Bergstrand2007, Reference Baier and Bergstrand2009). Conventional wisdom and stylized facts suggest that the main beneficiaries of FTAs are large firms and that the size of the preference margin is a key determinant of the utilization of tariff preferences (Nilsson, Reference Nilsson2016). Yet, earlier studies have largely been based on aggregated data where individual firms and trade transactions are not visible. The purpose of this research note is to shift focus from the aggregate level to the transaction level. We use a novel transaction-level data set to examine how the utilization of tariff preferences in the EU's FTA with South Korea varies across variables such as firm size, product category, import mode, preference margin, potential duty savings, and import transaction size. The objective is to answer the question: ‘Who uses the EU's free trade agreements?’
Our data set covers all individual import transactions from South Korea by Swedish importers in November 2016, and includes information on the product category, transaction value, and identity of the importer and exporter. The data set also contains details of the customs procedures used by the importers. In addition, we use register data to identify the size of the importing firms. This set of information makes it possible to begin opening the ‘black box’ of firm behaviour and to fill a series of knowledge gaps regarding the use of FTAs.
Earlier studies of preference utilization in FTAs have often focused on exporters. Here, we focus on importers. Preferential tariffs are not applied automatically. Instead, the importer must apply for tariff preferences and show that the imported products comply with rules of the FTA. The importer also enjoys the most tangible economic gains from using preferences by avoiding customs duties. Exporters are expected to benefit as well, but their gains may emerge more gradually, as a result of increased competitiveness and larger exports.
Our analysis is based on data for November 2016. Although the time period is short, the sample appears to be representative of a reasonably well-established EU FTA. The FTA was not formally ratified until December 2015 but it was familiar to the business community, since it had been provisionally applied from July 2011. Comparing the utilization of tariff preferences in Swedish imports during the sample month with other months during the period 2016–2018 and other EU member states, we have not noted any major deviations from the general patterns. The total number of preference-eligible import transactions in our data set is 10,066. One limitation of the analysis is that the data set includes only those firms that actually imported goods from South Korea during the sample period. This creates a potential selection bias that should be kept in mind when interpreting the results.
This note is organized as follows. Section 2 highlights some of the findings in the literature on preference utilization. Section 3 describes our data set and shows how the use of tariff preferences varies across firm size categories, product categories, transaction size, and import modes. Section 4 presents an econometric analysis of the main drivers of the utilization of tariff preferences. Section 5 concludes.
2. Literature
The literature on the utilization of tariff preferences is fairly recent, and few papers in this field date from before 2010. However, several stylized facts have already been established.
To benefit from tariff preferences, the importer must find a supplier that meets the rules of origin of the FTA, make an application to customs authorities to utilize the preferences, and prove that the imported products comply with the rules of origin. This can sometimes be a daunting task, and the more costly the search and administration, the lower is the expected utilization of tariff preferences. Among others, Hayakawa, Kim, and Lee (Reference Hayakawa, Kim and Lee2014) and Kim and Cho (Reference Kim and Cho2010) have found that more restrictive rules of origin reduce the utilization of tariff preferences, while Takahashi and Urata (Reference Takahashi and Urata2010) note that utilization is lower when it is more difficult and costly to obtain certificates of origin. Anson et al. (Reference Anson, Cadot, Estevadeordal, de Melo, Suwa-Eisenmann and Tumurchudur2005) estimate that the administrative costs of rules of origin on average correspond to 6% of the import value. Keck and Lendle (Reference Keck and Lendle2012) and Nilsson and Dotter (2012) suggest that the administrative costs for using tariff preferences are fixed rather than variable, which would benefit larger firms that can distribute these costs across a larger volume of imports. In one of the few earlier studies using transaction-level data (for Iceland), Albert and Nilsson (Reference Albert and Nilsson2016) estimate that the fixed cost of utilizing tariff preferences is in the range EUR 20 to EUR 260.
The size of the tariff reduction that can be achieved by using the FTA is referred to as the ‘preference margin’. This margin is important because there is no incentive to apply for tariff preferences unless the preferential tariff is lower than the ‘most-favoured-nation’ (MFN) tariff. Several studies, including Bureau, Chakir, and Gallezot (Reference Bureau, Chakir and Gallezot2007), Keck and Lendle (Reference Keck and Lendle2012), Hayakawa et al. (Reference Hayakawa, Hiratsuka, Shiino and Sukegawa2013), Hayakawa et al. (Reference Hayakawa, Kim and Lee2014), and Nilsson (Reference Nilsson2016) have identified a positive correlation between the size of the preference margin and preference utilization. However, Lukaszuk and Legge (Reference Lukaszuk and Legge2019) detected a negative correlation between the two in their analysis of Swiss data. A possible reason could be that products with high preference margins were also characterized by relatively strict rules of origin.
A series of studies have tried to find the threshold value for the preference margin that triggers utilization of tariff preferences. In other words, how large must the duty savings be for the FTA to be used? Common estimates fall in the range 2–6% (Francois, Hoekman, and Manchin, Reference Francois, Hoekman and Manchin2006; Manchin, Reference Manchin2006; Bureau, Chakir, and Gallezot, Reference Bureau, Chakir and Gallezot2007).
It is reasonable to assume that the value of trade has an impact on the incentive to use tariff preferences. For large orders, it can be profitable to claim the tariff preference even if the preference margin is low and the rules of origin are restrictive. Accordingly, Keck and Lendle (Reference Keck and Lendle2012), Nilsson (Reference Nilsson2012, Reference Nilsson2016), Hayakawa (Reference Hayakawa2013), and Hakobyan (Reference Hakobyan2015) all find a positive impact of trade value on preference utilization. Yet, Gulczynski and Nilsson (Reference Gulczynski and Nilsson2019) note that a significant share of EU importers used preferences in the EU–Korea FTA even when transactions and duty savings were small.
The characteristics of importers are also believed to matter. Demidova and Krishna (Reference Demidova and Krishna2008) showed that more productive firms utilize tariff preferences to a larger extent than less productive firms, arguably because they can easier afford the administrative costs related to preferences. Takahashi and Urata (Reference Takahashi and Urata2010) reported that large firms were more likely than small firms to use FTA tariff preferences. The large-firm advantage has since then become somewhat of a stylized fact. However, Wignaraja (Reference Wignaraja2014), using enterprise survey data, did not detect any correlation between firm size and preference utilization. Another possible determinant of the utilization of tariff preferences is previous experience: once firms have mastered the administration related to rules of origin, they may be more likely to use tariff preferences in subsequent imports. Hayakawa (Reference Hayakawa2013) and Wignaraja (Reference Wignaraja2014) are examples of studies suggesting the existence of this type of learning mechanism.
One weakness in this literature, pointed out for example by Wignaraja (Reference Wignaraja2014), is the lack of transaction-level data on preference utilization. The decision to utilize tariff preferences may vary at the transaction level, but the lack of disaggregated transaction data has precluded more detailed analysis. Among the studies cited above, Albert and Nilsson (Reference Albert and Nilsson2016) is the only one that is based on transaction level data (for EU exports to Iceland). The following sections present some data and econometric analysis to fill this research gap.
3. Data and Definitions of Variables
We work with transaction-level data on Swedish imports from South Korea during November 2016 from the Swedish Customs Agency. A transaction is defined as the value (in EUR) of a physical import shipment of a particular product (defined at the Taric Code 10-digit level) by an importer in Sweden from an exporter in South Korea. We distinguish between imports utilizing the tariff preferences and imports not utilizing the preferences but instead paying MFN tariffs higher than 0%. Import transactions with MFN tariffs equal to 0% are not discussed in detail below.
Firms can either import products that enter into free circulation after customs clearance at the Swedish border, referred to as ‘direct imports’, or use the customs procedure ‘customs warehousing’, which means that the products are stored at a customs warehouse for some time before entering the market. The value of the physical import transaction can only be identified for direct imports. For customs warehousing, our data set registers when a batch of products leaves the customs warehouse and enters into free circulation.
During the sample period, tariff preferences could potentially have been used in 10,066 transactions (see Table 1).Footnote 1 In 5,083 of these transactions, importers used tariff preferences, and in the remaining 4,983 transactions they opted not to use the preferences. Furthermore, 2,049 transactions were direct imports while the remaining 8,017 transactions were withdrawals from customs warehouses.
Import transactions according to mode of import and utilization of tariff preferences (products with MFN tariffs >zero)

Source: Customs data from National Board of Trade Sweden.
To assess whether the sample period is representative, we have compared the import value and the preference savings rate during the period under study with other time periods. Most of our discussion on preference utilization is based on the preference savings rate, which takes into account both the value of imports and the preference margin. The more commonly used preference utilization rate provides no information about the preference margin. See below for terms and definitions:
• Preference savings rate = duty savings/potential duty savings
• Duty savings = value of imports*preference margin (=the duty that is not paid when tariff preferences are utilized)
• Potential duty savings = duty savings + duty costs
• Duty cost = value of import*MFN tariff (=the duty that is paid when the tariff preferences are not utilized)
• Preference utilization rate = value of imports when preferences are used/value of preference-eligible imports
These comparisons show that the sample period did not differ much from the general pattern for the period 2016–2018. The preference savings rates were also relatively similar to those for other EU member states and other EU free trade agreements (Kasteng and Inama, Reference Kasteng and Inama2018). Yet, although the data seem representative, there are some outliers that could introduce biases. We have therefore identified and omitted a few such outliers (as discussed in the relevant sections below).
The value of Swedish imports from South Korea in November 2016 was EUR 61.2 million. The value of imports with MFN tariffs at 0% was EUR 8.7 million, while EUR 52.5 million were imported at MFN tariffs above 0%. Hence, the FTA was potentially relevant and beneficial for about 86% of the value of imports from South Korea during the sample period. Total potential duty savings amounted to about 3.1 EUR million, or 6% of the value of imports with MFN tariffs above 0%.
In total, 671 Swedish firms imported products from South Korea during the sample period. Of these, 219 firms imported only products covered by MFN tariffs at 0%, while 452 firms had the option to utilize preferences for some or all of their imports. About one-third of these firms (144 firms) chose to use preferences in all of their import transactions from South Korea. Only 49 firms used the tariff preferences in some but not all transactions where preferences could have been used, while the remaining 259 firms did not use the available preferences at all.
In total, 302 product categories at the HS 4-digit level were imported from South Korea. Of these, 65 categories were traded at MFN tariffs at 0%, while 237 4-digit product categories were covered by MFN tariffs above 0% and could potentially benefit from tariff preferences.Footnote 2
A first observation is that firms seem to use the FTA when duty savings are relatively large. The total amount of duty savings realized during the sample period was about EUR 2.7 million, while total duty costs (i.e. duties paid on imports that could have entered under the preference scheme) amounted to about EUR 370,000. The 259 firms that chose not to use preferences at all paid about EUR 195,000 in duties, which was only 6% of the value of the potential duty savings. The following section looks at how preference utilization varies across a number of other transaction characteristics, such as firm size, product category, transaction size, and import mode.
4. Patterns of Preference Utililization
4.1 Firm Size
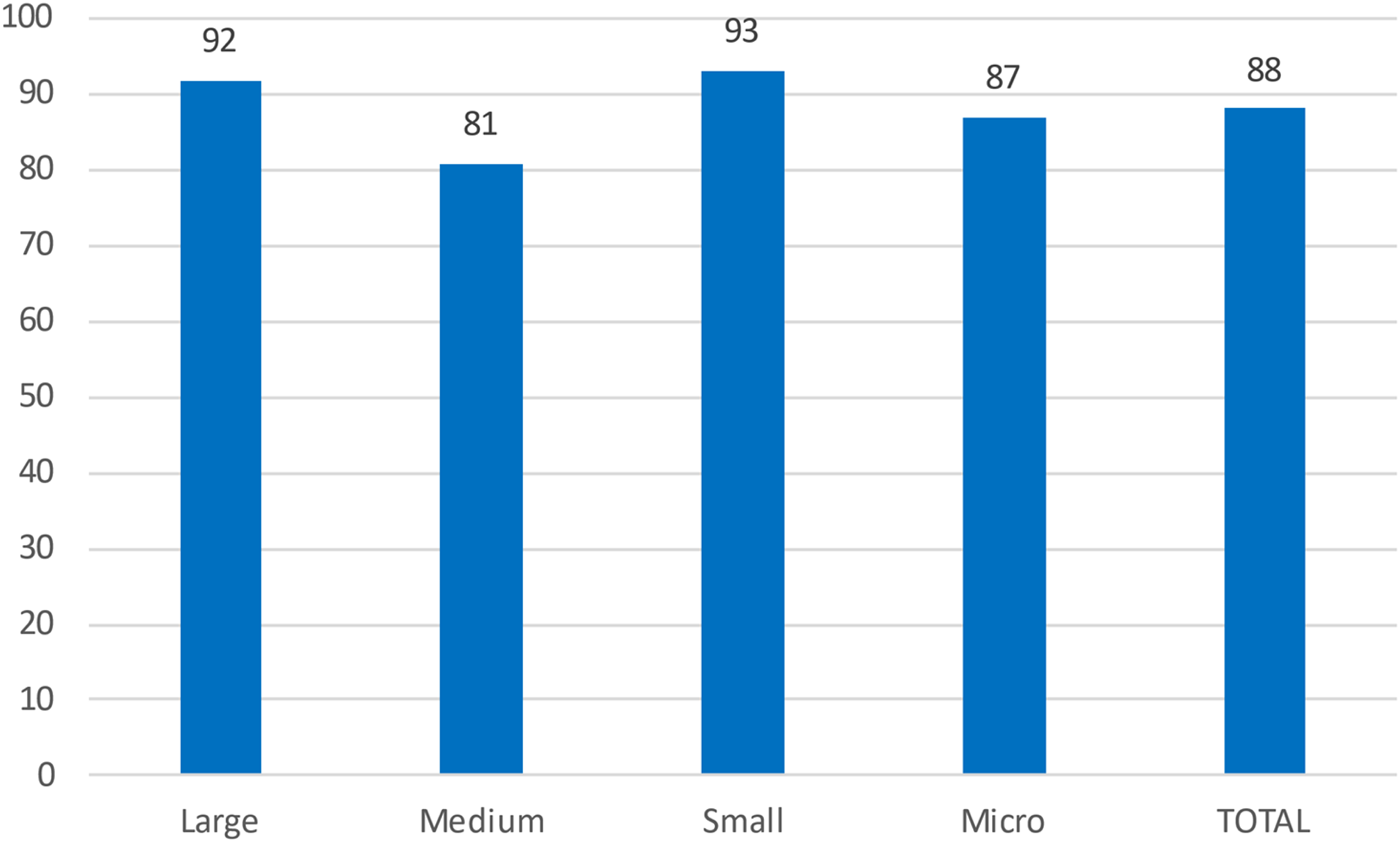
Figure 1 looks at preference savings rates across firm size categories (with size measured as aggregate turnover). Firms with an annual turnover exceeding EUR 50 million are classified as large firms, medium-sized firms have a turnover in the range EUR 10–50 million, small firms are in the range EUR 2–10 million, and micro firms are below EUR 2 million. Data on aggregate turnover are available for the 403 firms in the sample that were registered as Swedish limited liability companies. These firms were evenly distributed across the four size categories, with about 100 firms in each group. The data for total imports include also the 49 firms that could not be assigned to any of the size categories.Footnote 3 The figure shows that the preference savings rates were high for all size categories. Small firms were as good as large firms at exploiting potential duty savings from tariff preferences.
Preference savings rates by firm size (%)
Source: Customs data elaborated by the National Board of Trade Sweden.

Unsurprisingly, large firms accounted for most of the aggregate duty savings (79%) from the FTA. Yet, the high preference savings rates across the board suggest that size alone is not a good predictor of the use of tariff preferences among the importers in our sample.Footnote 4
4.2 Products and Product Categories
Since preference savings rates seem to be fairly equal across firm size categories, the differences in the use of preferences must instead be related to other factors, such as product category. Out of the 237 HS 4-digit import products that could potentially have benefited from tariff preferences, there were 40 products that were always imported with full duty savings. Another 92 products were imported with tariff preferences used in some but not all import transactions. Tariff preferences were not used at all for imports of the remaining 105 products. The 40 products that benefitted fully from tariff preferences accounted for two-thirds of the potential duty savings. The 92 products that were sometimes but not always imported with tariff preferences accounted for 31%, and the 105 products for which tariff preferences were not used at all accounted for 2% of the value of the potential duty savings. In other words, importers chose not to utilize tariff preferences when the savings were small.
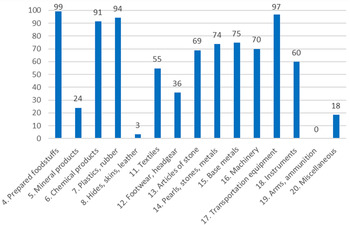
Examining the utilization of tariff preferences across all 237 4-digit import products is not a useful exercise, since individual transactions are likely to have a large impact on results in the current data set. In Figure 2, we therefore aggregate the data to the 21 HS sections that make up the most aggregated product categories in the Harmonized System for trade statistics. The products potentially benefiting from tariff preferences during the sample period were found in 15 of the 21 HS sections, referred to here as product categories. Six HS sections (mainly primary products) are omitted from Figure 2 because they did not include any imports that could potentially have benefited from tariff preferences.
Preference savings rates by product category (%)
Source: Customs data elaborated by the National Board of Trade Sweden.

The preference savings rates were the highest – above 90% – in prepared foodstuffs, transportation equipment, plastics and rubber, and chemical products. The lowest preference savings rates were found in arms and ammunition, hides, skins and leather, mineral products, and footwear and headgear.
The product categories with high preference savings rates also comprise most of the potential duty savings. The three HS-sections transportation equipment, machinery, and plastics and rubber accounted for 92% of total duty savings. Unexploited duty savings were found mainly in machinery, textiles, and transportation equipment.
4.3 Transaction Size
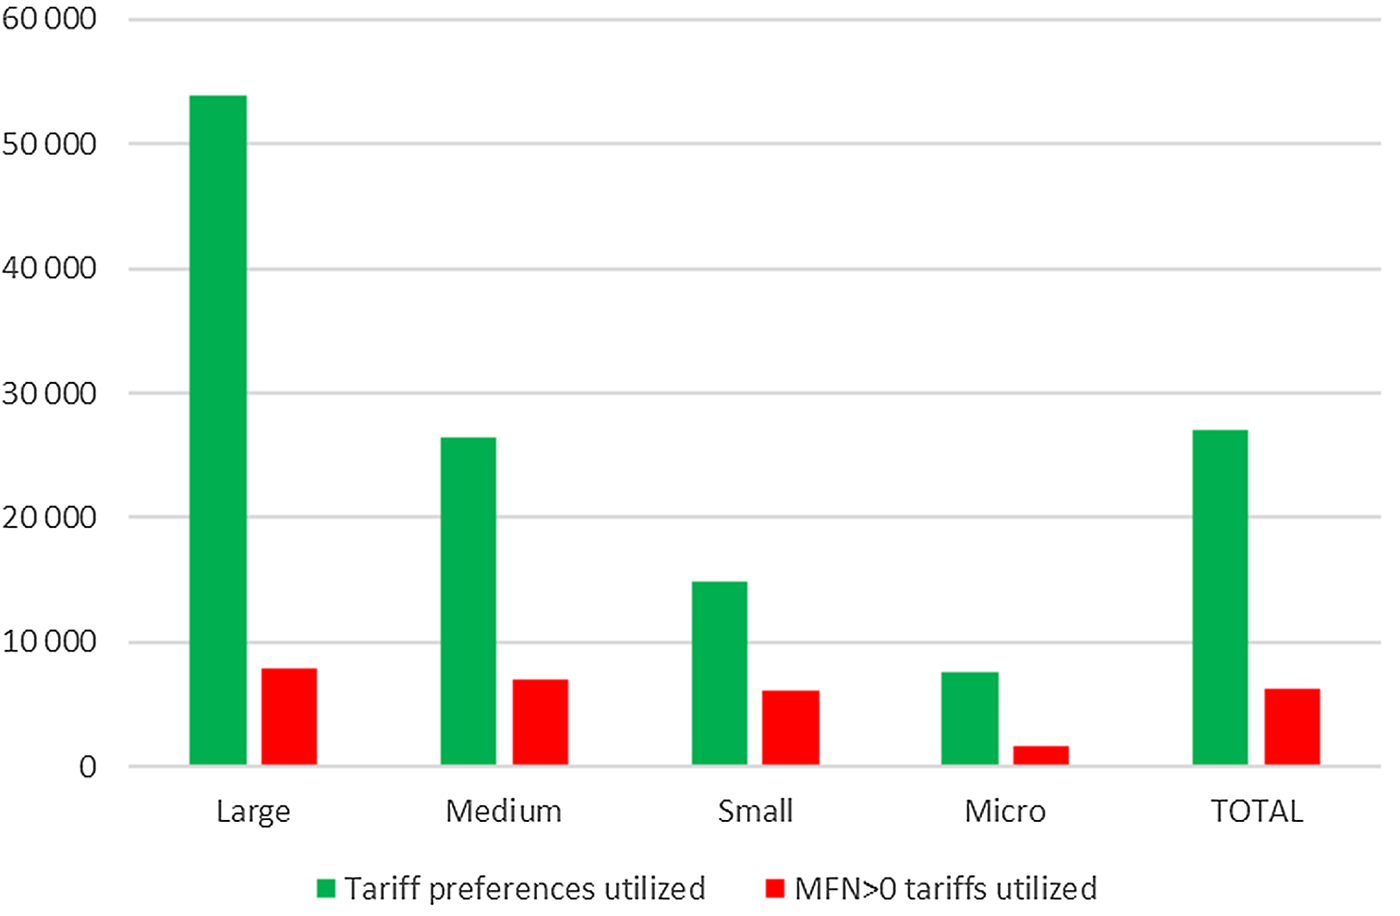
Figure 3 shows how average import transaction value and preference utilization vary across firm size categories.Footnote 5 The average transaction value when preferences were utilized increases with firm size, from about EUR 7,500 for micro firms to nearly EUR 54,000 for large firms. The average import transaction value when preferences were not utilized (and MFN tariffs were paid) is significantly smaller for all firm size categories.
Average import transaction value by firm size, direct imports (in EUR)
Source: Customs data elaborated by the National Board of Trade Sweden.

This pattern is consistent with the assumption that there are administrative costs associated with the utilization of tariff preferences. A reasonable interpretation is that firms pool imports into larger shipments in order to minimize the number of times they need to go through the costly administrative procedures for utilizing tariff preferences.
Examining import transaction values and tariff utilization across product categories, the general pattern – in nine out of 15 product categories – is that import transactions were larger when tariff preferences were utilized. However, this pattern did not hold in some of the product categories with the lowest preference savings rates, including mineral products, hides, skins and leather, and arms and ammunition.
4.4 Import Modes
The preceding discussion has focused on utilization of tariff preferences in direct import transactions. However, as noted before, it is also common that goods are imported using customs warehousing. These products are not subject to import duties or other related charges, nor are they formally registered as imports as long as they remain in the customs warehouse. It is not until the product leaves the customs warehouse that the withdrawal transaction is registered and the relevant MFN tariffs are paid or tariff preferences are utilized. Hence, the customs data related to customs warehousing refer to the warehouse extraction value rather than the underlying import transaction value. Earlier research has not documented to what extent customs warehousing influences the utilization of tariff preferences.
During our sample period, there was a larger number of firms engaged in direct imports than in customs warehousing: 367 companies recorded at least one direct import transaction, 114 companies used customs warehousing, while only 29 companies used both customs procedures.
The analysis of potential duty savings by import mode is confounded by two customs warehousing transactions with extreme values in the same product group, carried out by two different firms. Including these outliers, customs warehousing accounted for 62% of potential duty savings, appearing to be the dominant import mode from the perspective of duty savings. The total preference savings rate for customs warehousing, including the two outliers, was 94%, with direct import transactions recording a preference savings rate of 79%. However, both potential duty savings and actual preference utilization patterns for the other approximately 8,000 customs warehousing transactions differed significantly from these two outliers.
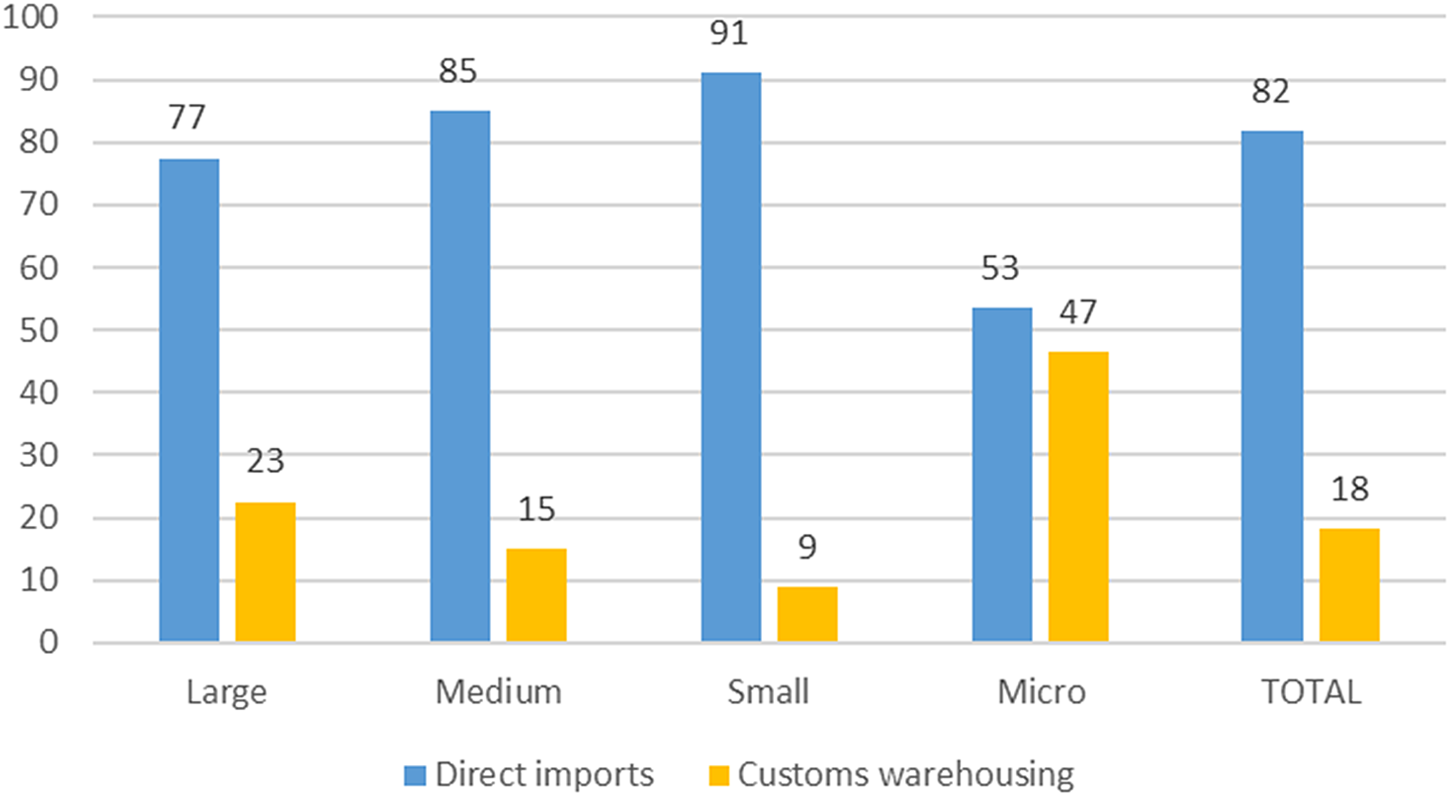
The two outliers are therefore omitted from Figure 4, which shows the distribution of potential duty savings across import modes.Footnote 6 Direct imports accounted for 82% of total potential duty savings, while the share of customs warehousing was only 18%. The same pattern, with direct imports accounting for most of the potential duty savings, applied for small, medium-sized, and large firms alike. However, for micro firms, potential duty savings from direct imports and customs warehousing were of roughly equal importance.
Distribution of potential duty savings across import mode, by firm size (%)
Source: Customs data elaborated by the National Board of Trade Sweden.

In aggregate terms, direct imports recorded a preference savings rate of 79% while the corresponding rate for customs warehousing was 52% (excluding the outliers). Distinguishing between size categories, the most notable observation is that micro firms using customs warehousing recorded an extremely high average preference savings rate at 99%. This implies that the smallest firms were able to realize in principle all duty savings related to their customs warehousing transactions, which is surprising considering the administrative and logistic costs related to both customs warehousing and tariff preference utilization. A possible explanation is the presence of intermediaries – specialized providers of customs brokerage and warehousing services – that serve smaller firms and that have developed routines for administering tariff preferences. The preference savings rate for customs warehousing was lower for medium-sized and large firms, which may sometimes have their own customs warehouses. This is also consistent with the existence of specialized intermediaries that primarily serve smaller firms that have limited in-house expertise in logistics and customs regulations.
5. Econometric Analysis
When importing products within the scope of an FTA, firms face a choice between using the tariff preferences or paying the MFN duties. To explore the determinants of this dichotomous choice, we use a probit regression model for cross-sectional data. The estimation model takes the following form:
 $$p_i = {\rm \Phi }( {{\boldsymbol X}_i\beta + \gamma_i} ) $$
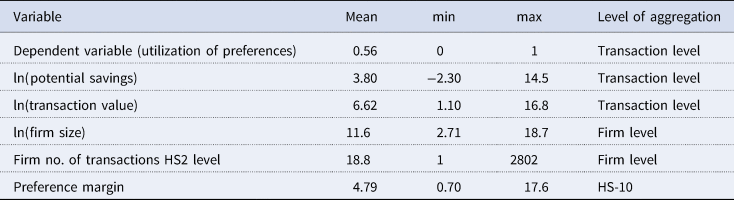
where p is the probability that the tariff preference is utilized, Φ is the cumulative standard distribution, and X is a vector of variables that affect firms’ decisions to utilize tariff preferences. Since a single firm can make many transactions and the residuals from a given firm are likely to be interrelated, standard errors are clustered at the firm level. The set of explanatory variables used here includes firm size (measured as the turnover), number of import transactions from South Korea per HS2 category during the period in question (to control for the possibility that firms with more frequent import transactions are more likely to have administrative routines for utilizing preferences), potential duty savings, import transaction value, and preference margin. γi represents product dummies at the HS 2 level. Descriptive statistics for these regression variables are summarized in Appendix Table A1. The econometric analysis is based on transactions with a positive MFN tariff, providing a reason for utilizing the FTA.
5.1 Firm Size, Number of Import Transactions, and Potential Duty Savings
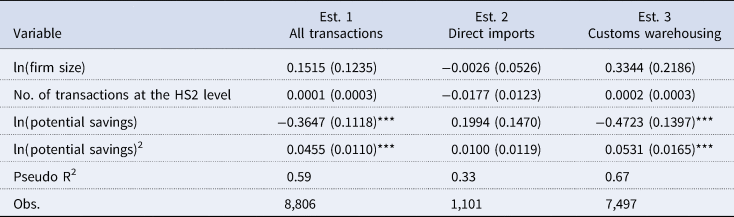
Table 2 presents our baseline estimation, where the likelihood that firms use the FTA is related to firm size, number of import transactions, and potential duty savings. Estimation 1 refers to all observations, whereas estimations 2 and 3 are made separately for direct imports and transactions using customs warehousing.Footnote 7 Because of the smaller number of observations for direct imports, the results reported in estimation 1 are driven mainly by customs warehousing – distinguishing between the two customs modes is therefore important. A first substantive point to note is that the coefficients on firm size and number of transactions are insignificant in all three estimations.Footnote 8 Hence, neither of these two variables seems to have any impact on the likelihood that firms utilize tariff preferences (given that they already belong to the limited set of firms that import from South Korea). The results for potential duty savings are more interesting. Keck and Lendle (Reference Keck and Lendle2012), Nilsson and Dotter (2012), and Albert and Nilsson (Reference Albert and Nilsson2016) note that the costs for using preferences are fixed, which suggests a non-linear impact of potential duty savings. We therefore apply the variable as a second order polynomial, which allows the impact of potential duty savings to vary across small and large saving values.
Probit estimations: size, number or transactions, and potential duty savings as determinants of preference utilization

Notes: ***, **, and * indicate significance at the 1, 5, and 10% level, respectively. Industry fixed effects at the HS 2-digit level included in all estimations. Standard errors clustered at the importing firm within parentheses (.). Estimations are based on transactions with MFN>0 tariffs.
The coefficient for potential duty savings is negative and significant for the full sample and for customs warehousing, but insignificant for direct imports. For the squared term, we have positive and significant coefficients both for the full sample and the customs warehousing subsample.
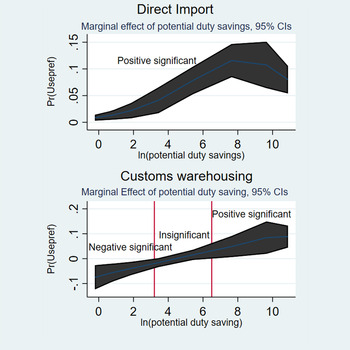
The non-linear impact of potential duty savings complicates the interpretation of the regression results, particularly for direct imports. In principle, the impact can run from negative to positive depending on the size of potential duty savings, but the point estimates in the regression table only give a partial view of this relationship. To facilitate the interpretation of the results, Figure 5 therefore depicts the marginal effects of potential duty saving on preference utilization. A positive value suggests an increased likelihood of using the preference and a negative value indicates reduced preference utilization. Hence, we focus on positive vs. negative values rather than the slope of the function. The shaded area represents the 95% confidence interval.Footnote 9
Potential duty savings and tariff preference utilization
Note: Based on the estimations in Table 2.

The left-hand section of Figure 5 shows that for direct imports there is a positive and significant effect of duty savings on the likelihood that preferences will be used for all recorded values of duty savings. The higher the potential savings, the higher the probability of using the preferences. This is notable, since neither the simple duty savings variable nor its square recorded significant coefficients in Table 2. The downward slope noted for large values suggests that the rate at which preference utilization increases is somewhat lower for the top range of duty savings.
For customs warehousing, the results are consistent with the presence of fixed costs for preference utilization. As the size of potential savings goes from small to large values, the estimated coefficient goes from negative significant to positive significant. This suggests that when savings are small, firms do not bother to apply for tariff preferences, but will typically utilize preferences when large values are at stake.
5.2 Transaction Value and the Preference Margin
Potential duty savings are made up of two components – the transaction value and the preference margin. In the following, we decompose potential duty savings into these two components and examine how they interact with the likelihood of preference utilization. Our expectation is that it may be profitable to claim the tariff preference for large transactions even if the preference margin is low. Similarly, there may be strong incentives to claim the preference even for small transactions if the preference margin is large enough.
To model this interdependence, we replace the variable potential duty savings with variables capturing the preference margin and the transaction size, as well as an interaction term between transaction value and preference margin.Footnote 10 As in Table 2, we also include a squared term to capture a non-linear relationship between the transaction value and preference utilization. Altogether this allows us to examine the following questions:
• How does the impact of the transaction value vary across small and large transactions?
• How does the impact of the transaction value vary across small and large preference margins?
• How does the impact of the preference margin vary across small and large transactions?
• How does the impact of the preference margin vary across small and large preference margins?
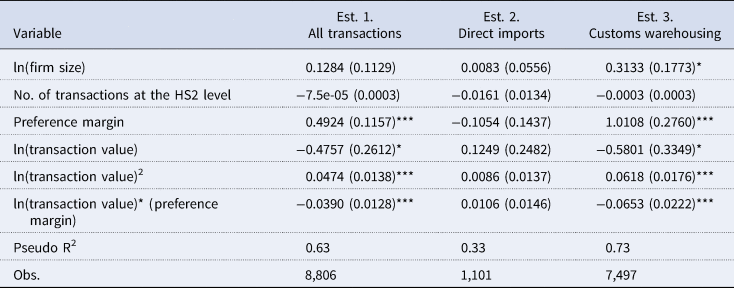
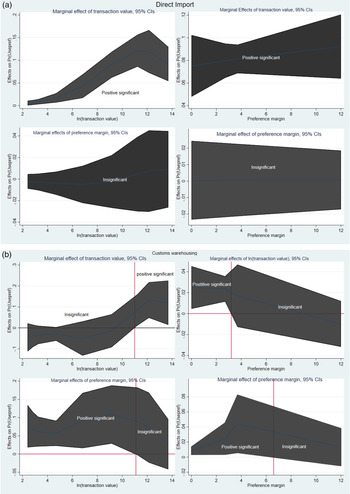
The first estimation in Table 3 refers to all transactions, while estimations 2 and 3 distinguish between direct imports and customs warehousing. As in Table 2, the results for all transactions are driven mainly by customs warehousing. The estimated effects of firm size and number of transactions are similar for the two customs procedures (although the coefficient of firm size in customs warehousing is now mildly significant) but results for the preference margin and transaction value differ. Figure 6a shows the marginal effects from Table 3 for direct imports, whereas Figure 6b depicts the marginal effects for customs warehousing.
Probit estimations: transaction values and preference margins

Notes: ***, **, and* indicate significance at the 1, 5, and 10% level, respectively. Industry fixed effects at the HS 2-digit level included in all estimations. Standard errors clustered at the importing firm within parentheses (.). Estimations are based on transactions with MFN>0 tariffs.
Marginal effects of the transaction value and the preference margin: (a) direct, imports (b) customs warehousing
Note: Based on estimations in Table 3.

5.2.1 Transaction Values
The top row of Figure 6(a) suggests that the marginal effect of transaction value in direct imports is positive and increases both with the size of the transaction and the size of the preference margin. This result captures the combined impact of both the direct effect and the interaction effect and shows that this joint effect is significant when evaluated over the whole range of transaction values, although the point estimates for all variables where transaction value is included are insignificant in column 2 of Table 3. The downward slope for the largest transactions in the upper-left panel of the figure suggests that there is still a positive likelihood that preferences are utilized, although the likelihood is not increasing anymore.
Looking at the marginal effects of transaction value on preference utilization in customs warehousing, the pattern is more unclear (Figure 6b). There is a positive and significant marginal effect for the largest transaction values, but a mixed picture as we move from small to large preference margins. One reasonable generalization is that no matter whether we focus on direct imports or customs warehousing, there is a high likelihood that preferences will be utilized when transactions are large.
5.2.2 The Preference Margin
The bottom rows of Figures 6a and 6b depict the dynamics for the marginal effects of the preference margin. When a free trade agreement enters into force, the possibly most noticeable consequence is that tariffs are reduced, creating a margin between the MFN tariff and the preference tariff. This margin is considered instrumental for firms’ incentives to claim the preference. In line with this reasoning, previous studies have often found a positive relation between preference utilization and preference margins (Keck and Lendle, Reference Keck and Lendle2012). However, the results for direct imports in the bottom row of Figure 6a suggest that the utilization of preferences is at the same level across small and large preference margins as well as across small and large transactions. This is consistent with column 2 of Table 3, which does not show any significant effect of the preference margin on preference utilization in direct imports.
The results for customs warehousing (bottom row of Figure 6b) are similar, with the exception that we record a positive and significant effect of the preference margin on preference utilization for relatively small transaction values and preference margins.
It should be noted that these results do not suggest that the preference margin has no relevance for preference utilization. A positive preference margin is instrumental for the incentive to utilize tariff preferences. Without a positive preference margin, there are no duty savings. The results for direct imports should therefore be understood to mean that there are no strong signs that the utilization of tariff preferences varies significantly with the size of the preference margin.
6. Concluding Remarks
Thanks to the FTA between EU and South Korea, most Swedish imports from South Korea are eligible for tariff preferences. However, tariff reductions are not automatic. Instead, importers must apply to use the preferences and document the South Korean origin of imported products. This process imposes an administrative cost on the firms involved. If the potential duty savings are low and the administrative cost related to preference utilization is high, firms might opt to pay the MFN duty rather than use the FTA.
Using a transaction data set including all Swedish imports from South Korea in November 2016, this research note tries to explain when Swedish importers chose to claim tariff preferences instead of paying import duties. Several major findings can be highlighted. First, the descriptive analysis shows that firms tended either to make full use of the tariff preferences or to make no use of them at all. Only 11% of firms alternated between using and not using the tariff preferences. Second, preferences were used less frequently when the potential duty savings were low. The non-users made up 55% of all firms but accounted for only 10% of the potential duty savings. Third, although earlier studies have suggested that large firms are better able to take advantage of tariff preferences, our transaction-level data show that preference savings rates do not vary linearly across firm size categories. Instead, small firms and large firms record almost identical preference savings rates, at 92–93%.
A novel feature of our analysis is that we distinguish between direct imports and customs warehousing. For most firms, direct imports was the main customs procedure with regard to potential duty savings and preference savings rates. The exception was micro firms, where the two import modes were of equal importance for potential duty savings. In addition, micro firms recorded a remarkably high preference savings rate in their custom warehousing imports, at 99%. This is surprising given the evidence that there are notable administrative costs for utilizing tariff preferences. One possible explanation is that many micro firms may employ the services of trade intermediaries in the logistics and customs brokerage areas, which presumably reduces the cost of preference utilization. However, we have only limited information about the firms using customs warehousing, and we therefore aim to address this issue in closer detail in future research.
The results from the econometric analysis confirm that firm size does not seem to drive the decision to use tariff preferences (once the firm has already decided to become an importer), and suggest that the value of the import transaction and the potential duty savings are more important determinants of preference utilization. If anything, import transaction value stands out as the most robust predictor. The correlation between the preference margin and the utilization of preferences is weak, particularly for direct imports. This weak correlation does not mean that the preference margin is irrelevant for the utilization of tariff preferences. Instead, it suggests that there is little variation in preference utilization with respect to the preference margin. A possible reason is that many firms with direct imports may have developed routines for handling tariff preferences, and that these routines are used irrespective of the preference margin. In customs warehousing, the preference margin seems to matter mainly when transactions are small. A deeper analysis of the development of routines is also left for future research, which can hopefully be based on data for longer time periods and a larger number of firms.
A final note regarding the impact of firm size is warranted. Even if firm size does not seem to explain the variation in preference utilization among the firms in our sample, it should be kept in mind that only a very small share of all micro and small firms imported from South Korea in November 2016 – in relative terms, micro and small firms are underrepresented in our sample. In addition to all other fixed transaction costs that contribute to lower internationalization ratios for smaller firms, it is likely that the administrative costs for using tariff preferences also matter. It can therefore be expected that a reduction of the administrative burden, including simplified rules of origin, would contribute to both increased participation in imports by small firms and increased utilization of tariff preferences, especially for low-value import transactions.
Appendix
Summary statistics for regression variables