Nomenclature
- AUSM
-
Advection Upstream Splitting Method
- CAN-TPS
-
Combined non-ablative thermal protection system
- LPM
-
Long penetration mode
- RANS
-
Reynolds-Averaged Navier Stokes
- SPM
-
Short penetration mode
- SST
-
Shear Stress Transfer
- b
-
Initial pressure, Pa
-
 $c_{p\infty}$
-
Specific heat at constant pressure, J/(K
$\cdot$
mol) - F
-
Drag force, N
- k
-
Slope
-
$P_{\textit{0}}$
-
Total pressure of the freestream, Pa
-
$P_j$
-
Total pressure of the jet, Pa
- PR
-
Total pressure ratio
- Pr
-
Plandtl constant
-
$q_w$
-
Wall heat flux density, W/m2
-
$Re_{grid}$
-
Grid Reynolds number
- St
-
Stanton number
- t
-
Flow time, ms or
$\unicode{x03BC}$
s -
$T_{aw}$
-
Adiabatic wall temperature, K
-
$T_w$
-
Wall temperature, K
-
$T_{\infty}$
-
Freestream temperature, K
-
$u_{\infty}$
-
Freestream velocity, m/s
-
$v_{\infty}$
-
Velocity, m/s
- x, y, z
-
Coordinates, mm
-
$\rho_{\infty}$
-
Density, kg/m3
-
$\mu_{\infty}$
-
Viscosity coefficient
-
$\gamma$
-
Ratio of specific heats
-
$\Delta x$
-
Height value of the first grid layer, mm


1.0 Introduction
The hypersonic vehicle is exposed to large amounts of drag and thermal effects during flight. High temperature can cause the material to lose its original load-bearing capacity for aerodynamic drag and aerodynamic heat. Most failures of electronic devices are caused by high temperature [Reference Antonio and Giuseppe1, Reference Peng2]. In order to ensure the successful completion of the mission of the vehicle, two thermal protection technologies have been proposed, and they have been divided into passive and active protection strategies [Reference Zheng and Ahmed3, Reference Gerdroodbary4]. Passive heat protection is achieved by developing some new temperature-resistant insulation materials for the thermal protection of the vehicle [Reference Huang and Yao5], but the long flight time and continuous high-temperature heating make the temperature resistance of the material limited [Reference Lu, Jiang, Luo and Hu6, Reference Ma, Guo and Zhang7]. Therefore, it is not possible to rely solely on the thermal performance of the material to achieve long-duration hypersonic flight. Researchers hope to investigate the effectiveness of thermal protection of the vehicle by improving some physical structures, such as counterflowing jet [Reference Hassanvand, Gerdroodbary and Abazari8], concave cavities [Reference Pish, Man, Gerdroodbary, Nam, Moradi and Babazadeh9] and drag spikes [Reference Ladoon, Schneider and Schmisseur10–Reference Kalimuthu, Mehta and Rathakrishnan14], as well as some combinations [Reference Pish, Moradi, Edalatpour and Gerdroodbary15–Reference Huang, Chen, Yan, Yan and Du19], but severe localised aerodynamic heating still exists. In the 1950s, scholars began to study the opposing jet in the hypersonic flow. Love [Reference Love20] conducted an experimental study of the opposing jet under high supersonic conditions, focusing on the physical phenomena of the jet in the free flow. Through a jet experiment with a shrinking structure, Finley [Reference Finley21] discovered that the jet pushes the excitation wave away from the object surface, effectively reducing the drag and heat flux on the wall. This opens up new ideas for the study of the drag reduction and thermal protection for the hypersonic vehicle. The jet plays an important role in the combination scheme with drag spikes, concave cavities and porous jets [Reference Shahab and Sarallah22–Reference Ji, Liu, Huang, Li and Yan26]. Sun et al. [Reference Sun, Guo, Huang, Li and Yan27] used a combination of an opposing jet and a concave cavity scheme. The concave cavity was redesigned using a parabolic shape based on the cylindrical concave cavity. It was found that the parabolic concave cavity has a better heat reduction effect than the cylindrical one. Sudarshan et al. [Reference Sudarshan, Rao, Jagadeesh and Saravanan28] used a wind tunnel with a Mach number of 6.0 and a high total jet pressure ratio to experimentally investigate the intracavity heat transfer variation and shock wave characteristics of cylindrical and parabolic concave cavities combined with an opposing jet. The results show that the combined body has better flow field amplitude characteristics and thermal protection compared with a single concave cavity. Compared with the cylindrical concave cavity, the parabolic concave cavity has less effect on the excitation wave action, and the heat flux in the concave cavity is lower. Huang et al. [Reference Huang and Yao29] proposed a combined non-ablative thermal protection system (CAN-TPS), and it consists of a blunt body, a drag spike, and front and rear jet holes. The results show that the protection effect of CAN-TPS is improved with the increase in the length of the drag spike, the increase of the total jet pressure ratio, and the increase of the front and rear jet hole diameters.
As scholars have studied the jet in more depth, two different jet structures have been discovered. Shang et al. [Reference Shang and Hayes30] found that excitation bifurcation is observed when the length of the jet is near a critical value at high supersonic flow. At this point, the flow field oscillates violently [Reference Demetriades and Hopkins31, Reference Reding32]. Romeo and Sterrett [Reference Romeo and Sterrett33, Reference Romeo and Sterrett34] studied the effect of the jet on the bow shock for a Mach number of 6. Two modes of shock wave displacement are revealed, namely one in which the size of the bow shock wave increases, but the structure remains unchanged. In the second mode, the distance between the shock wave and the wall increases significantly, and the shock wave will become unstable as the Mach number and the total pressure ratio increase. Philip et al. [Reference Philip and Richard35] showed two modes of the jet, namely long penetration mode (LPM) and short penetration mode (SPM), using a shadowgraph. In their experiments, Hayashi et al. [Reference Hayashi and Aso36, Reference Hayashi, Aso and Tani37] observed the phenomena of LPM and SPM. In the long penetration mode, the wall heat flux is higher than in the no-jet mode, and numerical simulations were used to find that the predicted results match the experimental data well. Shen et al. [Reference Shen and Liu38] found that the LPM flow field structure is unstable and subject to large oscillations when compared with SPM [Reference Sriram and Jagadeesh39–Reference Venkatachari, Cheng and Chang41]. Deng [Reference Deng, Xie, Huang, Dong and Zhang42] observed that SPM is high frequency and low amplitude, and LPM is low frequency and high amplitude by flow field characteristics. Lee et al. [Reference Lee, Lee and Huh43] found that the freestream Mach number causes differences in the flow field structures, and a maximum value of the drag reduction exists as the Mach number varies. With the increase of the jet mass flow rate, Venkatachari et al. [Reference Venkatachari, Mullane and Cheng44] discovered the features of a short-to-long-to-short penetration-mode pattern. Kim et al. [Reference Kim, Roh, Huh and Lee45] used RANS approaches to solve and analyse the drag coefficient of the blunt body. The drag reduction effect of the jet was found to increase with the increase of the mass flow rate, and the minimum drag was found to be at the transition from the LPM flow field structures to the SPM flow field structures. Bibi et al. [Reference Bibi, Maqsood, Sherbaz and Dala46] found that expansion nozzles were able to achieve long jet patterns at lower total pressure ratios. Huang et al. [Reference Huang, Yao and Jiang47] studied the flow field reconfiguration phenomenon of the jet using steady-state computational approaches for the LPM and SPM flow field structures for aerodynamic and temperature studies, respectively. The results show that LPM has a better ability to reduce the shock wave intensity than SPM near the critical total pressure ratio. Wang et al. [Reference Wang and Zhang48] found that the larger the nozzle size, the less favourable the formation of the long jet penetration mode. Li et al. [Reference Li, Wang, Huang and Liu49, Reference Li, Wang, Huang and Liu50] investigated the jet hole shape and compared the effects of different jet hole shapes on the resistance and thermal protection of the opposing jet, and designed the geometric configuration of the opposing jet hole with equal polygons. Warren [Reference Warren51] concluded experimentally that a nitrogen jet has better cooling than a helium jet for equal total pressure ratios. Zhang et al. [Reference Zhang, Huang, Yan, Li, Li and Moradi52] studied the flow field characteristics of jets and replaced the steady-state jets with periodically varying pulsed jets. Pulsed jets with longer periods were found to have better drag and thermal reduction performance [Reference Zhang, Huang, Li, Chen and Moradi53], and the effects of three jet total pressure ratio waveforms on drag and thermal reduction prevention were investigated as well, namely rectangular, triangular and sinusoidal waves. Among them, the triangular wave has the best effect in terms of drag and heat reduction performance [Reference Zhang, Huang, Yan, Chen and Moradi54].
To the authors’ knowledge, the mode transition between the long and short penetration modes is not clear till now, and this is very important for the design of a novel thermal protection system with active flow control approaches. In this paper, the flow field reconfiguration process, and the drag and thermal reduction performance during the jet mode transition are investigated by two different conditions of jet total pressure ratio variation. The variation of the jet pressure ratio is divided into positive and negative slopes, and the absolute values of the slopes correspond to equal values, and there are four working conditions for each slope, respectively.
2.0 Physical model and numerical method
2.1 Physical model
A physical model of a semi-blunt body with a radius of 25mm is adopted, and a jet hole with a radius of 2mm is set at the stagnation point of the blunt body. An arc area with a radius of 125mm is set as the calculation area of the outflow field. The far-field boundary is set as the pressure far field, and the outlet boundary is set as the pressure outlet. The wall of the blunt body is considered to be isothermal without slip wall, and the jet boundary is set as the pressure inlet. The name and size of each boundary are shown in Fig. 1, and the default unit is millimetres.
Blunt body with jet hole employed in the current study.

2.2 Numerical approaches and grid system
The experiments conducted by Hayashi et al. [Reference Hayashi, Aso and Tani37] and the relative available experimental data [Reference Zhang, Huang, Yan, Li, Li and Moradi52] were used for numerical validation. The freestream Mach number is 3.98, the total temperature is 397K, and the total pressure is 1.37MPa. The nitrogen flow is injected from the jet hole with the Mach number being 1.0 in the direction opposite to the incoming flow direction. The total temperature of the jet flow is 300K, and the total pressure ratio is 0.6. The wall of the blunt body is set to be isothermal non-slip, and its temperature is 295K. The governing equations are the Reynolds-averaged Navier-Stokes equations, and the turbulence model is the SST k-ω model, which is based on the density-based implicit solver. The first order upwind scheme is used to solve the equations, and the AUSM flux type is used to control the equations of convection item. The unsteady solution method is used for the dual-time formulation of LUSGS. In order to accelerate the convergence speed and keep the calculation stable, the Courant number is set to be 0.5.
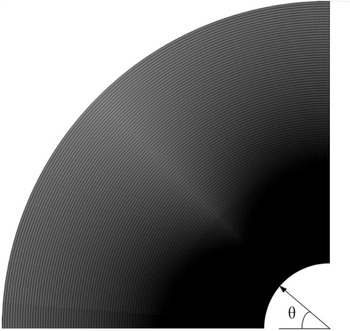
The commercial softwares ICEM and Fluent are used for grid generation and numerical calculation, respectively. The grid is the key factor in the numerical simulation, and it determines the accuracy of the calculation results. Grid-independent validation is achieved by increasing the number of grids and changing the height value of the first grid layer. The number of grids increases by adding line nodes, and the height value of the first grid layer is based on the grid Reynolds number criterion for the wall parameters. Grid Reynolds number is defined as
 ${{\mathop{\rm Re}\nolimits} _{grid}} = {\rho _\infty }{v_\infty }\Delta x/{\mu _\infty }$
. ρ
∞
, v
∞
and μ
∞
are the density, velocity and viscosity coefficient of the freestream respectively. Δx is the height value of the first grid layer. The grid employed is shown in Fig. 2, and the grid number is about 140 thousand. The dimensionless Stanton number is selected to reflect the wall heat flow distribution, and St is defined as the following equations [Reference Hayashi and Aso36].
 \begin{align}St = \frac{{{q_w}}}{{\left( {{T_{aw}} - {T_w}} \right){\rho _\infty }{c_{p\infty }}{u_\infty }}}{\rm{ }}\end{align}
 \begin{align}{T_{aw}} = {T_\infty }\left\{ {1 + \sqrt[3]{{Pr}}\left[ {\left( \gamma \right. - \left. 1 \right)/2} \right]Ma_\infty ^2} \right\}\end{align}
Herein, q w is the wall heat flux density, T aw is an adiabatic wall temperature, T w is the wall temperature, ρ ∞ is the freestream density, c p∞ is the specific heat at constant pressure, u ∞ is the freestream velocity, T ∞ is the freestream temperature, Pr is the Plandtl constant and γ is the ratio of specific heats.
Computing grid for the current study.

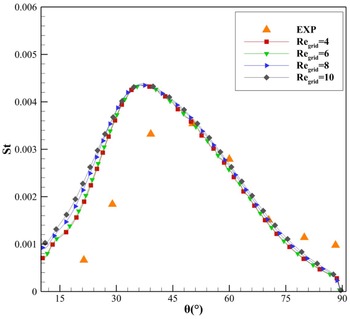
Wall Stanton number distributions with different grid Reynolds numbers.

Figure 3 shows the comparison of St distributions with the experimental data for different grid Reynolds numbers. It is obvious that the wall St distribution tends to be stable as the grid Reynolds number decreases. When Regrid = 4 and Regrid = 6, the St distributions are almost identical. When
 ${\rm{\theta }} \le {\rm{4}}{{\rm{5}}^{\rm{o}}}$
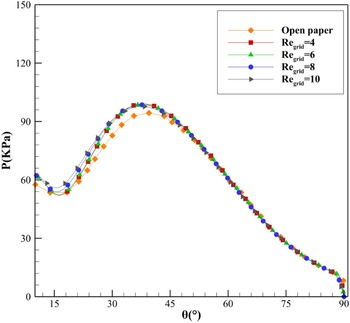
, the St is larger than the experimental values. The gas temperature rises though the shock wave, so the wall is heated by high temperature gas actually, while the wall is set as an isothermal wall in the simulation process. This may result in the temperature difference between the wall and the fluid domain being larger, which enhances the convective heat exchange action and increases the Stanton number. Figure 4 shows the comparison of surface pressure distributions for different grid Reynolds numbers. The predicted results show good agreement with the open paper results.
Pressure distributions with different grid Reynolds numbers.

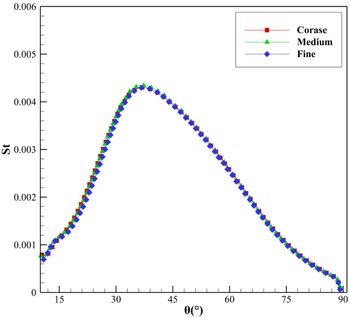
Figure 5 shows a comparison of St distributions with three kinds of grid scale. The numbers of coarse, medium and fine grids are 131920, 148992 and 200208, respectively.
Comparison of Stanton number distributions with different grid scales.

2.3 Jet function control
In the current study, two kinds of the governing equation of the jet total pressure are set as follows.
 \begin{align}{{\rm{P}}_k}(t) = {\rm{k}}t + {\rm{b\quad (k > 0)}}\end{align}
 \begin{align}{{\rm{P}}_{ - k}}(t) = - {\rm{k}}t + {\rm{b\quad (k > 0)}}\end{align}
Herein, k and −k are the slopes, and they represent the speed of the total pressure ratio variation. The initial pressure is set to be b. In order to realise the conversion of the jet mode transitions from LPM to SPM or from SPM to LPM, different kinds of jet control function are established. The control functions are set to be P k1, P k2, P k3, P k∞, P -k1, P -k2, P -k3 and P -k∞ respectively. They are monotonous increasing or decreasing functions, and the total pressure ratio increases or decreases relative to the initial value. The numerical simulation of the initial jet flow field is used for the steady calculation methods first. Then, jet control functions are used for the following calculation. The total pressure ratio is defined as PR = P j /P 0 . P 0 is the total pressure of the freestream, and P j is the total pressure of the jet. For the functions of P k1, P k2, P k3 and P k∞, the initial PR value is set to be 0.05, and b is set to be 2.0125×10⁵Pa. For the functions of P -k1, P -k2, P -k3 and P -k∞, the initial PR value is set to be 0.1, and b is set to be 4.025×10⁵Pa. The k values for all the functions are set to 2.0125×10⁸, 2.0125×10⁸, 2.0125×10⁸, 2.0125×10⁸ and 2.0125×10⁸, respectively. The total pressure control functions of the jet can be determined as follows.
 \begin{align}{{\rm{P}}_{k1}}(t) = 2{\rm{.0125}} \times {\rm{1}}{{\rm{0}}^8}t{\rm{ \;+\; 2}}{\rm{.0125}} \times {\rm{1}}{{\rm{0}}^5} \qquad 0 \le t \le 1 \times {10^{ - 3}}\end{align}
 \begin{align}{{\rm{P}}_{k2}}(t) = \left\{ {\begin{array}{c@{\quad}c}{{\rm{3}}{\rm{.3542}} \times {\rm{1}}{{\rm{0}}^8}t{\rm{ \;+\; 2}}{\rm{.0125}} \times {\rm{1}}{{\rm{0}}^5}} & {0 \le t \le {\rm{6}} \times {\rm{1}}{{\rm{0}}^{ - 4}}}\\[5pt] {402500} & {{\rm{ 6}} \times {\rm{1}}{{\rm{0}}^{ - 4}} < t \le 1 \times {{10}^{ - 3}}}\end{array}} \right.\end{align}
 \begin{align}{{\rm{P}}_{k3}}(t) = \left\{ {\begin{array}{c@{\quad}c}{{\rm{1}}{\rm{.0063}} \times {\rm{1}}{{\rm{0}}^9}t{\rm{ \;+\; 2}}{\rm{.0125}} \times {\rm{1}}{{\rm{0}}^5}} & {0 \le t \le {\rm{2}} \times {\rm{1}}{{\rm{0}}^{ - 4}}}\\[5pt] {402500} & {{\rm{ 2}} \times {\rm{1}}{{\rm{0}}^{ - 4}} < t \le 1 \times {{10}^{ - 3}}}\end{array}} \right.\end{align}
 \begin{align}{{\rm{P}}_{k\infty }}(t) =402500 \qquad\qquad\quad\qquad\qquad\qquad 0 \le t \le 1 \times {10^{ - 3}}\end{align}
 \begin{align}{{\rm{P}}_{ - k1}}{\rm{(}}t{\rm{)}} = \left\{ {\begin{array}{c@{\quad}c}{{\rm{ - 2}}{\rm{.0125}} \times {\rm{1}}{{\rm{0}}^8}t{\rm{ \;+\; 4}}{\rm{.025}} \times {\rm{1}}{{\rm{0}}^5}} & {0 \le t \le 1 \times {{10}^{ - 3}}}\\[5pt] {201250} & {1 \times {{10}^{ - 3}}\;{\rm{ < }}\;t \le {\rm{1}}{\rm{.6}} \times {{10}^{ - 3}}}\end{array}} \right.\end{align}
 \begin{align}{{\rm{P}}_{ - k2}}{\rm{(}}t{\rm{)}} = \left\{ {\begin{array}{c@{\quad}c}{{\rm{ - 3}}{\rm{.3542}} \times {\rm{1}}{{\rm{0}}^8}t{\rm{ \;+\; 4}}{\rm{.025}} \times {\rm{1}}{{\rm{0}}^5}} & {0 \le t \le 6 \times {{10}^{ - 4}}}\\[5pt] {201250} & {6 \times {{10}^{ - 4}}\;{\rm{ < }}\;t \le {\rm{1}}{\rm{.6}} \times {{10}^{ - 3}}}\end{array}} \right.\end{align}
 \begin{align}{{\rm{P}}_{ - k3}}(t) =\left\{ {\begin{array}{c@{\quad}c}{{\rm{ - 1}}{\rm{.0063}} \times {\rm{1}}{{\rm{0}}^9}t{\rm{ \;+\; 4}}{\rm{.025}} \times {\rm{1}}{{\rm{0}}^5}} & {0 \le t \le {\rm{2}} \times {\rm{1}}{{\rm{0}}^{ - 4}}}\\[5pt] {201250} & {{\rm{2}} \times {\rm{1}}{{\rm{0}}^{ - 4}} < t \le 1.6 \times {{10}^{ - 3}}}\end{array}} \right.\end{align}
 \begin{align}{{\rm{P}}_{ - k\infty }}(t) = 201250\qquad\qquad\qquad\qquad\qquad\qquad 0 \le t \le 1.6 \times {10^{ - 3}}\end{align}
In order to express the variation of each function more visually, the graphs of different functions corresponding to the total pressure ratio of the jet are shown in Figs. 6 and 7. For Pk, the initial value of PR is 0.05, the final value is 0.1, and the total flow time is 1ms. For Pk1, the PR increases to 0.1 for a flow time of 1ms. For Pk2, the PR increases to 0.1 for a flow time of 0.6ms and remains at 0.1 for the remaining 0.4ms. For Pk3, the PR increases to 0.1 for a flow time of 0.2ms and remains at 0.1 for the remaining 0.8ms. For Pk∞, the initial flow field is PR = 0.05, and the total pressure ratio is set to be 0.1 after the start of the new flow until the end. For P -k, the initial value of PR is 0.1, the final value is 0.05, and the total flow time is 1.6ms. For P -k1, the PR decreases to 0.05 at a flow time of 1ms and remains at 0.05 for the remaining 0.6ms. for P -k2, the PR decreases to 0.05 at a flow time of 0.6ms and remains at 0.05 for the remaining 1ms. for P -k3, the PR decreases to 0.05 for a flow time of 0.2ms and remains at 0.05 for the remaining 1.4ms. For P -k∞, the initial flow field is PR = 0.1, and the total pressure ratio is set to be 0.5 after the start of the new flow until the end.
The increasing functions that control the total pressure ratio of the jet (k).

The reducing functions that control the total pressure ratio of the jet (−k).

3.0 Results and discussion
3.1 Analysis of the flow field characteristics under Pk jet conditions
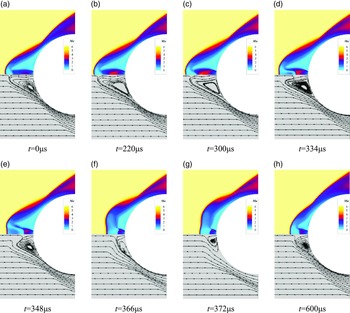
The change rate of the total pressure ratio is k2 as the object of this study in the flow field. As shown in Fig. 2, the value of Pk2 is known to change in Equation (3). The initial k2 value corresponds to a PR value of 0.05, which rises to a peak at t = 0.6ms, when the PR value is 0.1. The flow time t is between 0.6 and 1ms, and the pressure at the jet outlet remains constant, namely the PR value is stable at 0.1. The Mach number and streamline contours at some typical moments are shown in Fig. 8.
Process of flow field variation of jet mode transition from LPM to SPM.

As shown in Fig. 8, when the total jet pressure ratio starts to increase, the whole flow field change process is drastic, especially for the flow field reconstruction process of the jet mode transition from LPM to SPM, which is a strong transient process. The jet length becomes short in about 32μs, and the whole flow field structure completes the reconstruction in about 300μs.
The flow field structure for the LPM jet at PR = 0.05 is shown in Fig. 8(a) before the change in the jet pressure. Figure 8(b) and (c) are corresponding to flow times of 220μs and 300μs, respectively. At this point, the flow field structures are basically unchanged. Compared with Fig. 8(a), the jet gas after the exit in Fig. 8(b) and (c) expands, the Mach number becomes larger, the Mach number range also becomes larger, and the jet penetration length increases. At t = 334μs in Fig. 8(d), the jet length decreases, the oblique shock wave forms in front of the blunt body, the reattachment shock wave forms at the shoulder of the blunt body, and the recirculation zone is formed near the shear layer and the wall. At this time, the shock wave envelope near the blunt body, the size of the recirculation zone, and the position of the shock wave reattachment remain basically the same, but the penetration length of the jet workpiece forward becomes shorter. At this flow time, the stagnation point moves closer to the wall, the expansion region behind the jet exit becomes smaller, and the supersonic region decreases rapidly, taking the shape of a short middle and long sides, similar to the shape of a “concave cavity” opening to the left. From the streamline contour, it is observed that the freestream near the symmetric axis temporarily enters into the concave cavity after the shock wave, and this part of the gas flows along the boundary of the concave cavity near the stagnation point, appearing backflow phenomenon. The presence of the recirculation zone brings out the gas entering the concave cavity in the opposite direction and into the shear layer. This leads to a larger gas force in the recirculation zone, which is not conducive to maintain the original flow field structure, and a shorter jet distance after the jet exit, which in turn leads to a weaker support for the original flow field structure in the long jet penetration mode. In Fig. 8(e), when t = 348μs, the recirculation zone becomes smaller rapidly, the stagnation point continues to approach the wall, the concave cavity becomes larger, the thickness decreases to the left, and the thickness in the middle decreases more obviously. This is because the gas entering the concave cavity moves around near the stagnation point and continues to push away the concave cavity near the recirculation zone, which expands to facilitate the outflow of the gas entering the concave cavity. It is obvious from the streamline contour that the gas in the recirculation zone flows out along the shear layer, and the recirculation zone decreases. The original jet cannot maintain the concave cavity structure formed by the stagnation point suddenly close to the wall, and the effect of the concave cavity on the gas is weakened. In Fig. 8(f), at t = 366μs, the concave cavity structure disappears, and the gas near the stagnation point flows up and down under the action of the jet workpiece. It is observed from the flow diagram that the gas outflow from the recirculation zone continues to decrease. Figure 8(g) at t = 372μs, the recirculation zone after experiencing excessive extrusion brought about by changes in the flow field, the changes in the structure of the jet, the shock wave from the body surface distance becomes shorter, the emergence of part of the free flow after the shock wave and after the exit of the jet fills the recirculation zone, the recirculation zone and Mach disk enlarge. At t = 600μs in Fig. 8(h), the recirculation zone and Mach disk are stable.
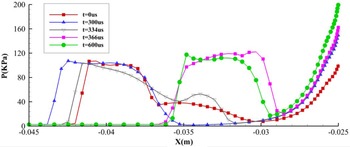
Figure 9 shows the pressure distributions at some typical moments on the symmetric axis, with the centre of the blunt body circle as the origin and the left side as the negative direction. At the moment t = 0μs, the jet gas expands after the exit, and the pressure drops to a minimum near x = −0.03m and the Mach number increases. Then, the pressure rises slowly, with a turning point near x = −0.037m, where the pressure rises rapidly. At the moment t = 300μs, the turning point of the slow pressure rise disappears, and at this time, the length of the jet is the longest. At t = 334μs, the pressure low point of the expansion after the jet exit returns to the surroundings of x = −0.03m, the jet length becomes shorter, and the pressure presents an intermediate concavity at x = −0.035m. At t = 366μs, the jet length is relatively stable.
The pressure distributions at some typical moments on the symmetric axis (k).

3.2 Analysis of the wall parameter under Pk jet conditions
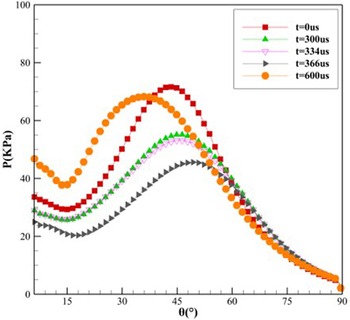
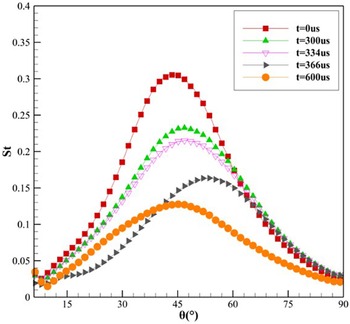
In order to study the effect of the variation of the flow field structure on the wall parameters when the jet mode transforms from LPM to SPM. The flow times of 0, 300, 334, 366, and 600μs are the typical moments selected. The distributions of wall pressure and Stanton number at the corresponding moments are given to study the drag reduction and thermal protection performance of the blunt body during the jet mode transition. The pressure distributions during the transformation from LPM to SPM is shown in Fig. 10, and the Stanton number distributions during the transformation from LPM to SPM is shown in Fig. 11.
The pressure distributions at moments (k).

Wall St distributions at moments (k).

When t = 0μs, the total pressure ratio of the jet is 0.05, and the jet is in the long jet penetration mode at this time, the initial flow field structure is shown in Fig. 8(a). At t = 300μs, the wall pressure and Stanton number distributions decrease generally, with the peak decreasing and moving toward the rear of the blunt body. When t = 300μs, it can be seen in Fig. 9 that the pressure on the symmetric axis decreases to the freestream pressure around x = −0.035m. The pressure distribution moves close to the wall, and a distribution similar to that of the short jet penetration mode appears. Due to the presence of the jet and the free shear layer, a low-pressure zone will be formed in the recirculation zone formed by the wall. In Fig. 8(c), the position of the shock wave reattachment is moved back, the angle of the gas acting on the wall becomes smaller, the pressure on the wall in the normal direction decreases, the peak pressure decreases, and it can be observed that the gas velocity after the jet exit increases, the jet penetration length becomes longer, the recirculation zone increases, and the low-pressure zone becomes larger. At the same time, compared with the initial flow field, the reattachment shock wave is far away from the wall, the effect of the shock wave on the wall is weakened, the wall pressure decreases, and the temperature decreases, resulting in a decrease in the peak Stanton number. When t = 334μs, the supersonic velocity region after the jet exits rapidly decreases, but the overall flow field does not change much and has little effect on the wall surface, as shown in Fig. 8(d). It can be seen in Figs. 10 and 11 that the wall pressure and the Stanton number distributions do not vary much. When t = 366μs, the pressure distributions continues to decrease, the peak pressure decreases, and the peak moves in the direction of the large θ angle. It can also be observed in Fig. 8(f) that the front bow shock position is close to the physical surface, the free flow of gas coming through the shock is subjected to the action of the opposing jet and the physical surface and flows backward with a larger deflection angle, the position of the oblique shock is raised, the angle between the oblique shock and the wall above the recirculation area becomes smaller, the pressure on the shock reattachment position is reduced, and the wall Stanton number is lowered. Compared with the initial condition, the peak pressure and peak Stanton number at the moment t = 366μs are reduced by 36.39% and 46.40%, respectively. When t = 600μs, the total pressure ratio arrives at the peak, namely, PR = 0.1. In Fig. 8(h), the jet length becomes shorter, the shock wave reattachment position moves forward, the wall is enveloped by the surrounding formed shock wave, the oblique shock wave is enhanced, the shock wave reattachment position is far away from the wall, and the thermal environment of the wall is improved. As shown in Fig. 10, the wall pressure rises, and in Fig. 11, the wall Stanton number becomes lower.
In order to study the variation of the wall parameters during the transition from the long jet penetration mode to the short jet penetration mode for different variations of the total jet pressure ratio, incremental functions with different slopes, such as Pk1, Pk2, Pk3, Pk∞, are given to control the jet, and their corresponding to the peak Stanton number and the variation law of the drag force with time are shown in Figs. 12 and 13.
St peaks with time for various k values.

Drag force with time for various k values.

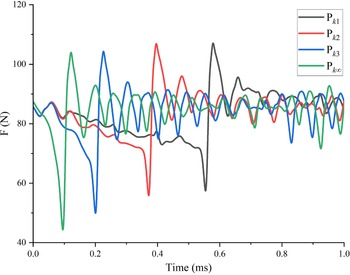
The flow field structure varies sharply during the transition from the long jet penetration mode to the short jet penetration mode. As shown in Figs. 12 and 13, the peak Stanton number and drag force continue to decrease during the jet mode transition. As the value of k decreases, the time of drastic variation of wall parameters is delayed. The wall parameters have a “jump” phenomenon after the jet length is shortened, as shown in Figs. 12 and 13, where the peak Stanton number and the drag force decrease to a minimum value and then increase rapidly. As the flow time continues to increase, the peak Stanton number and resistance are in a relatively stable range. It can be seen that the slope of the change in the total pressure ratio increases and the jump time of the peak Stanton number and drag appears earlier. This is due to the fact that an increase in the total pressure ratio takes less time to reach the mode transition pressure at which the long-short jet penetration mode transition occurs in the flow field. Secondly, the change of the flow field structure after the alteration of the jet conditions takes some time to reconstruct, reflecting the hysteresis of the flow field change. Since the variation of the flow field takes some time, the time for the jump of the effect of increasing the k value on the drag force and the peak Stanton number is limited. Figure 12 shows that the larger the value of k, the smaller the value of the Stanton number, the minimum values at the jump, and the larger the maximum value. In Fig. 13, the drag force shows a significant variation at the jump for the minimum values and a less significant variation for the maximum values. These changes at the jump may be due to the increase in wall parameter variations caused by large variations in jet pressure and increased structural variations in the flow field.
3.3 Analysis of the flow field characteristics under P -k jet conditions
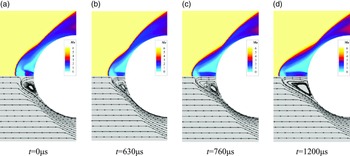
In order to study the effect of the reduction of the total jet pressure ratio on the jet mode transition, the total pressure ratio variation with a negative slope (−k < 0) is used. The rate of variation of the total pressure ratio with a slope of −k2 is used to study the transition of SPM to LPM. The Mach number and streamline contours are given as shown in Fig. 14. The total pressure ratio (PR) of the jet is 0.1 at the initial state t = 0 μs, as shown in the flow field structure of the short jet penetration mode in Fig. 14(a). As shown in Fig. 14(b), the gas acceleration effect decreases after the jet exits at t = 630μs, and the jet near the recirculation zone is parallel to the exit boundary. Relative to the initial state, the Mach disk disappears, the gas expansion effect is weakened, and the jet length becomes shorter. When t = 760μs, the jet length becomes longer, the front shock wave is pushed away from the physical surface, the recirculation zone continues to increase, and the shock wave reattachment position moves back. When t = 1,200μs, the jet length reaches a stable state, the recirculation zone increases significantly, and the shock wave reattachment position continues to move backward, which is conducive to the pressure reduction at the wall. The cooling gas at the jet exit will further reduce the temperature of the surge against the wall. During the transition from SPM to LPM, the jet length changes slowly, and no jump in jet length is observed.
Process of flow field variation of jet mode transition from SPM to LPM.

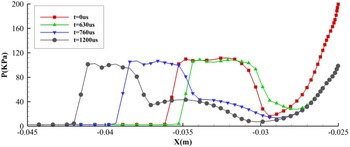
Figure 15 shows the pressure distribution on the symmetric axis after the jet exits. The pressure decreases rapidly after the gas exits, and the velocity increases to the supersonic speed. After the gas continues to flow forward, the velocity decreases to the speed of sound and below, and the pressure rises, eventually meeting the gas passing through the shock wave at the stagnation point. At t = 630μs, the distance of the sudden change in pressure ahead becomes shorter, which is due to the decrease in pressure resulting in a shorter length of the jet. As the gas flow time increases, at t = 760μs, the jet length increases and the gas pressure after the exit decreases, after which the pressure rises in a slowly rising phase, similar to the initial long jet penetration mode pressure distribution in Fig. 9. When t = 1,200μs, the jet length is longer, and the pressure decreases significantly after the outlet.
Pressure distributions at some typical moments on the symmetric axis (−k).

The pressure distributions at moments (−k).

Wall St distributions at moments (−k).

St peaks with time for various k values.

Drag force with time for various k values.

3.4 Analysis of the wall parameter under P -k jet conditions
In order to study the drag reduction and thermal protection performance of the wall during the transition from the short jet penetration mode to the long jet penetration mode, the wall pressure distributions and the Stanton number distributions at different moments are given in Figs. 16 and 17, respectively.
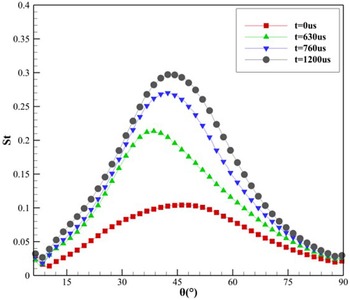
When t = 630μs, the recirculation zone decreases, and the excitation reattachment position moves forward. The normal distance between the attached shock wave and the wall becomes shorter, so the influence of the shock wave on the wall increases here. As shown in Fig. 16, the pressure at the wall increases at this moment. When t = 760μs and t = 1200μs, after the jet length increases, the oblique shock wave weakens, and then the angle between the attachment shock wave and the wall decreases, which will lead to a weakening of the normal pressure. As shown in Fig. 16, the wall pressure decreases. However, the weakening of the oblique shock wave leads to a higher velocity of the free flow after the shock wave, resulting in a sharp change in the velocity of the gas near the wall, which will lead to an increase in the temperature. As shown in Fig. 17, the wall St increases.
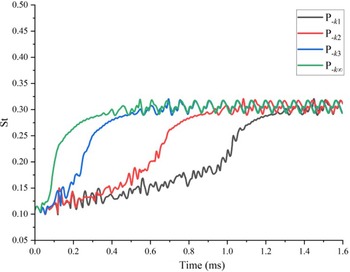
In order to study the variation of the wall parameters during the transition from the short penetration jet mode to the long jet penetration mode for different variations of the total jet pressure ratio, decreasing functions with different slopes, such as P -k1, P -k2, P -k3, P -k∞ are given to control the jet. The corresponding peak Stanton number and the variation law of the drag force with time are shown in Figs. 18 and 19.
As the value of −k decreases, the rate of variation of the total pressure ratio is large. When the jet mode transforms from a short jet penetration mode to a long jet penetration mode, both the peak Stanton number and the drag force reach a relatively stable range in advance, and the mode transition time is shortened. As shown in Fig. 19, there is a process of rising drag force. The short jet penetration mode has increased drag caused by shorter jet lengths due to the reduction in total pressure ratio, and then the drag decreases as the jet length gradually becomes longer and the drag decreases.
4.0 Conclusions
In this paper, the long and short jet penetration mode transitions occurring in a blunt body with the opposing jet are investigated in more detail by controlling the unsteady jet pressure. The transition mechanism between LPM and SPM is studied. The influence of long and short jet penetration modes on the wall during the formation of flow time is analysed. The variation of wall parameters at different change rates is studied and summarised as follows.
-
(1) The flow field formation time is different for the long and short jet penetration modes. The jet mode transition from LPM to SPM takes a short time, which is reflected in the sudden shortening of the jet length. The pressure on the symmetric axis is lower during the shortening process and moves from left to right, eventually forming a SPM pressure distribution at the right end. The jet mode transition from SPM to LPM takes a longer time, and the flow field structure varies slowly without the phenomenon of a jump in the jet length.
-
(2) The change in the flow field caused by the change in the jet length is reflected on the wall of the blunt body, thus causing a change in the wall parameters. During the transition from LPM to SPM, both the pressure and the Stanton number decrease. Within a short period of time, after the jet length becomes shorter, the wall parameters rise sharply and then decrease again to return to a stable range. During the transition from SPM to LPM, the pressure decreases while the Stanton number increases, and the flow field stabilises without any jump in wall parameters. Therefore, the formation of SPM from LPM is beneficial to the blunt head body to reduce drag and prevent thermal, and the formation of LPM from SPM is beneficial to reduce drag, but the effect of thermal prevention will become worse.
-
(3) The rate of variation of the total pressure ratio affects the time of the jet mode transition and the magnitude of the wall parameters of the transition process. In the process of converting the LPM to SPM, the larger the k value of the total pressure ratio changes, the earlier the mode changes, and the more pronounced the peak Stanton number and the jump of drag on the wall after forming the SPM. The smaller the −k value of the total pressure ratio change during the conversion of SPM mode to LPM, the earlier the mode changes and the smaller the change of the wall parameters at different slopes. This indicates that a large rate of change is beneficial to shorten the time of long and short jet penetration mode transitions.
Conflict of interest statement
The authors declare there is no conflict of interest regarding the publication of this paper.
Data availability
The data that supports the findings of this study are available within this paper.
Acknowledgements
The authors would like to express their thanks for the support from the National Natural Science Foundation of China (No. 11972368), the National Key R&D Program of China (No. 2019YFA0405300) and Natural Science Foundation of Hunan Province of China (No. 2021JJ10045). The authors also thank the reviewers and Prof. Peter Curtis for their constructive recommendations.