1. Introduction
I document empirical evidence on birth-month selections and differential school-entry timing decisions by birth month in South Korea and analyze the reasons for them. This study is motivated by the following three observations: (1) the number of births in January is disproportionately higher than that in December in South Korea; (2) the ratio of children who delayed school enrollment is substantially higher for children born in January than for those born in December before the year 2010; (3) the large difference in the ratio of delayed school enrollment between December and January births disappears after the change in school-entry-cutoff date from March 1 to January 1 in 2010. I argue that these phenomena occur due to deliberate decisions by parents and the birth-month selection is related to consideration for when to enter school. I also show that custom, culture, and school-entry rule are the fundamental components that strongly affect these decisions.
One of the main principles in economics is that people respond to incentives. The choice of birth timing is not an exception to this rule. It is well documented that parents can respond to economic incentives when they decide the timing of childbirth [Dickert-Conlin and Chandra (Reference Dickert-Conlin and Chandra1999), Gans and Leigh (Reference Gans and Leigh2009), LaLumia et al. (Reference LaLumia, Sallee and Turner2015), Neugart and Ohlsson (Reference Neugart and Ohlsson2013), Tamm (Reference Tamm2013)]. While these previous studies show that there are cases in which parents respond to direct monetary incentives when they choose the timing of birth, I provide evidence that parents select a birth timing considering its potential benefits and costs that may be given to their children in the future.
There are a few studies that investigate whether birth selections exist around the school-entry cutoff as it can relate to their children's school performance and childcare costs in the future. A student who was born just before school-entry cutoff is expected to enter a school a year later than a student who was born just after the cutoff. Suppose that parents can choose their child's date of birth between them. There is a trade-off as a year later entry into school can improve educational achievement by accumulating human capital for a longer period of time before school entry while parents bear additional childcare costs for a year. The literature shows that how the school cutoff date affects the timing of births differs by country. Dickert-Conlin and Elder (Reference Dickert-Conlin and Elder2010) show that there is no significant difference in the number of births and the characteristics of mothers and babies before and after the cutoff in the U.S. Huang et al. (Reference Huang, Zhang and Zhao2020) show that a significant number of births are shifted from one week after the school cutoff date to one week before the cutoff date in Guangdong Province of China. They point out the educational benefits of early school entry, early labor market entry after finishing education, and lower childcare costs as the possible reasons. Shigeoka (Reference Shigeoka2015) finds that a lot of birth shifts arise from dates just before the school-entry cutoff to dates just after the cutoff in Japan. The school-entry rule is strict in Japan so that academic redshirting (the practice of delaying a child's school enrollment) is very rare in the country. Under the system, what Japanese parents can do to have the same outcome with academic redshirting is to shift the timing of birth to a date after the cutoff date. This research is closely related to these studies in the sense that birth selections around the school-entry cutoff are investigated, but I focus more on birth-month selections and school-entry timing decisions around the Korean age cutoff date, January 1, and behavioral motivations for them. I will explain that a large number of birth date selections arise in January in Korea and the main reason is that the Korean age culture works as a constraint that makes it difficult for students born in December to delay entrance to a school. The restrictive school-entry timing decision leads to the birth timing selections in Korea and Japan. However, the Korean case is different from the Japanese case because a lot of birth timing selections arise around the Korean age cutoff date, not the school-entry cutoff date. The reason for the birth selection is also different in the two countries. The main cause of the birth selections is the Confucian age culture in Korea, while it is the strong enforcement of the school-entry rule in Japan.
The key hypotheses to explain the phenomena on the birth-month selection and school-entry timing decision in South Korea are (1) a significant number of parents want their children to be relatively older in class to enable their children to have academic and non-academic advantages; and (2) parents do not want Korean age of their children to be different from that of classmates. There have been many studies that report being among the older students in class is positively associated with educational achievement [Bedard and Kelly (Reference Bedard and Dhuey2006), Datar (Reference Datar2006), Elder and Lubotsky (Reference Elder and Lubotsky2009), Fletcher and Kim (Reference Fletcher and Kim2016), Kim (Reference Kim2011), Lubotsky and Kaestner (Reference Lubotsky and Kaestner2016), McEwan and Shapiro (Reference McEwan and Shapiro2008), Nam (Reference Nam2014)].Footnote 1 Parents who perceive this relationship and want their children to perform well in school may strategically decide the school-entry timing of their children given a date of birth and school-entry cutoff.
The distinctive Korean age reckoning and Korean age culture should be considered to understand why parents do not want their child's age to be different from that of classmates. Koreans are considered to be a year old at birth, and all turn one year older on January 1 regardless of their date of birth. Thus, all Koreans with the same birth year are considered to be the same age and the age group in which one is included does not change over the year and in the lifetime. This convention informs much of daily life in Korea. Korean society has a hierarchical structure based on the Korean age influenced by Confucianism. Social relationships in Korea are largely determined by Korean age; people are expected to regard people in other age groups differently even if the difference in Korean age is just one year. I insist that this is the main reason why parents want their children to have the same Korean age as classmates. They do not want their children facing identity confusion and troubles in peer relationships that can happen when their Korean age is different from other classmates. Akerlof and Kranton (Reference Akerlof and Kranton2000) argue that identity plays an important role in shaping people's behaviors, and this can help explain many social and economic outcomes that cannot be understood without it. In the context of this study, consideration of parents on their children's age group identity strongly affects the decision on the school-entry timing of their children and the birth-month selection.
The school-entry cutoff in Korea changed in 2010 and the birth and school-entry timing choices under two different school-entry cutoffs provide an opportunity to test the hypotheses in various aspects. I first empirically investigate the differential school-entry timing decision by birth month using 8 data sets. The proportion of children who delay a school entry is much higher for January births than December births during the years 1962–2008 when March 1 was the school-entry cutoff. Students born in January are just one month younger in monthly age and a year younger in Korean age at any given point of time than those born in December in class under the March 1 cutoff. Even though parents whose child's birth month is January possibly worry about disadvantages from being younger in school more and thereby delay a school enrollment more, consideration on relative monthly age cannot solely explain the phenomenon because the ratio of students who delay a school entry suddenly and substantially increases as the date of birth changes from December 31 to January 1. The estimation results show that the ratio of delayed school entry increases by 18.2–21.2 percentage points on January 1. I argue that parents whose children's birth month is December are reluctant to delay a school entrance because it makes their children's Korean age differ from others. On the other hand, a lot of students born in January delay a school entrance because they have the same Korean age as other students and become relatively older in class if they delay entrance to a school.
Substantial changes in the school-entry timing decision after the change in school-entry cutoff from March 1 to January 1 in 2010 provide additional evidence that validates the two hypotheses. Under the new January 1 cutoff, all students have the same Korean age if they enter a school when they are supposed to enter by school-entry rule. After the cutoff change, the proportion of delayed enrollees decreased from 9.4% in 2008, most of which was January and February births, to 1.6% in 2010.Footnote 2 If relative monthly age only matters, we would see the similarly large proportion of delayed school enrollment for students who were born in November and December who are the youngest under the new cutoff. The ratio of delayed school entry among those youngest, however, becomes very small under the January 1 cutoff. This confirms again that parents' willingness to have their children's Korean age be the same as classmates is very strong in Korea. It is stronger than the willingness to have their children be relatively older in class.
If parents are forward-looking, they would have this scenario in their mind and this would affect their decision on birth timing. I examine the hypothesis using confidential data of the Vital Statistics for Birth. The empirical evidence is consistent with deliberate forward-looking behavior. The number of births increases significantly as the date of birth changes from December 31 to January 1 in Korea. The regression result shows that 24% of births moved from December to January within a 7-day window around January 1 for births before the announcement of the cutoff change in 2007. Compared to births in December, January births have the advantage to delay school enrollment without having a different Korean age. Parents who seriously think of relative age effect on educational achievement and age identity in peer groups can prefer to have a January birth and the empirical evidence shows that there are a significant number of parents who consider them in determining the birth month of their children. The January birth selection keeps occurring after the change in school-entry cutoff in 2010. The regression result for births after the announcement of the cutoff change to January 1 shows that 41% of births moved from December to January within a 7-day window around January 1. Under the January 1 cutoff, a student born in January is the oldest in class while a student born in December is among the youngest, but they would have the same Korean age if they enter a school on time. A student born in December can delay school entry to be relatively older in class, however, he or she becomes one year older in Korean age at school entry thanks to the delay. Parents who want to avoid this situation still have an incentive to give birth in January rather than December.
This study also compares the number of births in December and January by place of birth to examine the method that parents have used to ensure January births. I find that birth record manipulation is one of the methods that parents have used to report a January birthday for their child. The number of home births increases disproportionately on January 1. For a home birth, parents fill out the birth certificate for themselves with signatures from two witnesses, rather than having medical staffs do it, and this provides a loophole through which parents can manipulate the birth record. The preference for January birthdays is also observed in hospital births. It is difficult to exactly reveal what methods have been used in hospitals to have January births since the Vital Statistics for Birth in Korea does not provide information on medical procedures that mothers use; however, the rapidly decreasing number of daily births at the end of December implies that not all the birth selections are from birth record manipulation.
The characteristics of parents and birth outcomes are significantly different between December and January births. Children born in January have older parents who have more education than those born in December. Parents whose child's birth month is January are more likely to work in professional or managerial fields. Gestation is longer and birth weight is heavier for January births. They are less likely to be their first child. This could be evidence that parents learn the benefits of having a January birth from their first child and choose a birth timing more selectively. The evidence suggests that birth-month selection in Korea is a deliberate choice by parents and the selection is positively correlated with the higher socioeconomic status of parents. These results imply that the standard IV estimation method that estimates the effect of school-entry age on educational achievement using assigned school-entry age, which is determined by school-entry cutoff and date of birth, as an instrument is not valid in the Korea case because the date of birth is not perfectly exogenous. This study more clearly shows that the instrument of assigned school-entry age can violate the monotonicity condition as Barua and Lang (Reference Barua and Lang2016) point out.
This paper is structured as follows. Section 2 explains the Korean age reckoning, age culture, and school system focusing on school-entry cutoff in Korea. In addition, the choice problems that parents face at birth and their child's school entry are discussed in section 2. Section 3 introduces the data sets used in this study. Section 4 shows different patterns of school-entry timing by birth month. Section 5 provides evidence on January birth selections in Korea. Section 6 deals with birth and school-entry timing choices around March 1. Section 7 concludes.
2 Background
2.1 Korean age, age culture, and age group identity
The method of age calculation in South Korea is different from the one used in most other countries. For convenience, I denote the distinctive age used in Korea as “Korean age” and the age used in most other countries as “international age” from now on. The Korean age is calculated by the following rule: (1) people are one year old at birth and (2) turn one year older on January 1.Footnote 3
For example, the international age of a person whose birthdate is September 1, 1991, is one on June 1, 1993, and two on October 1, 1993, while his Korean age is three in 1993 regardless of the date. People in the same birth year cohort form the same age group and this does not change forever. The permanence of people in the same age group may be an important factor that makes a strong age group identity in Korea. Koreans think of their age as the Korean age and use it in their daily lives. For government documents, however, the international age is generally recorded instead of the Korean age.
Korea also has a distinctive age culture and age is one of the most important determining factors of social relationships in Korea. Korean society has a hierarchical structure based on age, and there are rules that people are expected to follow when they treat people in other age groups. This is originated from traditional Confucianism, which is still strongly embedded in Korean society despite the recent influence of Western culture and industrialization.Footnote 4 In Confucianism, it is a virtue for younger people to respect older people, and age is an indication of social status, not just a biological age. When Koreans forge social relationships, people generally ask about age early on to determine their relationship in the way that Confucianism prescribes. For example, Korean consists of two language systems, honorific and common language, and younger people are required to use the honorific register to older people. This is expected even if the age gap between the older and younger people is small—even a one-year difference in Korean age demands deference from the younger party.Footnote 5
Parents may not want their children to have different Korean age from their peers because of the age culture. Suppose that there is a child who is a year older in Korean age than classmates. As the child experiences and understands the age culture, he or she may realize that there is a discrepancy between the identity from the Confucian age culture and the identity as a classmate. With regard to the Korean age culture, it is expected that younger classmates should treat him or her as an older person or senior such as using honorifics. Because they are also classmates, however, they regard the student as a person of the same age, especially when the classmates do not know the actual age. Even worse, some classmates can bully the student if they are aware that he or she is older than them. For relationships with seniors whose age is the same, the child should respect them as seniors. In terms of age, however, they should be friends under the Korean age culture and customs. This imaginary student can experience identity confusion or difficulty in peer relationships because he or she is older in Korean age than classmates. This can be a serious problem for young children and parents can worry about it.Footnote 6
Parents with younger children than other classmates could worry that some classmates require their children to be treated as an older brother in the Confucian sense. A worse scenario is that the student is bullied by classmates because of the younger Korean age.Footnote 7 The student also can experience the identity confusion if friends refuse to include him or her in the same identity group. Parents can recognize that this can be detrimental to their child if it occurs and would want to avoid it.
2.2 School-entry rule in Korea
Compulsory education in South Korea begins with elementary school. March 1 was the school-entry cutoff from 1962 to 2008 but since 2010 it has been January 1. In 2008, there was an amendment of the Elementary and Secondary Education Act (ESEA), which prescribes the school-entry cutoff in Korea, and the date changed from March 1 to January 1. The amendment of the ESEA was first applied in 2009 (transition year), and it was universally adopted in 2010. In 2008, students born on March 1, 2001, through February 28, 2002, consisted of the same school-entry cohort. This was changed in 2009, wherein students born on March 1, 2002, through December 31, 2002, entered elementary school in 2009 and students born on January 1, 2003, through December 31, 2003, entered school in 2010.Footnote 8 The two main contents of the amendment are (1) the change in school-entry cutoff date from March 1 to January 1 and (2) a simpler process to obtain permission for early and delayed school enrollment.
The process allowing parents to change the school-entry year of their child became easier after the amendment of the ESEA. Before the amendment of the ESEA, parents had to obtain permission from the principal of the school that their child was supposed to enter if they wanted their child to enter a school earlier or later than the mandated year. For the principal's permission, parents should provide several documents that explain the reasons for delaying school enrollment and prove them. Therefore, there is a possibility that the application is rejected. After the change, a child can enter a school earlier or later than the expected entry year if parents submit an application document to the regional office without a chance to be rejected. After the amendment, parents do not need to submit the documents that prove the reasons for delaying entrance to a school.
The one notable characteristic of the previous March 1 cutoff is that it made a discrepancy in Korean age among students in the same school cohort. Students whose birth months are January and February are 7 years old in Korean age, while others are 8 years old, assuming they enroll in school on time. One of the main reasons for the cutoff change was that parents whose children's birth months are January and February worry about the Korean age difference. The Ministry of Education explained that the policy change reflects civil complaints that children whose birth months are January and February have difficulties in school because of a year younger Korean age.Footnote 9 This is another example that Korean age affects social relationships, the way of thinking, and thereby even government policy.Footnote 10
2.3 The parental decision problem
This section discusses parents' decisions on birth and school-entry timings for their children. Consider a scenario of parents who face a decision at midnight on December 31 of having a baby with a December 31 birthday or a January 1 birthday. They decide their child's date of birth considering its relation to the school-entry age of the child. They also determine the school-entry timing of their child given the date of birth.
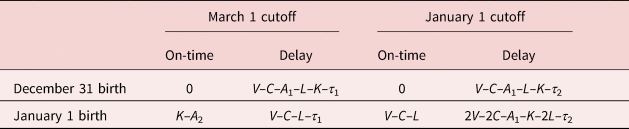
I summarize the expected benefits and costs of having a December 31 birthday vs. a January 1 birthday according to school-entry timing and school-entry cutoff in Table 1. All the expected benefits and costs are discounted present values at the time of decision for school-entry timing. I normalize the benefits and costs by setting each of benefit and cost of having a December 31 birthday and entering a school on time as zero. V represents the benefits of being one year older in class. Previous studies report that being older in class is related to better educational achievement in school. C presents additional child-care expenses from keeping a child out of school for an extra year. A 1 is an expected cost of being a year older in the Korean age. Having an older Korean age in class, such as 9, may have a negative effect since the student may struggle to get along with classmates who are younger in the Korean age, and their older age may generate a stigma effect. A 2 is an expected cost of being one year younger in class. Having a younger Korean age also may lead to negative peer effects if older classmates treat them differently according to the Korean age culture. K is the benefit of graduating from high school and entering the labor and marriage markets at a year younger Korean age. There could also be benefits of a January birth under the March 1 cutoff in education, work, and marriage when children born in January enter a school on time. They are a year younger, so they have another option to use that extra year in Korean society where age is recognized as Korean age. First, many students in Korea spend additional years to enter college. The demand for a college education has been greater than the supply of it, thus many high school students fail to enter college right after high school graduation and they spend an extra year to enter college.Footnote 11 For students born in January and February and entered a school on time, their Korean age is the same as others even if they spend an extra year to enter college. Second, they can spend extra time on job search before the labor market entry. It is widely considered that there is discrimination based on age in the Korean labor market.Footnote 12 If children who were born in January and February and entered a school on time do not face the identity confusion, their younger Korean age could be beneficial for them after school graduation. L is a lost income from entering the labor market a year later and lower earnings over the entire working life because of lower work experience given the same age. There is also an administrative cost to obtain permission for delayed school enrollment. It is τ 1 before the amendment of the ESEA and τ 2 after the amendment. As it is expected that the administrative cost is lower after the amendment of the ESEA, it is assumed that τ 1 > τ 2. For instance, delaying school enrollment of a child born on December 31 may improve educational achievement due to being older in class (V) while it generates an additional childcare cost (C), an administrative cost for delayed enrollment (τ 1 or τ 2), a possible cost of entering the labor market at one year older by Korean age (K), a lost income from entry into labor market one year later (L), and it loses a benefit from belonging into the majority age group in school since they become one year older in Korean age (A 1).
The net benefits of school-entry timing by birthdate and school-entry cutoff

Notes: V: an expected benefit from improvement in educational achievement from being one year older in class, C: a childcare cost for one year (absolute value), A 1: an expected cost of being one year older in class given the Korean age culture, A 2: an expected cost of being one year younger in class, L: an expected lost income in the labor market from entering a school one year later (absolute value), K: an expected loss from age discrimination in the labor and marriage markets (absolute value), τ 1: an administrative cost to get a permission for delayed school enrollment before the amendment of the ESEA (absolute value), τ 2: an administrative cost to get a permission for delayed school enrollment after the amendment of the ESEA (absolute value). These values are discounted values at school-entry timing and these are normalized by setting the value for parents whose child has December 31 birthday and enter a school on time as zero.
This table can make several predictions. First, people whose birthday is January 1 are expected to delay school enrollment more under the March 1 cutoff. For students born on December 31, the relative value of delaying school enrollment compared to on-time enrollment is V–C–A 1–L–K–τ 1 while it is V–C–L–K + A 2–τ 1 for those born on January 1. Given the same characteristics of students and parents, students born on January 1 have a higher benefit of delaying school enrollment by A 1 + A 2. If parents think the costs of being affiliated to the minority age group in class is large, parents with a child whose birthday is January 1 are more likely to delay school enrollment of their child compared to those with a child whose birthday is December 31. Second, students born on January 1 delay school enrollment less after the cutoff change to January 1 if the cost of having a different Korean age is greater than the reduction in the administrative cost for academic redshirting after the amendment of the ESEA. Under the January 1 cutoff, the relative benefit of delaying school enrollment to on-time enrollment is V–C–L–K–A 1–τ 2, which is smaller than the value under the March 1 cutoff by A 1 + A 2–(τ 1–τ 2). In sum, if parents think that the Korean age culture affects peer relationships in class so that there is a substantial cost from belonging to a minority age group in class, then students born on January 1 would delay school enrollment more than those born on December 1, and there would be a significant reduction in the proportion of delayed enrollment for students born on January 1 after the cutoff change to January 1.
It is also expected that forward-looking parents would consider these benefits and costs when they determine a date of birth for their child. Once they decide to delay school entrance, the value of having a January 1 birth is greater than that of having a December 31 birth under the March 1 cutoff. Parents who think that the benefit of being older in school and the cost of having a different Korea age are large (V–C–L–τ 1 > 0) prefer a January birth to a December birth regardless of the timing of school-entry. After the cutoff change to January 1, the payoff structure for January 1 births changes, and the magnitudes of these values are still important for birth-month preference. For example, if some parents think that the benefit of being older in school is large enough (V–C–L>0) and the age group identity is important (V–C–A 1–L–K–τ 2 < 0), then they still prefer to have a child in January rather than in December and send their child to school on time.
Finally, the choice depends on the preferences and other characteristics of parents. It is likely that affluent parents value the academic and non-academic benefits more if the quality of a child is a normal good. They would also value less the additional childcare cost and the reduced income by later entry into the labor market due to the diminishing marginal utility of money. If these are the case, the choice of delaying entrance to a school and the January birth selection would occur more among high-income parents.Footnote 13 I empirically examine the birth and school-entry timing choices around January 1 and infer how parents evaluate the benefits and costs for each alternative.
3 Data
3.1 Birth-month selection: the vital statistics
The Vital Statistics for Birth in Korea includes information on birth outcomes and characteristics of parents from birth certificates for all live births in South Korea. The data is compiled by Statistics Korea, which is a central administrative agency that takes charge of various national data sets. The Vital Statistics for Birth contains information on birthdate, birthplace, birth outcomes, and characteristics of parents. It, however, does not have information on medical procedures that mothers used and their health behaviors during pregnancy. Since the exact date of birth is not available information in the public version of the Vital Statistics for Birth, I use confidential data of the Vital Statistics for Birth for the years 1997–2016 to use the information.
3.2 School-entry timing: YP2001, KLIPS, KYPS, and KELS
This study uses 8 data sets to check differential school-entry timing choice by birth month for as many cohorts as possible because each data surveyed different birth cohorts. The Youth Panel 2001 (YP2001) started in 2001 and ended in 2006. It surveyed youths aged 15–29 in about 10,000 sampled households in the initial year. The Korean Labor and Income Panel Study (KLIPS) surveys approximately 5,000 households in non-rural areas in Korea and it is comparable to the PSID in the U.S. It started in 1998 and has focused on surveying labor market outcomes of individuals.
The Korean Youth Panel Survey (KYPS) first started in 2003 and ended in 2008. The KYPS consists of two independent surveys, 4th Grade Panel (I) and 8th Grade Panel that include representative 4th graders and 8th graders in 2003, respectively. The KYPS began the new surveys in 2010, which consists of three separate surveys: 1st Grade Panel, 4th Grade Panel (II), 7th Grade Panel. The 1st Grade Panel is the only data that surveys students who entered elementary school after the cutoff change in 2008.
The Korean Education Longitudinal Survey (KELS) is a national longitudinal survey that started in 2005 with a survey of 6,908 7th grade students in 150 middle schools. The KELS surveys characteristics of students, school, and family and gathers information on various educational outcomes of students in school.
Using the information in these data sets on date of birth and their grade in the survey year, it can be inferred when they entered school and whether they entered a school later than when they were supposed to enter.Footnote 14 I investigate whether there are significant differences in school-entry timing by birth month.
4 Choice of school-entry timing
This section investigates the choice of school-entry timing by birth month and the school-entry cutoff. Figure 1 shows the proportions of the number of delayed school enrollees to the total number of school enrollees in Seoul between 1999 and 2014 and in the entire nation between 2005 and 2014. Seoul is the largest city in South Korea. Its population is approximately 10 million, about 20% of the nation. Since the administrative data for the number of enrollees by school-entry timing for the entire nation has been available since 2005, I also present the ratio of delayed entrants in Seoul to show the changing patterns of the ratios for longer time periods. The changing patterns of the ratios of delayed enrollees in Seoul and the entire nation are very similar, and I discuss the features in Figure 1, focusing on the ratios in Seoul. Figure 1 shows that the proportion of delayed entrants increased from 1999 to 2008. It was 3.9% in 1999 and 9.7% in 2008.Footnote 15 A more notable feature in Figure 1 is the sharp reduction in the ratio of delayed entrants after the change in the school-entry cutoff. Although the ratio was 9.7% in 2008 and 7.9% in 2009 (transition year), it became 1.7% in 2010 and 0.7% in 2014. Considering the fact that the process to obtain permission for delayed school entry becomes much easier after the cutoff change, the reduction in the ratio of delayed entrants is remarkable.
The trend in the proportion of delayed school entrants in Seoul and the entire nation.
Notes: (1) Data source: Statistical Yearbook of Education and Seoul Education Statistics. (2) The dashed line shows the year when the new January 1 cutoff started to be implemented.

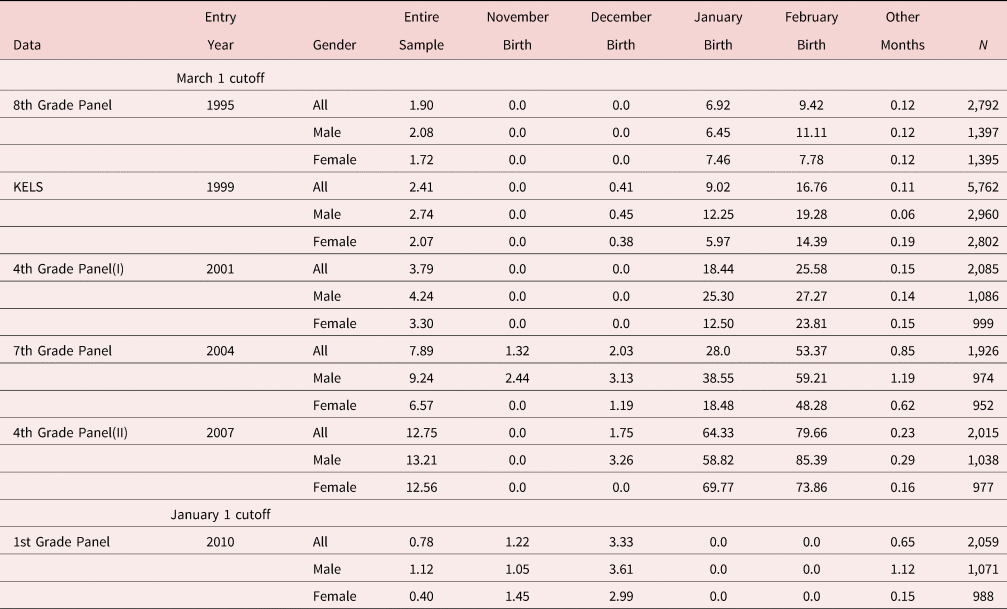
I use microdata to analyze in more detail how the ratio of deferred attendance differs by birth month and gender. Table 2 presents the proportion of the delayed entrants by birth month and gender from various data sets.Footnote 16 It replicates the statistics from the administrative data used in Figure 1 quite well by showing an increasing trend of the proportion of delayed entrants during the sample periods. Even though students born in November, December, January, and February are expected to be the youngest in the same school cohort under the March 1 cutoff, students born in January and February show a very different proportion of delayed school entrants from those born in November and December. In the school entry for 1995, the ratio of delayed entrants for students born in November and December is less than 0.2%, while it is 6.92% and 9.42% for those born in January and February, respectively. The gap is even more remarkable for the 2007 school-entry cohort, the ratio is less than 2% for students born in November and December, while it is 64.33% and 79.66% for students born in January and February, respectively. The ratio of delayed entrants for students born in other months is less than 1% under the March 1 cutoff during the sample periods.
The proportion of the number of delayed entrants to the number of the total entrants by school-entry year, gender, and birth month (%)

The pattern of a very high ratio of delayed entrants for students born in January and February changed dramatically in 2010, which is the first year when the January 1 cutoff was universally applied. Under the January 1 cutoff, students born in January and February are the oldest, and students born in November and December are the youngest in class. The ratio of delayed entrants for students born in January and February is 0%, and it is 1.22% and 3.33% for students born in November and December in the data, respectively. Table 2 shows that the parents of students born in January and February chose academic redshirting much more than others under the March 1 cutoff, and this pattern disappears after the cutoff change to January 1. Much of the changing patterns in the ratio of delayed entrants in Figure 1 can be explained by the changing behaviors of students born in January and February.
In terms of gender, male students delay school entry more than female students for all cohorts in the data sets. The higher proportion of delayed entrants for male students is consistent with the result in the U.S. Male students delay school enrollment more than female students by 2.7% point in the U.S. [Bassok and Reardon (Reference Bassok and Reardon2013)]. The overall difference in the ratio of academic redshirting between male and female students is smaller in Korea as it is less than 1% point in all data except 2.67% point gap in 7th Grade Panel. On the other hand, the gap is more apparent for students born in January and February.
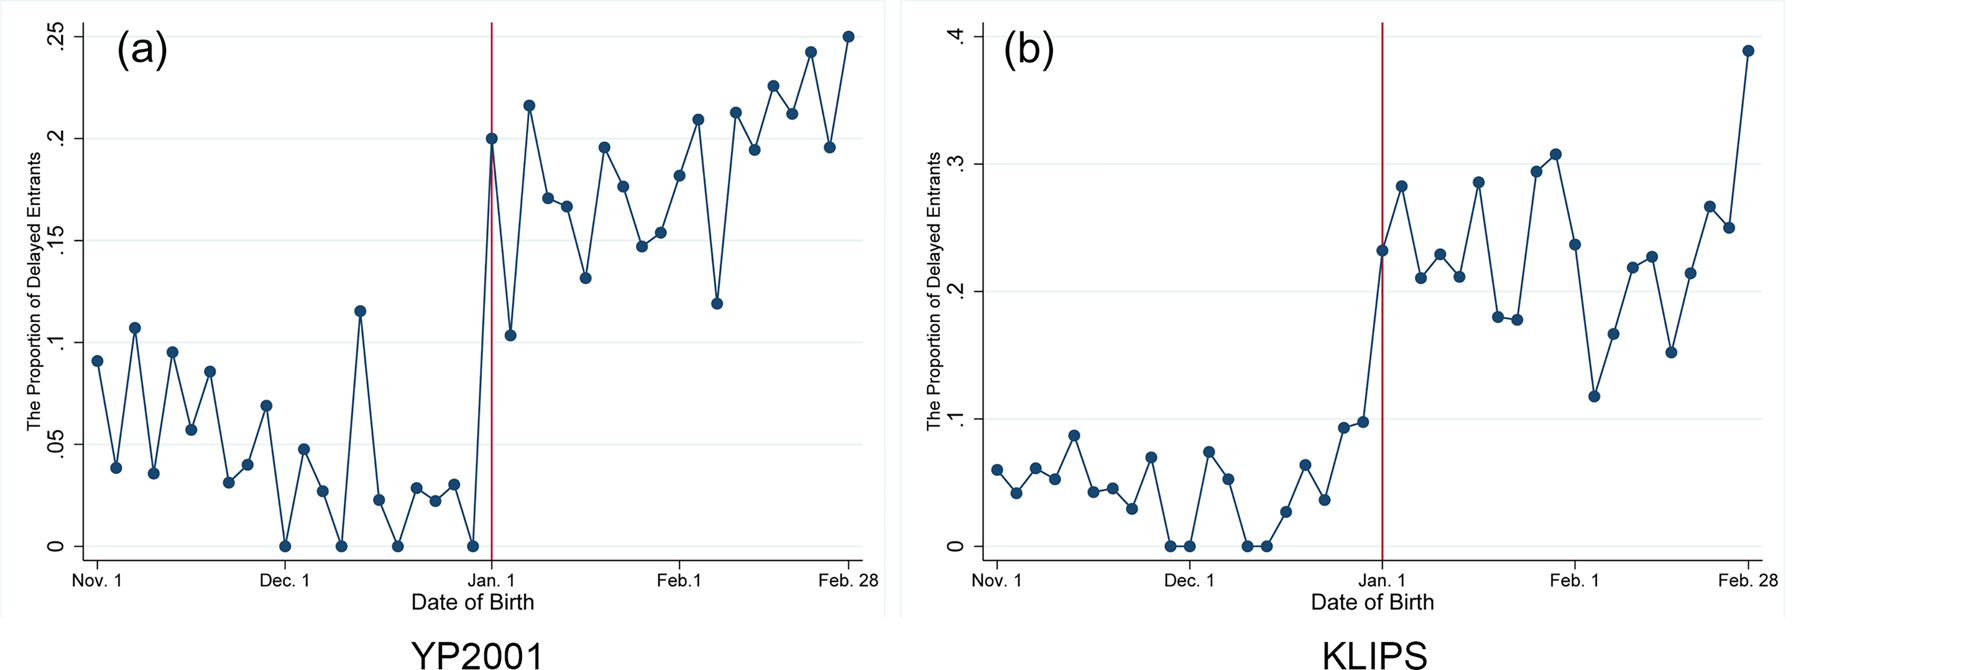
To examine more closely if January 1, which is the Korean age cutoff date, is really a breakpoint for parents to determine school-entry timing of their child differently under the March 1 cutoff, I check the ratio of delayed enrollment by date of birth using two data sets—YP2001 and KLIPS that include the exact date of birth information. The sample is restricted to children born in November, December, January, and February to include individuals whose age at school entry is similar. The sample is further limited to individuals who were born after 1974 and whose date of birth is recorded based on the solar calendar. All individuals in the sample entered an elementary school under the March 1 cutoff.
Figure 2 shows the proportion of delayed school enrollment by date of birth using KLIPS and YP2001 data. The proportion is averaged over 3 days on either side. The graphs from the two different data sets clearly show a similar pattern: a sharp increase in the ratio of delayed enrollment on January 1. The magnitude of the increase in the ratio of delayed enrollment is more than 10 percentage points just after January 1 compared to just before January 1 in both data sets.
The proportion of delayed school entrants by birthdate for November–February births (Bin: 3 days).
Note: The figures are drawn using YP2001 and KLIPS, respectively. Each dot presents the average proportion of delayed entrants for three adjacent days during the sample period.

The January or February birth effect on the choice of school enrollment timing controlling other characteristics of individuals is estimated using the following model.

where Y i is a dummy variable whether an individual i delayed elementary school entry, D i is a dummy variable which is 1 if an individual i was born in January or February, X i is a vector of characteristics of an individual i, b i is a variable of date of birth, f (b i) is a flexible function of b i, Yeari is a year fixed effect and η i is an error term.
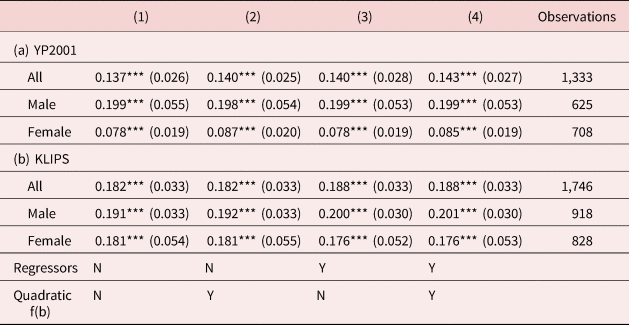
Table 3 reports the estimation results for various specifications of the model (2) using the two data sets. The estimates of the January or February birth effect on delayed school enrollment is robust to different specifications. The inclusion of parental characteristics barely changes the estimation result. Panel (a) of Table 3 shows the results for YP2001 and having a January or February birth month increases the probability of delaying school enrollment by 13.7–14.3 percentage points. I also estimate the January or February effect on delayed school enrollment by gender and the effect is greater for males. Panel (b) of Table 3 presents the estimation results for KLIPS and the estimated January or February birth effect on delayed enrollment is 18.2–18.8 percentage points. All estimates are statistically significant at a 1% level. The estimation results using the KLIPS also show that the January or February birth effect on academic redshirting is greater for males.
The effect of being born in January or February on delayed school enrollment compared to being born in November or December under the March 1 cutoff

Notes: (1) ***p < 0.01, **p < 0.05, *p < 0.10. (2) Standard errors are in parenthesis. Standard errors are clustered by expected school-entry year. (3) Birth year fixed effects and linear trend of b i are commonly controlled. Parents' education levels and the province of residence at age 14 are further controlled by specification.
Parents with children born in November through February may worry about academic disadvantages because of their children's relatively younger age in class. They can change the situation by holding their children out of school for one more year. Parents, however, also worry about identity confusion or bad peer relationships that their children can experience as their children's Korean age differs from others when they enter a school one year later. While parents of children born in November and December hesitate to change school-entry timing because of that, parents of children born in January and February are less concerned about it because their children's age is the same as most other classmates when they enter a school one year later. The results in Figure 2 and Tables 2–3 are consistent with this story. I think that only the Korean age difference can explain the sudden and sharp increase in the ratio of delayed entry on January 1. As relative age is almost the same between a December 31 birth and a January 1 birth, parents' consideration of relative age cannot explain the sudden increase in delayed enrollment on January 1. In addition, the proportion of delayed enrollment dropped to 1% or below after the cutoff change to January 1 that makes all classmates have the same expected Korean age at school entry. This is another strong evidence that parents want their children to have the same Korean age as their classmates.
5 Birth-month selection in South Korea
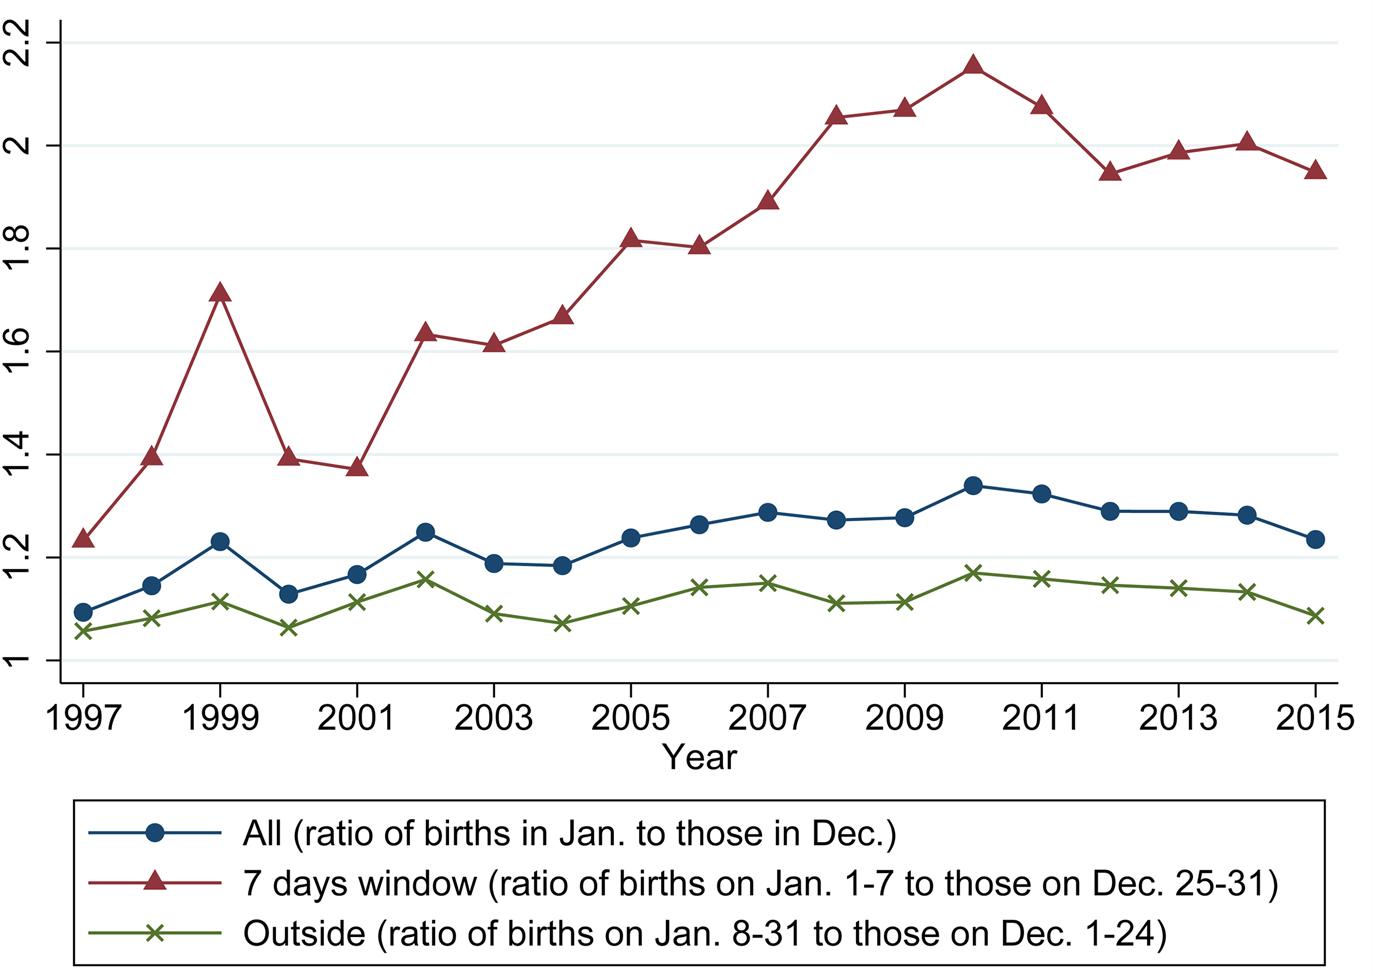
This section provides empirical evidence that birth-month selection exists in Korea. Figure 3 describes the trend in the ratio of the number of births in January to that in December for different windows during the period December 1997–January 2016.Footnote 17 The line with circle dots presents the ratio of the number of all births in January to that in December. It shows that the number of births in January is significantly greater than that in December (21.4% higher on average) and the ratio tends to increase over the sample period. The line with triangle dots shows the ratio of the number of births in January to that in December within a 7-day window around January 1. The ratio is substantially greater within the 7-day window and it rapidly increased from the early 2000s to 2011. After the late 2000s, the number of births in January is more than twice the number of births in December on average. The line with diamond dots presents the ratio outside the 7-day window. While the ratio outside the 7-day window is substantially lower than the ratio within the 7-day window; however, it is still significantly greater than 1 (1.15 on average).
The trend in the proportion of the number of births in January to the number of births in December.
Note: The ratio measures the proportion of the number of births in January to that in adjacent December for each window. For example, the ratio in 1998 is the proportion of the number of births in January 1998 to that in December 1997.

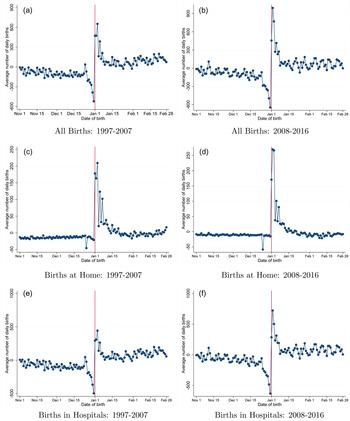
Figure 4 presents the number of daily births by birthdate and birthplace from November to February for the years 1997–2007 and 2008–2016, respectively. The amendment of the ESEA, which changed school-entry cutoff from March 1 to January 1, passed in the National Assembly in July 2007. To compare the January birth selections before-and-after the announcement of the cutoff change, I divide the entire sample periods into the two periods. Each dot in the figures shows the regression-adjusted number of daily births which eliminates the effects of year, public holidays, and each day of the week. The figures for the raw number of daily births are provided in the online Appendix. Panel (a) of Figure 4 shows the adjusted number of all daily births for the years 1997–2007. It shows that there is a large increase in the number of births on January 1. Panel (b) of Figure 4 presents the adjusted number of daily births for the years 2008–2016. The increase in the number of daily births on January 1 and after becomes greater after the cutoff change. Both figures clearly show the decreasing number of births in late December and the sudden increase in the number of births in early January. The magnitudes of the decrease in late December and the increase in early January are greater after the cutoff change. Panels (c) and (d) of Figure 4 present the number of births at home for the years 1997–2007 and 2008–2016, respectively. They show a more dramatic increase in the number of births in January. The number of births at home is low and almost constant in December, but it suddenly increases on January 1. Although the number of births sharply drops after early January, the significantly higher number of daily births keeps both in January and February. The magnitude of the increase in the number of home births in January is also greater after the cutoff change. Panels (e) and (f) of Figure 4 depicts the number of births in hospitals, and they show the higher number of births in January than that in December. The drastic jump in the number of births on January 1 is observed both before-and-after the cutoff change, and the magnitude of the jump is greater after the announcement of the cutoff change.
The average number of daily births by birthdate and birthplace.
Note: The figures are drawn using the Vital Statistics. Each dot presents the regression-adjusted average number of daily births that excludes the effects of year, public holidays, and the day of the week.

Figure 4 suggests clear evidence that there have been birth-month selections around January 1. I estimate the following regression model, which is similar to Gans and Leigh (Reference Gans and Leigh2009) and Shigeoka (Reference Shigeoka2015), to closely explore the magnitude of the birth-month selection controlling the effects of a day of the week, holiday, and year.

where Y t is the number of daily births in date t, D t is a dummy variable which is 1 if the month of date t is January and 0 for December, Dayjt is a dummy variable indicating a day of the week, which is a variable to control the effect of each day of the week, H t is a national holiday indicator, Yeart is a year fixed effect, ɛ t is an error term. The main parameter of interest is α 1, which measures the magnitude of January birth selection.
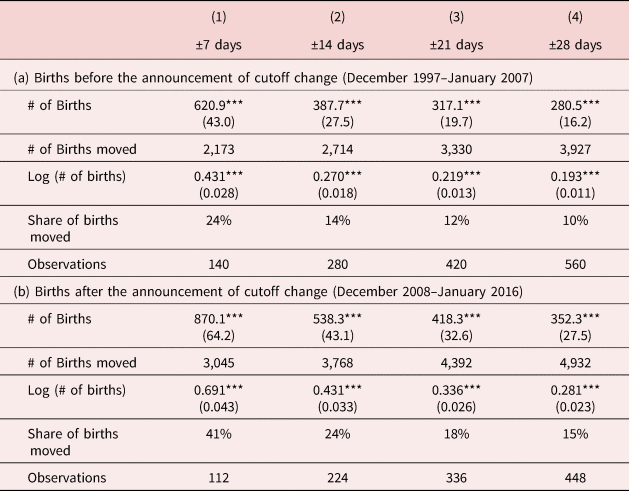
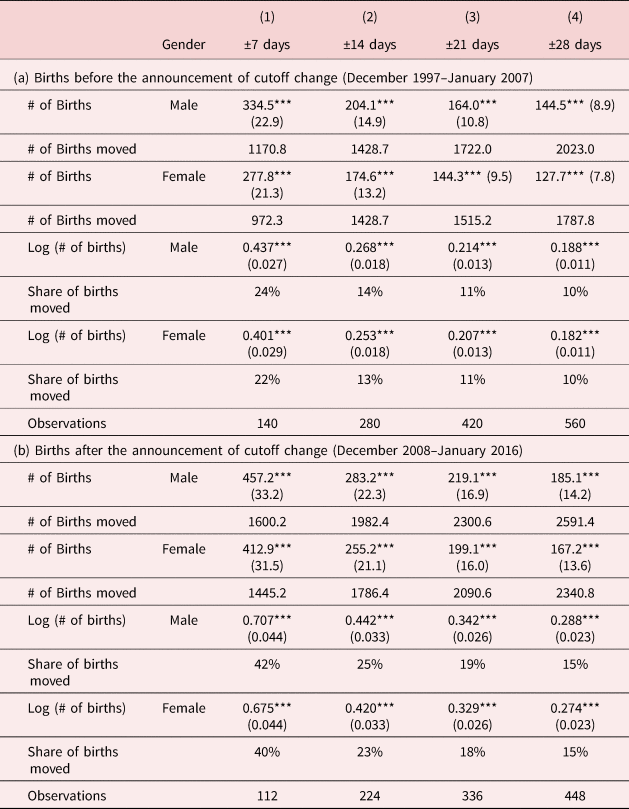
Table 4 reports the estimates of the January effect on the number of births (α 1) from the model (1) for different periods and windows. I divide the sample by the announcement of the school-entry cutoff change to check whether the magnitude of the January birth selections changes after the announcement.Footnote 18 Column (1) reports the results for the sample that includes 14 days around January 1 (the first 7 days of January and the last 7 days of December), the window increases by 7 days from column (1) to column (4). Panel (a) of Table 4 shows the estimation results for the periods 1997–2007. The estimated coefficient of January effect is 620.9 for 7 days window, 387.7 for 14 days window, and it decreases further as the window increases. This means that the number of daily births in January is greater than that in December by 620.9 for the 7-day window and by 387.7 for 14-day window. Following the method in Gans and Leigh (Reference Gans and Leigh2009), the number and the share of births moved from December to January are calculated. The number of births moved from December to January within the 7-day window is approximately 2,173. Within 28 days window, it is 3,927. The estimates of the January effect on the log of the number of births are also reported. Within the 7-day window, the estimation result shows that 24% of births moved from December to January. For 28 days window, the share of births moved from December to January is 10%.
Test of the January birth preference: comparison of the number of births in December and January

Notes: (1) ***p < 0.01, **p < 0.05, *p < 0.10. (2) Standard errors are in parenthesis. (3) Covariates are a January birth dummy, day of week dummies, a holiday dummy, and year dummies. (4) The number of births moved for a window is calculated as $n\widehat{{\alpha _1}}/2$ , where n is the number of days in the window and $\widehat{{\alpha _1}}$
 is the estimate for the January effect. The share of births moved is calculated as exp($\widehat{{\alpha _1}}/2$
 ).
Panel (b) presents the results for the years 2008–2016. The estimation results show that the January birth selection becomes greater for the years 2008–2016. Within the 7-day window, the number (share) of births moved from December to January is 2,173 (24%) for the years 1997–2007 and 3,045 (41%) for the years 2008–2016. It is 3,927(10%) before the announcement and 4,932(15%) after the announcement within the 28-day window. The fact that the shift of births is greater after the announcement of the cutoff change is consistent for different windows as well.
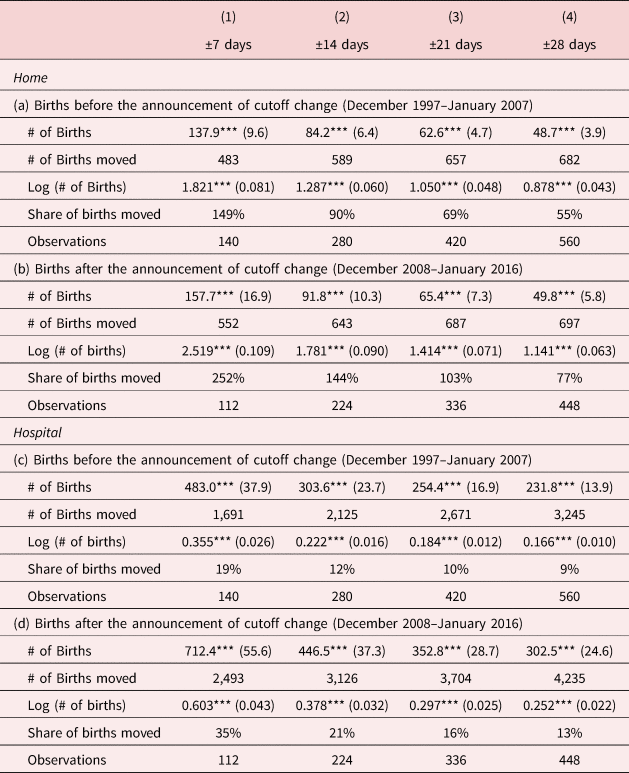
Table 5 reports the estimation results by birthplace.Footnote 19 Panel (a) reports the estimation results for home births during the years 1997–2007, and Panel (b) is for births during the years 2008–2016. Within the 7-day window, the number of home births in January is higher than that in December by 137.9 during the years 1997–2007. Considering the fact that the proportion of home births is very small (less than 2% of total births), the January effect on the number of home births is remarkable. The estimated coefficient can be interpreted as a 149% increase in the number of daily home births in January. As the size of the window increases, the January effect decreases but still shows a large effect. The results in Panel (b) show that the January effect on the number of home births is even greater after the announcement of the school cutoff change. Within the 7-day window, the estimated coefficient of January effect is 157.7 and this is a 252% increase. The share of home births moved from December to January is also greater for different windows after the announcement of the cutoff change.
Test of the January birth preference: comparison of the number of home births in December and January

Notes: (1) ***p < 0.01, **p < 0.05, *p < 0.10. (2) Standard errors are in parenthesis. (3) Covariates are a January birth dummy, day of week dummies, a holiday dummy, and year dummies. (4) The number of births moved for a window is calculated as $n\widehat{{\alpha _1}}/2$ , where n is the number of days in the window and $\widehat{{\alpha _1}}$
 is the estimate for the January effect. The share of births moved is calculated as exp($\widehat{{\alpha _1}}/2$
 ).
The estimation results for the January effect of the number of births in hospitals are reported in Panels (c) and (d) of Table 5. The estimation results show that the share of births moved from December to January for the 7-day window is 19% before the announcement of the cutoff change and 35% after the announcement. It is 9% before the announcement and 13% after the announcement for 28 days window. The results clearly show that the number and the ratio of births in hospitals moved from December to January are greater after the announcement of the school-entry cutoff change.
A large number of home births in early January shows that birth record manipulation is a popular method that parents have used to ensure a January birth, because advanced medical procedures are unlikely to be used for births at home. In Korea, there are two different types of birth certificates. One is for hospital births and the other is for births in places other than a hospital. If a baby is born in a hospital, the hospital issues a birth certificate, and parents generally submit it to a regional office. For an infant born in other places, such as at home, parents write a birth certificate with the agreements from two guarantors. This may provide a loophole in which parents can manipulate their child's birth record. Even if an infant was born in a hospital, parents do not submit a birth certificate issued by the hospital, and they can make a birth certificate for home births by hiring two guarantors, maybe relatives or friends.
Then, how many of the January birth selections were made by birth record manipulation? This is difficult to answer because the Vital Statistics for Birth in Korea does not provide information on any medical procedure that mothers might have used. I think, however, that not all birth selections are from birth record manipulation. First, as mentioned, hospitals manage birth records for births in hospitals. I cannot exclude the possibility that there are some doctors who manipulate records when parents ask, but it is difficult to believe that manipulations are widespread in recent years. Nowadays, hospitals are required to manage every record and document issued in them strictly. If it is not, there is no reason that we see many home births in January. Second, if we look at Figure 4 again, we find a further increase in the number of births after January 1. January 1 is a national holiday and the relatively small increase in the number of births on January 1 reflects the holiday effect. If the birth-month selection was done by birth record manipulation, there is no clear reason to observe the holiday effect. For home births, a significant holiday effect is not found. Another rapid increase in the number of births on January 2 may show that some mothers delayed delivery to give birth in January. Third, January births in hospitals have a heavier weight and longer gestation than December births in hospitals (Table A3 in the online Appendix). These results also hold after controlling parental characteristics (Table A4 in the online Appendix). Based on these facts, I argue that some of the birth selections occurred in hospitals are from actual birth shifts.Footnote 20
I also examine the January birth selections by gender. Panel (a) of Table 6 shows the estimation results by gender during the years 1997–2007. Regardless of the size of the window, the January effect is greater for males. For example, the number of births in January is higher than that in December by 334.5 for males and 277.8 for females within the 7-day window. It means that the share of births moved from December to January is 24% for males and 22% for females. Panel (b) reports the results for the years 2008–2016 and it also shows that boys were born in January more than girls during the period. As seen in Table 2, boys delay school entry more than girls. The results in Table 6 are consistent with the explanation that the January birth-month selection is related to the decision for school-entry timing.
Test of the January birth preference: comparison of the number of births in December and January by gender

Notes: (1) ***p < 0.01, **p < 0.05, *p < 0.10. (2) Standard errors are in parenthesis. (3) Covariates are a January birth dummy, day of week dummies, a holiday dummy, and year dummies. (4) The number of births moved for a window is calculated as $n\widehat{{\alpha _1}}/2$ , where n is the number of days in the window and $\widehat{{\alpha _1}}$
 is the estimate for the January effect. The share of births moved is calculated as exp($\widehat{{\alpha _1}}/2$
 ).
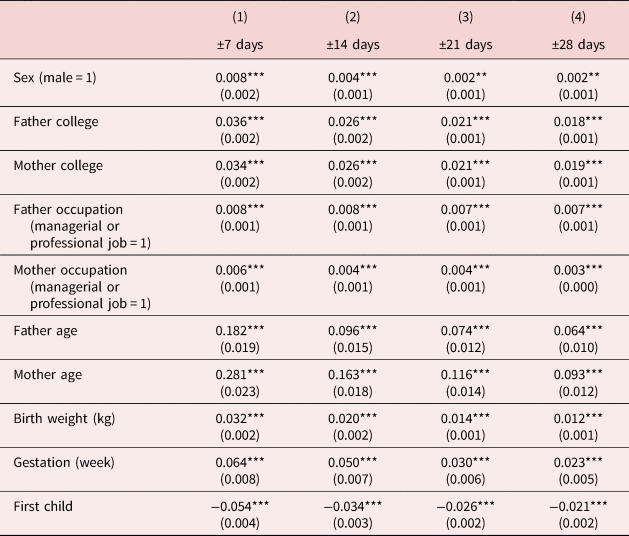
I explore whether parental characteristics and birth outcomes are different between December and January births. I estimate the model (1) using parental characteristics and birth outcomes as dependent variables. Table 7 reports the estimation results for all births born in December and January during the periods December 1997 to January 2016. The reported estimates are the estimated coefficients on the January birth dummy. Parents whose child was born in January are more likely to have a college education and work in managerial or professional occupations than parents who have a child born in December. For example, within a 7-day window, mothers whose children were born in January are more likely to have a college education than those whose child was born in December by 3.4 percentage points. Parents' ages are older for children born in January.
Differences in parental characteristics and birth outcomes between December and January births

Notes: (1) ***p < 0.01, **p < 0.05, *p < 0.10. (2) Standard errors are in parenthesis. Standard errors are clustered by date of birth. (3) Covariates are a January birth dummy, day of week dummies, a holiday dummy, and year dummies. Standard errors are clustered by date of birth.
Birth weight is heavier for children born in January and their gestation is longer. They are less likely to be the first child of their parents. This suggests evidence that some parents learn the benefit of their child having a January birthday after their first child and go on to ensure a January birth for the second. The differences in parental characteristics and birth outcomes between January and December births are greater as the birthday window is smaller, which may reflect the different intensity of birth selection by the window.Footnote 21
6 Birth and school-entry timings around March 1
This section investigates the birth and school-entry timing choices around March 1, which was the school-entry cutoff before 2009. Children born in February are expected to enter one year earlier than those born in March under the March 1 cutoff. Children born in February are among the youngest, while those born in March are among the oldest if they enroll in school on time. Similar to the analysis for children born in December and January, we can make several predictions given the hypotheses that parents want their children to have academic advantages from older school-entry age, and they want their children to have the same Korean age with classmates.
First, it is expected that children born in February are held out of school for one year more under the March 1 because their relative age is among the youngest, and their Korean age is also a year younger than other classmates. The difference in the ratio of delayed school enrollment between February and March births is expected to be greater than that between December and January births. This is because children born in February can have a greater incentive to delay school enrollment because their relative age is about 11 months younger than those born in March, while the difference is only one month between December and January births. Second, the difference in the ratio of delayed school enrollment between February and March births is expected to be much smaller under the January 1 cutoff. Under the new January 1 cutoff, the average relative age difference is one month between the two groups, and their Korean age is the same given they enter a school on time. Third, parents do not necessarily prefer a March birth to a February birth. Given children born in March barely delay school entrance, we can infer that the value of entering a school on time is greater than the value of entering a school one year later for most children born in March. Children born in February have an option to be similar to children born in March in terms of the Korean age and relative age. If children born in February delay school entrance, their Korean age is the same as that of children born in March and their relative age is slightly older. If parents can easily delay a school entrance of their children, there is no clear reason that parents prefer a March birth to a February birth. However, if the school-entry rule is strictly enforced so that it is difficult for parents to change school-entry timing, parents would like to change their child's date of birth in advance such as the case in Japan [Shigeoka (Reference Shigeoka2015)]. On the other hand, we can expect that the birth selections around the school-entry cutoff are weaker in Korea than in Japan because the school-entry rule is less strict in Korea.
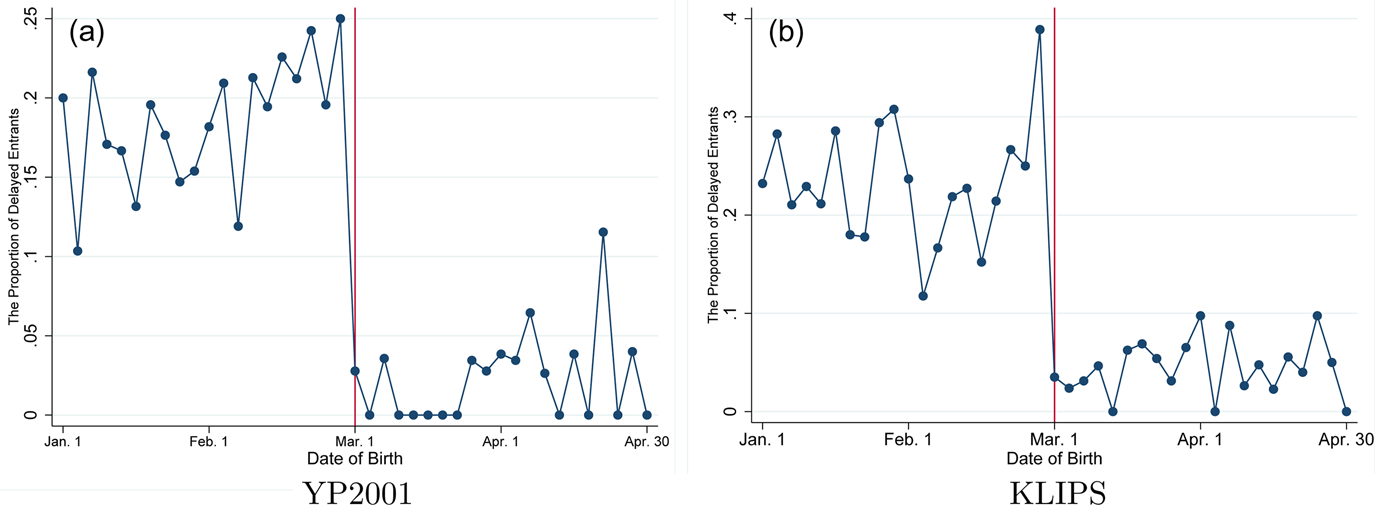
The first prediction made in this section based on school-entry rule and age culture in Korea was that people who were born in February are more likely to delay school enrollment than those born in March. Figure 5 and Table 8 test the prediction. Figure 5 shows that the ratio of students who delayed elementary school entry by date of birth for people who were born in January through April. It clearly shows that the ratio sharply decreases on March 1, the school-entry-cutoff date. The magnitude of reduction around March 1 is more than 25 percentage points for YP2001, and it is more than 30 percentage points for KLIPS.
The proportion of delayed school entrants by birthdate for January–April births (Bin: 3 days).
Note: The figures are drawn using YP2001 and KLIPS, respectively. Each dot presents the average proportion of delayed entrants for three adjacent days during the sample period.

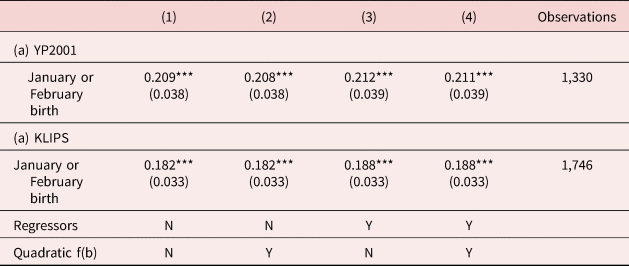
The effect of being born in January or February on delayed school enrollment compared to being born in March or April under the March 1 cutoff

Notes: (1) ***p < 0.01, **p < 0.05, *p < 0.10. (2) Standard errors are in parenthesis. Standard errors are clustered by expected school-entry year. (3) Birth year fixed effects and linear trend of b i are commonly controlled. Parents' education levels and the Province of residence at age 14 are further controlled by specification.
I estimate the equation (2) for the sample that includes people born in January through April to investigate the effect of January and February births compared to March and April births on the probability of delaying school enrollment controlling birth cohort effects and other variables. The estimation results are reported in Table 8, and it shows that having January or February birth month increases the probability of delaying school entry by 20.8–21.2 percentage points for YP 2001. For KLIPS, the estimate ranges from 18.2 to 18.8 percentage points. Compared to the results in Table 3, the magnitude of January and February birth effect is greater as people born in March and April delay school enrollment less than those born in November and December. This is because those born in March and April are older at school entry. The empirical evidence in this section and section 5 confirms that the prediction for the differential school-entry timing choice by birth month based on consideration on relative age effect and Korean age culture is consistent with data in all aspects.
The second prediction was that the ratio of delayed entrants is low for both February and March births under the January 1 cutoff. In the 1st Grade Panel reported in Table 2, the ratio of delayed entrants among children born in January is 0% under the January 1 cutoff in 2010. It is also 0% for children born in March in the same data. The second prediction is also consistent with the empirical facts. This verifies again that Korean age and relative age can explain much of the behaviors regarding birth and school-entry timing choices in Korea.
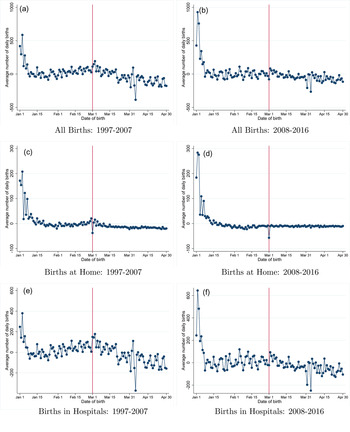
Panels (a) and (b) of Figure 6 show that the regression-adjusted number of daily births by date from January to April for the years 1997–2007 and 2008–2016, respectively. The reference lines are drawn on the March 1 birthday. It is difficult to figure out with the eyes whether birth selection exists around March 1. Panels (c) and (d) of Figure 6 show the adjusted number of daily births at home for the periods and there is no notable difference in the number of home births around March 1.Footnote 22 Panels (e) and (f) depict the number of births in hospitals, and it is also difficult to find a clear difference in the number of daily births around March 1.
The average number of daily births by birthdate and birthplace.
Note: The figures are drawn using the Vital Statistics. Each dot presents the regression-adjusted average number of daily births that excludes the effects of year, public holidays, and the day of the week.

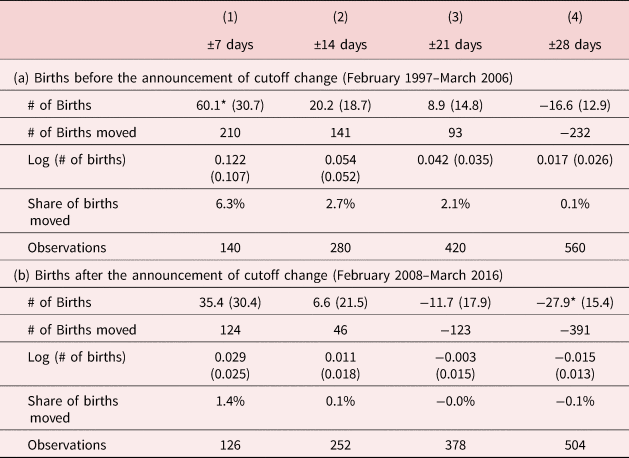
I estimate the regression equation (1) for people born in February and March. The only difference is that now D t is a dummy variable which is 1 if the month of date t is March and 0 for February. The estimation results in Table 9 show that the number of daily births in March is greater than that in February by 60.1 within 7 days window for the years 1997–2006. It is statistically significant at the 10% level. The number (share) of births moved from February to March is 210 (6.3%). However, the estimated effect is smaller and statistically insignificant for greater intervals such as 14 or more days windows. The estimates for periods 2008–2016 are smaller than those before the announcement of the cutoff change and statistically insignificant. The number (share) of births moved from February to March is 124 (1.4%). The smaller and insignificant gap after the announcement of the cutoff change is reasonable because the differences in the relative age and Korean age under the March 1 cutoff that may motivate birth selections to disappear under the new January 1 cutoff.Footnote 23
Test of the March birth preference: comparison of the number of births in February and March

Notes: (1) ***p < 0.01, **p < 0.05, *p < 0.10. (2) Standard errors are in parenthesis. (3) Covariates are a January birth dummy, day of week dummies, a holiday dummy, and year dummies. (4) The number of births moved for a window is calculated as $n\widehat{{\alpha _1}}/2$ , where n is the number of days in the window and $\widehat{{\alpha _1}}$
 is the estimate for the March effect. The share of births moved is calculated as exp($\widehat{{\alpha _1}}/2$
 ).
The expected benefits and costs are not much different between a February birth and a March birth because children born in February have an option to be similar to those born in March. If they delay school enrollment, their Korean age is the same as classmates and their relative age is one month older than those born in March. This may be the reason why we cannot observe substantial birth selections around March 1. Compared to Shigeoka (Reference Shigeoka2015) who shows a lot of birth shifts around school-entry cutoff to have academic advantages from being older in school in the situation that most students enroll in school on time because of strict enforcement of the school-entry rule in Japan, the necessity of changing the date of birth in advance is much less because parents can delay their child's school entry under the lenient school-entry rule in Korea.
7 Discussion and conclusion
This study suggests that distinctive birth and school-entry timing choices exist in Korea: (1) the number of births in January is substantially higher than that in December; (2) children born in January and February delayed school entrance much more than those born in other months under the March 1 cutoff; (3) children barely delay school entrance regardless of their birth month under the January 1 cutoff; (4) boys delay entrance to a school more than girls and they are also born in January more; (5) the January birth selection is positively correlated with the higher socioeconomic status of parents. The evidence reveals that the birth and school-entry timing choices are interrelated and they are largely affected by Korean age reckoning and age culture. The distinctive parental behaviors in Korea are explained well by two motives. Many parents want their children to be relatively older in class to enable them to have academic and non-academic advantages. More importantly, parents strongly want their children to have the same Korean age with the majority of their classmates to avoid identity confusion and problems in peer relationships that can arise when their Korean age is different from their classmates.
The contributions of this paper can be summarized as follows. First, this paper provides evidence that parents are forward-looking and make deliberate decisions for their children considering benefits and costs that may be given to them in the future. Even though there have been studies that show parents choose a birth timing responding to monetary incentives, this study suggests a novel case that parents choose the birth and school-entry timings considering non-monetary benefits and costs that children may have in the future and shows how the two choices are related. Second, this study shows the importance of culture and identity that affect the behaviors of people. The sudden and sharp increases in the number of births and the ratio of delayed entrants on January 1 cannot be understood without considering the Korean age reckoning and age culture. The Korean age reckoning and culture affect people to form strong age group identity, and parents' consideration of the group identity has a strong influence on birth and school-entry timing choices. Third, this study shows that the conventional IV estimation that estimates the effect of school-entry age on educational achievement using school-entry age predicted by the date of birth and school-entry cutoff as an instrument is not valid in Korea. The validity of the instrument is based on the exogeneity of the date of birth. This study reveals that the date of birth is strategically determined in Korea around the Korean age cutoff date, January 1, it is also related to various characteristics of parents. It is also likely that the instrument violates the monotonicity condition. When the treatment effect is heterogeneous, the IV estimate is interpreted as the local average treatment effect, which is the average treatment effect for individuals who receive the treatment when they are affected by the instrument and do not receive the treatment otherwise. Barua and Lang (Reference Barua and Lang2016) point out that the IV of expected entry age does not satisfy the monotonicity condition because the proportion of parents who do not conform to the school-entry rule differ by their child's date of birth. In the Korean case, the proportion of students who delay entrance to a school suddenly increases on January 1 under the March 1 cutoff so that the instrument is likely to violate the monotonicity condition. In sum, the conventional IV approach for estimating the effect of school-entry age using expected entry age as an instrument is problematic in the Korean case since the instrument is not likely to meet the exogeneity and the monotonicity conditions considering the widespread birth-month selections.
The results of this study imply that the age culture makes it difficult for the government to flexibly adjust policies according to social changes.Footnote 24 The new school-entry cutoff, January 1, is fit for the Korean age culture but it is questionable whether it is suited for achieving other social goals and efficient for children's skill accumulation. After the change of the school-entry cutoff to January 1, Korea becomes one of the countries that children start school at the latest. This may lead to greater childcare costs and later entry into labor and marriage markets on average, thereby possibly lower labor force, work experience, and fertility rate. The decreasing proportion of the working-age population because of population aging and the recent record-low fertility rate is considered one of the most serious social problems in Korea and the government has recently implemented many social policies to cope with the problem. Moving the cutoff to an earlier date is against the basis of the policies. The previous literature on the effect of school-entry age on educational achievement also reports that the positive school-entry age effect tends to decrease as students advance through school. There is evidence that schooling is more efficient in developing the cognitive skills of children than spending time at home at younger ages such as age 5–6 [Kim (Reference Kim2018)]. Black et al. (Reference Black, Devereux and Salvanes2011) show that the school-entry age effect net of age-at-test effect is rather negative. These imply that moving school-entry cutoff to an earlier date of the year may delay labor market entry of young people without sufficient improvement in human capital.Footnote 25
Supplementary material
The supplementary material for this article can be found at https://doi.org/10.1017/dem.2020.16