1. Introduction
In the last century, substantial improvements in longevity in the most developed countries lead to significant challenges in longevity risk management. Longevity risk occurs when retirees could live longer than their expected lifespans and exhaust their assets before death. Due to higher life expectancy, the average 401 (k) account balance is projected to increase tenfold between 2000 and 2030 in the USA [Poterba et al. (Reference Poterba, Venti and Wise2000)]. Biffis and Blake (Reference Biffis and Blake2009) also find that pension liabilities in the UK are expected to rise by at least 3% every additional year in life expectancy at the age of 65. The private purchase of the financial products and public provision of annuities mitigate the longevity risk. Most retirees finance their consumption until their death by spending the steady income stream. Risk management becomes a major issue for governments, insurers, and annuity providers.
Because there is uncertainty about when death will occur, the more accurate forecast of life expectancy or mortality rates is crucial in longevity risk management. To forecast the mortality rates and future transfers at each post-retirement age, we employ the parsimonious parameterized approach, the Lee–Carter model, in this study. The purpose of this article is to quantify the differences in expected public lifetime annuities between particular demographic groups in the USA, which results from systematic mortality rate differences. We find strong evidence of a positive relationship between life expectancy and government annuity provision, and female retirees are likely to receive more of the public lifetime annuity than males. Furthermore, we forecast the life expectancy and the discounted public annuity benefits with cross-country data for Canada, France, Italy, Japan, UK, Australia, Austria, Bulgaria, Hungary, Portugal, and Spain over 1950–2015. Then, the forecast estimates are compared for the differences or similarities. In particular, we employ two risk statistics, such as the standard deviation and the coefficient of variation. We find that the Japanese are exposed to higher risk and volatility in the public provision of annuities. We also change a set of parameters in the forecasting model, such as different deferring periods and different ages of the annuitant. Under the assumptions of our model, the empirical analysis provides evidence that as the annuitants are younger, the APV increases. In addition, the APV values are negatively associated with deferring periods across the countries studied over the sample period.
Our contribution to the literature is twofold. First, we provide an empirical examination of a retiree's longevity risk by estimating the lifetime annuity provided by governments. In particular, we measure the difference between the discounted public annuity amounts across gender and countries. Second, our empirical results potentially speak to the role of currently small markets for private annuities. In fact, our findings suggest that the private annuities should complement the government annuity provision to share longevity risk over the next few decades.
There are several studies that quantify longevity risk for pension amounts and portfolios of longevity-linked liabilities [see, e.g., Dowd et al. (Reference Dowd, Cairns and Blake2006), Cossette et al. (Reference Cossette, Delwarde, Denuit, Guillot and Marceau2007), Stevens et al. (Reference Stevens, De Waegenaere and Melenberg2010)]. Pestieau and Ponthiere (Reference Pestieau and Ponthiere2016) investigate some challenges caused by longevity variations for the equity and sustainability of the support system in a society at both normative and positive levels. A more extensive review is given in De Waegenaere et al. (Reference De Waegenaere, Melenberg and Stevens2010). The risk management approach is needed to diversify longevity risk through a mixture of various financial products. In particular, Hári et al. (Reference Hári, De Waegenaere, Melenberg and Nijman2008) examine the effect of micro- and macro-longevity risk on the expected present value by using a two-factor generalized Lee–Carter model with the Dutch dataset. They show that longevity risk could decrease if individuals increase stock investment in their asset portfolios.
Based on a mortality model, Olivieri and Pitacco (Reference Olivieri and Pitacco2003) analyze solvency conditions for immediate annuities and pension amounts. In particular, their numerical examples present the importance of the solvency conditions for life annuities. Wang et al. (Reference Wang, Koo and O'Hare2016) examine the relationship between demographic changes and the maintainability of the superannuation system in Australia. Their empirical findings suggest more government support for low-income individuals at retirement. By employing a life-cycle model, Koka and Kosempel (Reference Koka and Kosempel2014) present that removing mandatory retirement results in a reduction in an individual's welfare. Boldrin et al. (Reference Boldrin, De Nardi and Jones2015) find a negative impact of increases in old age pension provided by the government on fertility rates in the USA and Europe.
Cocco and Gomes (Reference Cocco and Gomes2012) consider longevity risk in agents' decisions on consumption and savings in the life-cycle model. They show that an increase in individual savings partially self-insures against the risk. Longevity risk could be a more complex risk than other risks, like insurance risks in particular, due to its potential correlates with other financial and non-financial sources of risks. Indeed, Barrieu et al. (Reference Barrieu, Bensusan, El Karoui, Hillairet, Loisel, Ravanelli and Salhi2012) argue that a more accurate risk assessment and more effective risk management regulations are needed in the life insurance market. In order to hedge the longevity risks, it is important to develop generally accepted models to quantify the risk and then, successfully implement financial markets for hedging. Mitchell et al. (Reference Mitchell, Piggott, Sherris and Yow2006) discuss different forms of retirement savings, such as private pension savings and government social security, and their impacts on financial markets. Bisetti et al. (Reference Bisetti, Favero, Nocera and Tebaldi2017) suggest integration between insurance and financial markets to share the longevity risk.
Koijen et al. (Reference Koijen, Nijman and Werker2010) study optimal annuity portfolio given annuity risk at retirement, which can cause investors' welfare loss. Sherris and Wills (Reference Sherris and Wills2008) show how financial markets could be utilized to hedge longevity risk. They focus on the insurance-linked securities as a means of transferring the risk in the markets. Friedberg and Webb (Reference Friedberg and Webb2007) also suggest the use of mortality-contingent bonds as an efficient way to mitigate substantial aggregate mortality risk for annuity providers. Fong et al. (Reference Fong, Mitchell and Koh2011) evaluate the benefits for annuitants when a national annuitization scheme is administered between private insurers and government with the Singaporean case.
The remainder of this paper is structured as follows. The next section introduces the Lee–Carter method for forecasting mortality rates. In Section 3, we discuss our empirical results regarding life expectancy and projection of the public annuity across countries. Concluding remarks are presented in Section 4.
2. Mortality model
It is critical to forecast more accurate mortality rates in order to improve our estimation of an expected annuity payout. There are several forecasting approaches discussed in mortality modeling literature, such as Lee and Carter (Reference Lee and Carter1992), Renshaw and Haberman (Reference Renshaw and Haberman2003, Reference Renshaw and Haberman2006), Cairns et al. (Reference Cairns, Blake and Dowd2006), Hyndman and Ullah (Reference Hyndman and Ullah2007), Plat (Reference Plat2009), Cairns et al. (Reference Cairns, Blake, Dowd, Coughlan, Epstein, Ong and Balevich2009), and O'Hare and Li (Reference O'Hare and Li2012). In this study, we use the Lee–Carter model extensively with Hyndman and Ullah's (Reference Hyndman and Ullah2007) approach to forecast mortality rates by sex across countries. The method is still popular and often considered as a benchmark method for both the academic researchers and workers in life insurance companies. The model is also often employed in the literature to forecast mortality rates of several countries, including Australia [Booth et al. (Reference Booth, Maindonald and Smith2002)], China and South Korea [Li et al. (Reference Li, Lee and Tuljapurkar2004)], and Spain [Debón et al. (Reference Debón, Montes and Puig2008)].
The Lee–Carter model is a type of principal component analysis with a first component. In particular, the single principal component and its score are employed to obtain the trends and patterns of mortality rates. Its advantages are the simplicity and robustness for estimating log mortality rates by age [Booth (Reference Booth2006)]. Although the model is typically used for a single population, looking at multiple populations simultaneously can provide more accurate predictions. To obtain even more accurate predictions, populations whose forecasts do not diverge over time are more useful. These populations are called coherent and ensure that forecasts maintain structural relationships based on historical and theoretical conditions.
There are many differences and similarities in the projections based on certain elements, including environmental, social, political, behavioral, and cultural differences. This leads to the model being extended to improve its accuracy [see, e.g., Lee and Miller (Reference Lee and Miller2001), Brouhns et al. (Reference Brouhns, Denuit and Vermunt2002), Renshaw and Haberman (Reference Renshaw and Haberman2006)]. We first discuss the functional data models and the product-ratio method for coherent mortality forecasting discussed in Hyndman et al. (Reference Hyndman, Booth and Yasmeen2013). Our study applies the Lee–Carter model with functional data analysis (FDA) for modeling log death rates. FDA has recently gained considerable attention due to its advantage of dimensionality reduction. It is useful to analyze the clustering pattern of mortality rates over time. In particular, we follow the Hyndman and Ullah's (Reference Hyndman and Ullah2007) approach, which utilizes the FDA [Ramsay and Silverman (Reference Ramsay and Silverman2005)] for forecasting log death rates. It extends the original Lee–Carter model in two different ways: (1) nonparametric smoothing methods are used to estimate death rates by using more than a set of b x, k t components and (2) instead of random walk with a drift term in the Lee–Carter model, we consider state space representations for exponential smoothing. For the functional data model, we also consider an underlying smooth function f t,P(x) that is used to observe errors. Let m t,P(x) represent the death rate for age x and year t. Then, the log death rate can be modeled as y t,P (x) = ln[m t,P(x)]. For population P and year t, the function is defined as:

where x i is the center of the age group i for i = 1, 2, · · · , m, σ t,P(x i) is assumed to allow noise to change with age x, and ɛt,P,i is a standard normal random variable which is independent and identically distributed.
We adopt a coherent functional approach for H subpopulations in the product-ratio method.

where h = 1, · · · , H and p t(x) is the smoothed rates by the geometric average and thus represents the nonstationary behavior of all subpopulations. By taking the logarithm of the function, we obtain the following functional form of a time-series model:

Thus, the above equations can be easily rewritten as follows:

where μ h(x) = μ p(x) + μ r,h(x) is the group average and z t,h(x) = e t(x) + ρ t,h(x) is the error term (see Hyndman et al. (Reference Hyndman, Booth and Yasmeen2013) for more details).
The Lee–Carter model is designed to estimate the central mortality rates m x,t for age x in year t, which is equal to the ratio between the number of deaths, D(x, t), and the exposure to risk, E(x, t), which is the mean number of individuals living at t. Please note that the model in our study is a stochastic model, which comes with forecast probabilities while it assumes a log linear trend for mortality rates by age. Booth et al. (Reference Booth, Hyndman, Tickle and De Jong2006) show that on average the forecasting approach offers the most reliable forecasts of log death rates among four variants and extensions from the original Lee–Carter model based on the sample period between 1986 and 2000.
The penalized regression splines [Wood (Reference Wood2000)] are applied and a smooth function of age and basis functions are estimated by using the functional principal component decomposition analysis. One particular advantage of the functional model is its flexibility of describing changes in the age pattern, which can produce more reliable estimates of mortality rates than the original Lee–Carter model [Hyndman and Ullah (Reference Hyndman and Ullah2007)].
The log mortality rate by both age and time (m x,t) is decomposed as a linear function of parameters, which can be represented as:

In equation (1), an age-specific constant a x indicates the shape of mortality by age and the log geometric average of empirical mortality rates over the past years. In particular, taking the exponential to the power of a x, exp(a x), we can measure the typical shape of mortality schedule across age. A time-varying index (k t) provides the underlying time trend. A factor b x is included to account for different effects of time t at different ages. Over time b x is considered irrelevant, which accounts for the rate of a rapid or slow decline in response to k t. In particular, the product of k t and b x represents how fast the mortality rates fall in response to k t over time. Lastly, εx,t is assumed to be normally distributed. The age-specific error term takes into account the time- and age-specific trends.
The main driver of age-specific dynamic mortality rates is k t, which can be estimated by a two-stage process. In the first stage, the unobservable index (k t) is filtered by using a singular value decomposition of centered age profiles ($\ln m_{x,t}-\hat{a}_x$ ). This first step allows to estimate the parameters b x and k t. To ensure uniqueness of solutions, the following constraints have to be implemented: $\mathop \sum \nolimits _tk_t = 0$
 and $\mathop \sum \nolimits _xb_x = 1$
 . Then, as a second step, we refit $\hat{k}_t$
 on the number of deaths. This assures a better convergence between observed and estimated deaths. Our goal is to estimate k t such that $D\lpar {x,t} \rpar = E\lpar {x,t} \rpar \exp \lpar {{\hat{a}}_x + {\hat{b}}_x{\hat{k}}_t} \rpar$
 holds.
To forecast mortality rates into the future, we can model each year survival probability at age x by holding a force of mortality constant between [x, x + t). We also assume that the central rate of mortality approximates the force of mortality, written as $\mu _x \sim m_x$ . This is modeled in the following equation:

A life table showing the longevity of life for the cohort born in t is produced by selecting all p x,t for which t − x. More details can be found in Spedicato and Clemente (Reference Spedicato and Clemente2016).
3. Empirical analysis
The dataset from the Human Mortality Databases (HMD) is employed to apply the Lee–Carter model. The database provides detailed information on the incidence of deaths and life tables by age and sex.Footnote 1Table 1 presents the time spans for age-specific data available for each country considered in this study. The data include central death rates and mid-year populations by sex to 110 years. However, we restrict the data by selecting a maximum age equal to 100 in order to avoid possible errors at ages above 100. For the purpose of our study, we focus on the mortality rates of a cohort born in a particular year. Notice that we project the future mortality from 1950 to 2015 cohorts across countries. In this study, we forecast the mortality rate via the R packages, demography and forecast. The underlying principle of linear trends is extrapolation based on historic data.Footnote 2
Time periods

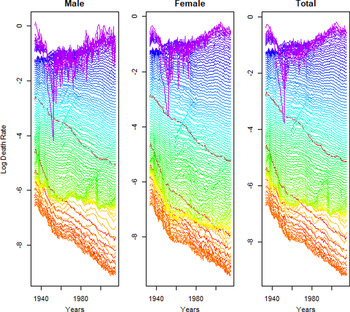
Figure 1 displays the historical death rates in the USA. The different colors represent the years the data came from with red being earlier and purple being present day. It is well known that mortality rates of females are lower than those of males, which leads to significant differences between female and male life expectancy at birth. We observe the difference at all ages. The figure strongly supports that mortality rates are falling at all ages. We also find the decreasing trend for mortality rates of all the generations in Figure A1, where the purple color is older generations and the orange color is younger generations.
US log central death rate (mortality rate) by sex.

Figure 2 exhibits the estimated parameters in the Lee–Carter model discussed in the previous section. In particular, the figure includes the basis functions (the middle figure in the panel) and their scores for the US log mortality rate forecast by sex. The Lee–Carter model only employs the single principal component, which explains the most of variability in mortality by age. The basis function in the product function captures the primary source of variations by age, and it weighs more younger age cohorts than old age cohorts. In particular, we employ the product-ratio approach in the Hyndman and Ullah's (Reference Hyndman and Ullah2007) model which uses log product and ratio series. Figure 2 clearly displays that younger age cohorts explain more variability of the product series than old age cohorts. Also notice that the figure shows apparent pattern of downward trending of coefficients (b x) to the basis function, which indicates that the mortality rates have steadily decreased. As is evident from Figure 2, the mortality rate is decreasing for that age group in the USA, which is consistently presented in Figure 3.
Basis function and its score for log mortality rate forecasts by sex in the USA.

US mortality rate forecasts by sex.

We also obtain figures for mortality rates by sex for our sample countries.Footnote 3 The figures consistently show that mortality rates in the countries have significantly decreased during the past decades. Similar to the USA, the log mortality rates show similar shapes across gender and there is a spike in the mortality rate around ages 20. Furthermore, all plots exhibit less variation within older age cohorts than that within the younger age cohorts. We find the universal pattern of mortality decline and also confirm that overall female mortality rates are still lower than those of males, even in other countries.
There has been little attention to an important role of annuities in retiree portfolios. The expected future transfers affect an individual's decision at longevity risk in both accumulation and payout phases. The longevity risk occurs due to longer life expectancy, which requires more retirement savings. An individual retiree is financed by a mix of government pension and private savings. In particular, many elderly households in the USA receive both an inflation-indexed lifetime annuity from the government and a nominal annuity from a company pension plan. Annuity provided by a government is a steady cash flow during retirement in most countries. Our study measures the magnitude of the lifetime retirement income in actuarial present value (APV) across countries. APV in our study is the present value of annuities that a government expects to pay under a retirement benefit plan.
We examine the impacts of higher life expectancy on retiree's financial constraints by calculating the APV of a public life annuity. Specifically, as defined in Spedicato (Reference Spedicato2013), the following expression gives life contingent random variables $\tilde{Z}$

where $\tilde{K}_x$ represents the remaining years in a lifespan. The APV in our study is given by

(N x − N x+n)/D x represents n years postponed annuity-due for a person aged x of commutation functions N x and D x. As an illustrative example, similar to Spedicato's (Reference Spedicato2013) model, let us assume that the premium can be paid by five annual payments as long as the retiree aged 65 is alive. The full premium of a 10-year postponed annuity would be written as

where $\ddot{a} _{65}$ represents the present value of a life annuity as long as an annuitant aged 65 survives.
We estimate the present value of a lifetime annuity, which is a predetermined cash flow to the annuitant as long as the beneficiary survives. We use the lifecontingencies package in R to generate random variables from the underlying present value distribution of future payments. Our paper further assumes that the first annuity is immediately transferred at the retirement year. The total value of the annuity series can be obtained by discounting the flows at the annuitant age of x for up to n years in this paper. Note that the package also has some built-in demographic and economic assumptions: the retirement is set at 65 regardless of the cohort, the number of payments each year is 12, and the APV estimates indicate a yearly annuity of one monetary unit.Footnote 4 We assume a constant 4% interest rate and a constant 2% inflation rate. This is a rather strong assumption, but it does not affect our relative APV estimates across cohorts. One could point out that other factors, such as income and education, have independent effects on individuals' mortality rates [e.g., Lantz et al. (Reference Lantz, House, Lepkowski, Williams, Mero and Chen1998), Deaton and Paxson (Reference Deaton and Paxson2001)]. However, there exists an endogenous issue between current income or education and health. For example, low-income individuals are likely to have higher mortality rates due to bad health care. However, it can also be true that unhealthy individuals are likely to make a low income. As a result, our empirical work focuses on age variables, which are the most critical factors affecting mortality.
We report projections of life expectancy and the annuity value for all sample countries in Table 2. A first feature in the table is that the forecasting model is able to explain almost 96% of the total variation in life expectancy of developed countries while it explains less variation for developing countries. In particular, the model explains only 76% of variations for Hungary. The table presents our forecasts, where E 0 indicates the life expectancy at age 65 for all sample countries.Footnote 5 For example, the cohort has a life expectancy at birth (in 1980) of 90.56 years for the Japanese and 74.43 years in Bulgaria. The table also shows that these estimates vary widely across cohorts. The improving longevity observed in the USA maintains in other countries over the prediction horizon.
Life expectancy and APV comparison: total

VE(%) indicates the percentage variation explained by the model.
Table 2 also displays the dynamics of APV across countries. Please note that we set the deferring period as 12 in the analysis. The measurement unit is a country's currency in this study, such as the Canadian dollar for Canada, the European euro for France, Italy, Austria, Portugal, and Spain, Pound sterling for the UK, the Japanese yen for Japan, the Australian dollar for Australia, and the Bulgarian lev for Bulgaria. We observe that APV increases as people are expected to live longer.
One goal of the study is to compare life expectancy and the estimated APV across countries. The results indicate that the estimated APV varies considerably across the sample countries and that Hungarians receive the least lifetime annuities. Let us assume a 2% real interest rate and consider the US fairly-priced annuity paying $1 real per year. The amount of such annuity for a 65-year-old retiree could increase from $7.71 in 1970 to $9.29 by 2010, which is an increase of about 20.49%. That is, to finance such a stream of retirement annuities, a 65-year-old retiree might need 20.49% more income in 2010 than in 1970. This would be to a large extent responsible for the under-funding of the public annuity in the near future.
Tables A1 and A2 in the Appendix present our gender-specific forecasts across countries.Footnote 6 There is a positive relationship between life expectancy and APV. The estimated APV at age 65 continues to increase for every cohort. These findings are consistent with those reported in Table 2. We generally find that APV is higher for females than for males for the entire cohorts, and the APV difference becomes magnified at newer cohorts.
There seems to be evidence that people live longer, they will receive more public lifetime annuities in Table 2. However, that does not mean that they will be insured well against the longevity risk. Table 3 shows changes in life expectancy and in APV at any cohort. A glance at the table shows that APV increases between the 1960 cohort and the 2015 cohort, but the APV differences across cohorts generally decrease in our sample data. A decrease in a slope is recognizable in the Japanese APV compared to the other countries.
Changes in mortality rate and APV comparison across countries: total

We construct a useful measure that quantifies the size of the buffer for absorbing longevity risks and provides an objective means of comparison across countries over time. The index is defined as the ratio of changes in APV to changes in life expectancy (ΔAPV/ΔE 0). That is, an increase in an index indicates that the retirees are likely to be exposed to a low longevity risk. Hungarians and Bulgarians are not quite so fortunate. The 2015 cohorts in those countries are exported to live for around 80 years. In Japan, the average ratio is 0.29, and in Hungary, the corresponding value is 0.33. The benefits from the public annuity in Hungary are substantially higher in Japan, although the public annuities in any country of our sample will at least partially insure individuals against longevity risks. The life quality can be determined by a variety of factors, but the estimation results strongly support that a government needs to provide the public with both a good medical care system and pension system simultaneously.
We can observe from Table 2 that generally there exists mortality compression (i.e., rectangularization of the survival curve) across countries, which could imply a decline in the longevity risk. However, Table 3 strongly shows that the ratio of changes in APV to changes in life expectancy is not consistently increased. While the ratio of changes in APV to changes in life expectancy increases until the 2005 cohort, the ratios for both the 2010 and the 2015 cohorts are expected to be lower than that in the USA. Longevity risk arises because the speed of prolonged life is faster than that of APV increments. Consequently, individuals at old age could be forced to live under a lower standard of living. This finding is robust because a similar pattern appears in most sample countries, except for Portugal where the ratio is expected to increase during the sample period.
Noteworthy is the fact that the lower statistics do not necessarily indicate lower life quality or higher longevity risk, but the individuals in countries with the low ratio are more likely to be exposed to the risk than people in other countries. This model does not take into consideration the quality of care an individual receives or how much income benefits come from the private sector. This caveat should be borne in mind in all our conclusions. For instance, it is possible that a country has a low ratio because people could finance their lifetime annuities from their personal retirement savings. Then, the retirees depend more on self-funded retirement annuity in the country. It is also important to point out that the extrapolative method is used for the mortality forecasts, which implies that the forecast of future mortality rates depends crucially on the age-specific time trend component based on probability distributions. Therefore, it could be possible that mortality improvements could be underestimated, which can cause governments' financial burden for public pensions to be exacerbated.
Table 3 also provides two risk statistics, such as the standard deviation (SD) and the coefficient of variation (CV). Particularly, CV is a measure of risk and is obtained by dividing the SD by the mean and multiplying by 100. We first observe that the SD statistic is higher in Japan, which implies that the Japanese are exposed to high risk and volatility in APV. The statistic clearly shows the significant risk exposure of Japanese retirees. Japanese retirees could experience high uncertainty in the APV from the evidence of the highest value of CV. These findings suggest important implications. Japanese retirees should purchase annuity products from the private sector to hold a buffer of their longevity risk. There are no clear patterns within our forecasts that show that people in the developing (developed) countries are likely to be exposed to a higher risk in public annuities than those in developed (developing) countries. While individuals are expected to live longer in all the countries, they are more likely to be exposed to longevity risk. Policy makers need to ensure the successful development and growth of annuity markets in the private sector. It might be true that future socioeconomic factors of uncertainty are relevant for the funding of future pensions. Witkowski (Reference Witkowski2017) investigates important factors that affect changes in mortality by using a principal component analysis. The empirical findings show that macroeconomic conditions, the natural environment, and social inequality are significantly associated with mortality trends. However, our study tries to investigate how uncertainty regarding future mortality and life expectancy affects government pension benefits for retirees. All other things being equal, longevity risk influences the net liabilities of public pension plans as the payment period increases. In this regard, our paper stresses that retirees would not be fully covered from longevity risk by using solely public annuities. Therefore, a government can encourage financial markets to provide more private lifetime annuity that could partially absorb the risk.
As the anonymous reviewer points out, there is a possibility of overestimating the future decline of mortality rates as well as longevity risks. To improve our current version of the paper, we estimate public annuity benefits by considering various parameters, such as different deferring periods of 0, 5, and 8 and different ages of the annuitant of 58, 60, and 62 across the sample countries as shown in Tables 4 and 5. If an annuitant defers his government pension for another year, he is entitled to boost his annual pension. However, it will take longer for him to recoup the money he gives up. Therefore, a decision on deferring periods could depend on an annuitant's age and life expectancy. Also deferring public pensions could be a less tempting option if the present value of an individual is very low due to high discount rates. Table 4 clearly displays that there exists a negative relationship between deferring periods and APV for all sample countries over the sample periods given the parameter values in estimations.
APV comparison with different deferring periods: total

APV comparison with different ages of the annuitant: total

Table 5 presents that different annuitant ages generate significant differences in APV. Annuitant age in practice varies across countries. The estimation results clearly show that when the annuitants are younger, the APV increases. The gender-specific estimation results are also shown in the Appendix. The empirical results are largely consistent with the findings in Table 5. As discussed above, due to the assumption of the invariant age component over time in the model, it is possible that our estimates overestimate the future mortality reductions. The reduction in a country's mortality rate for the population ages 65 and older is likely to be much higher when its mortality level is higher than when it reaches a lower level. While the underlying assumption may not be realistic, it is assumed in order to highlight longevity risk caused by faster growth in life expectancy than the growth of expected public pension, which is the main goal of our analysis.
Table 5 also implies that a government can reduce its spending on state pensions by increasing the age of eligibility for the public pension. Raising the eligibility age will lead to a decrease in the number of individuals eligible for the pension. Thus it allows the government to provide more generous benefits, but to fewer eligible residents. Policy makers should consider the demographic changes, government budget constraints, and life expectancy while deciding the optimal annuitant age. The tendency in most countries is to gradually increase the annuitant age at which individuals are entitled to receive a government pension.
4. Conclusion
This article investigates the differences in expected public lifetime annuities between particular demographic groups within a country and across countries. Less empirical analysis is devoted to the public lifetime annuity, which can provide retirees with a financial buffer to deal with longevity risk. The reliable forecast of life expectancy is critical in our study. We use the Lee–Carter model, which is well-known in mortality modeling literature as a simple but powerful method.
We first observe that life expectancies at birth are expected to grow over the next few decades in the USA. Similar trends are also expected to occur in the other sample counties. We find strong evidence that female retirees are likely to receive more public lifetime annuity than males, which is associated with systematic mortality rate differences between the genders. Our analysis explicitly considers longevity risk and finds that the current public annuity system could not fully cover longevity risk that retirees face. The comparison of the forecast estimates across countries shows that the Japanese are exposed to high risk and volatility in public provision of annuities. Our study strongly suggests that, from a policy perspective, policy makers need to ensure the successful development and growth of annuity markets in the private sector.
Our study provides mortality rates and APV estimates by utilizing the Lee–Carter model. It is a least-squares estimation through a singular value decomposition of the log observed forces of mortality by age. The model implicitly assumes the homoscedastic error case. However, it could be possible that the log observed force of mortality can vary more at older ages than at younger ages due to a smaller number of deaths at very old ages. Also, this model provides explanatory power for developed countries while it is not well-fitting for the developing countries in our study. To overcome these drawbacks, one can apply other models, such as a Poisson log-bilinear regression model [Brouhns et al. (Reference Brouhns, Denuit and Vermunt2002)] by taking into account the differences across countries.
As the anonymous referee pointed out, the extent to which a government could face the longevity risk in the future depends on not only the level of future mortality rates but also other factors that are assumed to be constant in this study. For example, the ability of the governments to collect future fiscal revenues will affect the level of public annuity, which depends on future labor market conditions and economic growth. In particular, future fertility rates, labor force aging, age-specific productivity, and the size of the economically active population compared to the non-working population (i.e., the dependency ratio) are also critical factors for determining the longevity risk to economic agents. It would be worthwhile to investigate the impact of the longevity risk on public pensions by considering economic, environmental, and epidemiological factors when forecasting future mortality rates.Footnote 7 This cross-country empirical analysis can extend Frassi et al.'s (Reference Frassi, Pammolli and Regis2017) study, which focuses exclusively on Italy.
Appendix
Life expectancy and APV comparison: male

Life expectancy and APV comparison: female

Changes in mortality rate and APV comparison across countries: male

Changes in mortality rate and APV comparison across countries: female

APV comparison with different deferring periods: male

APV comparison with different deferring periods: female

APV comparison with different ages of the annuitant: male

APV comparison with different ages of the annuitant: female

US log central death rate (mortality rate) by generation.