I. INTRODUCTION
Glass/ceramic-to-metal seals serve critical engineering roles in aerospace, electronics, automotive, nuclear, and other energy sector industries. Mating of metal and ceramic/glass can provide hermetic and electronic isolation of components while enabling mechanical strength for harsh operating environments (Donald et al., Reference Donald, Mallinson, Metcalfe, Gerrard and Fernie2011; Huang et al., Reference Huang, Wang, Mao, Liu, Li, Zhang and Chen2025). One of the many engineering challenges posed by these complex materials systems is the matching of thermal expansion of the glass/ceramic matrix to that of the metal. Since metals, as a class of materials, generally have a much higher thermal expansion behavior relative to glass and ceramics, designing glass–ceramic matrix materials with relatively high thermal expansion behaviors has been an area of active research (Rodriguez et al., Reference Rodriguez, Griego and Dai2016). One of the most common means of achieving higher thermal expansion behaviors is by exploiting the volumetric phase transformation behaviors for silica-based constituents crystallized within or added to glass matrices. Cristobalite and quartz phases both display significant volume changes during heating, with cristobalite converting from its tetragonal (α) form to a cubic structure (β) at ~250 °C, whereas quartz undergoes a trigonal (α) to hexagonal (β) phase transformation at ~570 °C. Because the phase transformation and corresponding volume change of cristobalite occur at a lower temperature, it more ideally serves to impact thermal expansion behavior for applications closer to room temperature. One consistent observation regarding cristobalite in our glass–ceramic matrix materials was the detection of a larger unit cell for cristobalite in glass matrix conditions, relative to the reported lattice parameters and cell volume for those of phase pure α-cristobalite. This observation was hypothesized to result from tensile strain present at the interface between the glass matrix and the cristobalite crystallites. However, an alternative hypothesis was that this change was chemically induced via the reaction of the cristobalite with the glass matrix composition, thereby modifying the chemical composition of the cristobalite phase and the resulting cell parameters. Support regarding strain-induced changes to cristobalite has been documented previously. Cohen and Klement (Reference Cohen and Klement1975) demonstrated that the cristobalite α–β phase transition can be shifted to higher temperatures via the introduction of an externally applied isostatic compressive stress. Likewise, Roy and Buhsmer (Reference Roy and Buhsmer1965) showed that the α–β transition temperature can be shifted downward via neutron bombardment of cristobalite where the proposed mechanism of this behavior was attributed to possible defect formation, resulting in tensile stress within the cristobalite crystallites. The limited reports regarding the impact of tensile strain on the cristobalite transformation for pure cristobalite (as either bulk or powder material) indicate the difficulties of generating such context experimentally. Therefore, if the diagnosis of tensile strain is confirmed via the presence of a glass matrix, this affords an opportunity to monitor the effect of such strain fields on the cristobalite phase during heating/cooling. Likewise, such strain fields may play a role in the reliability aspects of glass/ceramic–metal seals. We designed experimental protocols to test the presence/absence of macrostrain-induced changes to cristobalite and performed in situ monitoring of cristobalite at elevated temperatures to evaluate the α–β transition in pure cristobalite powder compared to cristobalite present within a glass matrix. Our results and conclusions are presented herein.
II. EXPERIMENTAL
A. Sample preparation
There were four samples employed for our study. The first was a ~5 μm (D50) NIST cristobalite powder SRM 1879b (Black et al., Reference Black, Mendenhall, Whitfield, Brown, Henins, Filliben and Cline2018), which served to establish lattice parameters and phase transition behaviors of an idealized cristobalite compound. The second sample was a commercially purchased cristobalite powder (~8 μm D50) from Kremer (Kremer Pigmente, New York, NY). This sample was also investigated to compare/contrast the commercially employed source of cristobalite to the more ideal NIST cristobalite. The Kremer cristobalite phase was analyzed both as an independent powder and as an added (35 wt%) crystalline phase into a Ba-Al-Silicate glass matrix (glass composition CGI930) via a reflow process. Specifically, the mixture of glass and cristobalite powder was placed into a graphite mold and heat treated at 960 °C for 10 minutes to allow the mixture to melt and flow, resulting in a dense glass–ceramic composite body. Small (3 mm × 6 mm × 0.5 mm) solid pieces were then cut from the bulk material for analysis. Finally, some of the bulk glass matrix material was ground to fine powder (particle size of ~3 μm D50) via a Spex mill to obtain the final powder sample, which represented the Kremer cristobalite phase within the context of a glass matrix, but with the potential release of the cristobalite from any strain conditions created by the glass matrix. For simplicity, these four samples NIST SRM 1879b powder, Kremer cristobalite powder, Kremer powder in CGI930 glass as a reflowed solid material, and the same solid material after grinding will henceforth be referred to as NIST, KREMER, 35BULK, and 35GRND, respectively.
B. Instrumentation
Standard X-ray Diffraction (XRD) measurements of the four samples were measured using a Siemens D500 θ–θ X-ray diffractometer equipped with a sealed tube X-ray anode (Cu Kα/40 kV, 30 mA), a graphite monochromator, and a scintillation detector. To establish refined structural parameters for the cristobalite phases, XRD scans were collected from 5 to 100° 2θ, with a step size of 0.02° and a count time of 10 seconds to obtain the ideal patterns for refinement, for example, low background noise and smooth peak profile shapes. Rietveld refinement was performed using JADE Pro Version 9.1 (Materials Data, Inc.). An Anton-Paar DHS 900 hot stage was employed for the high-temperature studies with experiments run in an air atmosphere. High-temperature XRD measurements were performed using a Bruker D8 Discover diffractometer. This XRD instrument was configured with a sealed tube X-ray anode (Cu Kα/40 kV, 40 mA), incident beam mirror optic, 0.5-mm pinhole optic, and a VANTEC 2000 area detector. Scans were collected from 15 to 45° 2θ with a frame count time of 20 seconds and a step size of 0.02° 2θ. Heating/cooling rates for the temperature scans were 5 °C/min. The stage temperature was calibrated via the use of melting point standards. For heating/cooling experiments to evaluate the α–β cristobalite phase transition, samples were heated to 350 °C. For isothermal holds, bulk cristobalite/glass samples were evaluated by ramping quickly (25 °C/min) to the hold temperature and monitoring the XRD patterns for approximately 30 to 130 minutes to monitor for the possible relaxation of the cristobalite phase at temperature. Differential scanning calorimetry (DSC) was performed on the NIST powder using a Netzsch STA instrument under flowing air to cross-validate the phase transformation behavior.
III. RESULTS AND DISCUSSION
A. Standard XRD analysis
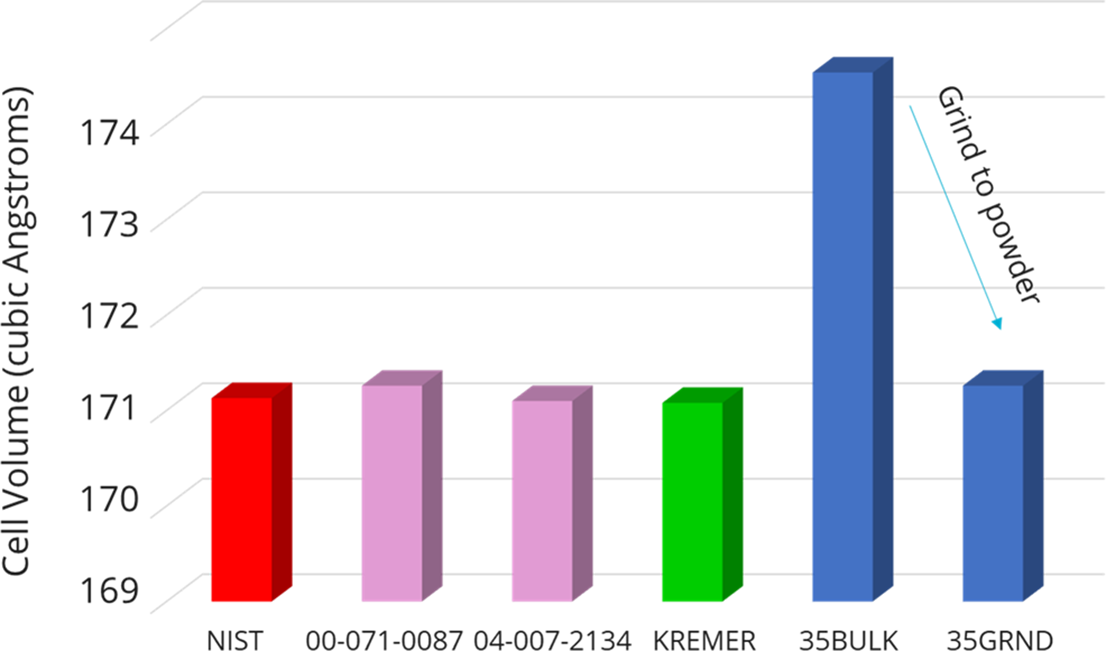
Figure 1 shows room temperature X-ray diffraction patterns for the NIST and 35BULK samples. There is a clear shift to lower angles (larger d-spacing) for the 35BULK sample relative to the peaks for the reference material. The cell expansion observed in the 35BULK pattern is assumed to result from the restraining behavior of the glass matrix as the cristobalite/glass matrix was cooled at high temperature during the synthesis of the bulk sample. Our hypothesis is that the glass phase serves as a means of hindering the contraction of cristobalite during cooling to the reported room temperature values for the tetragonal α-cristobalite structure. This mechanism is similar to that proposed by Breneman and Halloran (Reference Breneman and Halloran2014) for cristobalite in fused silica. To test this hypothesis, refinements were performed on the XRD patterns collected at ambient conditions for all four samples (NIST, KREMER, 35BULK, and 35GRND). The resulting lattice parameters and cell volumes are shown in Table I and those of exemplar α-cristobalite phases are reported in the PDF-5+ database (Kabekkodu et al., Reference Kabekkodu, Dosen and Blanton2024). Note that the NIST and KREMER lattice parameters and cell volume are nearly identical, indicating the similarity of the commercially purchased KREMER cristobalite powder to that of the NIST SRM material. Also note the significant expansion of the 35BULK unit cell relative to both the KREMER and NIST powders; the resulting cell expansion is ~0.028 Å on the a-axis and an even larger ~0.60 Å expansion on the c-axis. If this expansion is caused by restraining tensile stress due to the glass matrix, the strain could be substantially reduced if the cristobalite grains could be removed from the confinement of the glass matrix. This is indeed observed. The lattice parameters and cell volume for the 35GRND powder display values comparable to those of the NIST and KREMER samples (within the error). Figure 2 illustrates this graphically, showing the unit cell volumes of the samples along with the star-quality cristobalite phases from the PDF-5+ database. Note that a small fraction of Tridymite was detected in both the NIST powder and KREMER cristobalite samples as powder or bulk materials. This trace presence of Tridymite did not appear to have a significant impact on the overall results of the experiments.
XRD patterns for the 35BULK and NIST samples illustrating a peak shift to lower angles for cristobalite in the 35BULK sample. This resulting cell expansion is likely due to tensile strain from the constraining glass matrix. The (*) indicates a trace of the Tridymite phase present.

Refined cell parameters for the various α-cristobalite containing samples at ambient conditions

Refined cell volume for α-cristobalite at ambient conditions. Note the significantly expanded unit cell for the 35BULK sample compared to all other samples.

The results of the grinding study strongly indicate that the glass phase serves to constrain the cristobalite phase, hindering relaxation back to the expected values for α-cristobalite, and that grinding of the specimen enables the cristobalite phase to again release from the tensile strain conditions to relax back to the anticipated values for α-cristobalite at ambient conditions.
B. Isothermal monitoring of 35BULK samples
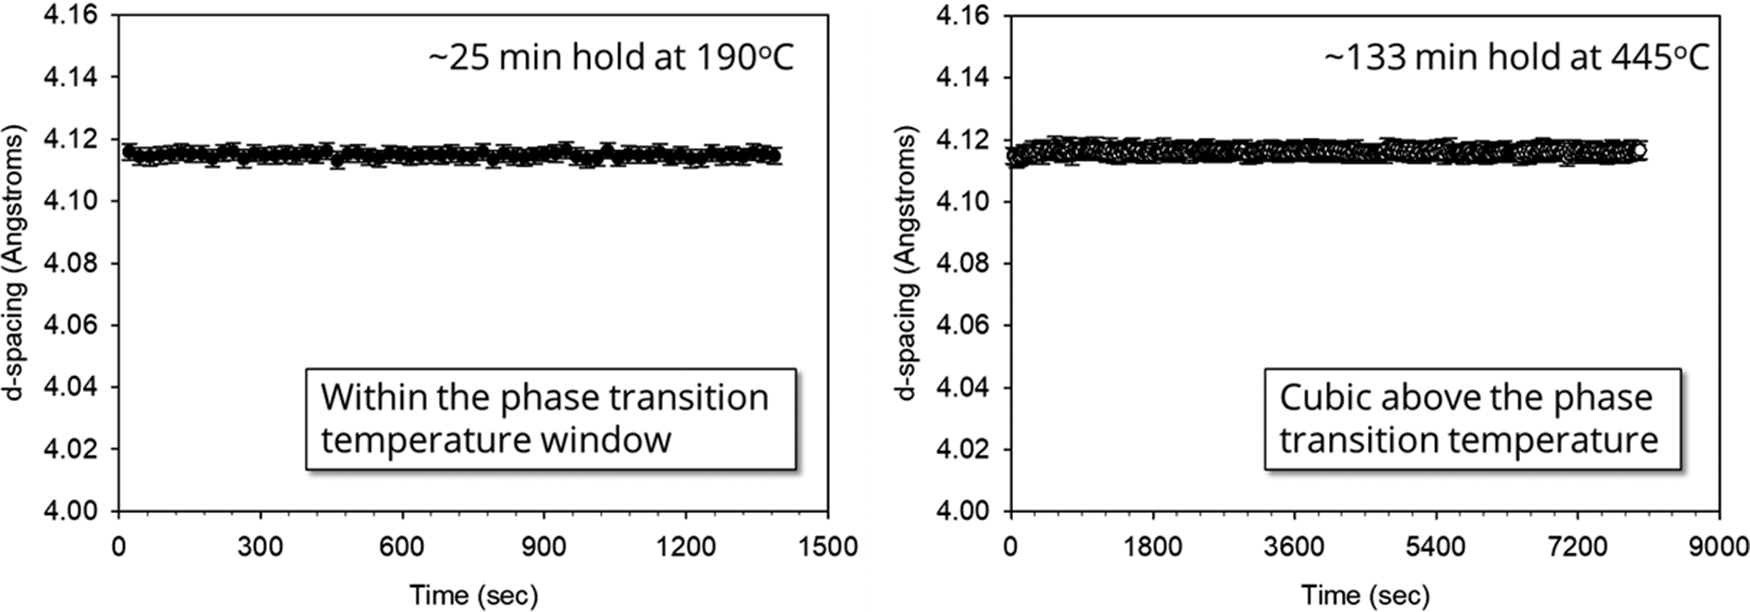
With the confirmation of a tensile strain field present that limits the relaxation of cristobalite, we performed isothermal holds at different temperatures to monitor the cristobalite phase as a function of time at temperature. Figure 3 shows the result of isothermal holds for the 35BULK sample. Each sample was run as a separate experiment where a small piece (3 mm × 6 mm × 0.5 mm) of the 35BULK glass matrix specimen was mounted on the heating stage and aligned via the laser alignment system. To monitor the structure, an exemplar reflection was employed. We chose the tetragonal (101) of the α-cristobalite phase, which incidentally corresponds to the (111) reflection of the β-cubic phase above the phase transformation. This peak is ideal in that it is the most intense reflection in both the α and β forms and is not convoluted by additional (hkl) overlap, thus enabling straightforward peak fitting of the observed reflection and direct comparison above and below the transition temperature. Figure 3 (left) shows the resulting refined d-spacing values for the cristobalite phase collected at 190 °C, near the phase change to the cubic structure. The peak location shows no significant changes during the ~25-minute isothermal hold. Figure 3 (right) shows a similar analysis for cristobalite above the phase transformation to the cubic form, holding at 445 °C for more than 2 hours. The absence of any significant change in d-spacing with hold time suggests that while there may be a possible strain field around cristobalite crystallites that have developed during cooling of the cristobalite/glass-matrix 35BULK sample, there is no evidence of relaxation of this strain at the reported hold temperatures. This indicates that, at these temperatures, the glass matrix has sufficient rigidity to restrain the cristobalite phase without cristobalite relaxation. This result was encouraging because it suggests that any glass/ceramic composite materials employed in seal applications may not suffer aging effects due to the presence of a tensile strain field on the cristobalite phase.
Isothermal holds for the 35BULK sample at 190 °C for 25 minutes (left) and 445 °C for 133 minutes (right). There was no indication of structural relaxation of the tetragonal α-cristobalite (101) peak at 190 °C or the β-cristobalite peak at 445 °C.

C. In situ characterization of NIST cristobalite
The use of high-temperature XRD for monitoring the cristobalite phase transformation enabled a further detailed understanding of the phase transformation behavior of the idealized cristobalite phase compared to that of cristobalite present in a glass matrix. To establish the transformation behavior of the NIST powder sample, the material was heated while monitoring the XRD pattern as the sample progressed through the α–β phase transformation. Figure 4 shows the results of the NIST sample heated from 25 to 350 °C. Figure 4 (top left) shows the d-spacing values for the tetragonal (101)/cubic (111) peaks and confirms a clear phase change between 230 and 260 °C. The XRD data support the coexistence of both the α and β forms in this temperature window. Figure 4 (bottom left) shows the corresponding DSC data collected upon heating (same 5 °C heating rate). The DSC data indicate a peak maximum within the same window as the two-phase region observed in the XRD data. A zoomed region for the DSC curve shown in Figure 4 (right) indicates a peak maximum at 249 °C, which is consistent with published results for cristobalite (Damby et al., Reference Damby, Llewellin, Horwell, Williamson, Najorka, Cresseye and Carpenter2014). These results can serve as a baseline for comparison to high-temperature results for the other samples.
Comparison of the XRD and DSC results for NIST cristobalite. The XRD results (top left) indicate a clear transition and two-phase region between 235 and 260 °C. The DSC results (bottom left) confirm the endothermic peak denoting the phase transition from α–β cristobalite. A zoomed region of the DSC results (right) shows the onset and peak maximum for the NIST cristobalite.

Cycling of cristobalite revealed a hysteresis behavior for the NIST sample. Figure 5 shows the tetragonal (101)/cubic (111) d-spacings as monitored during heating (Figure 5, left) and cooling (Figure 5, right). The data for heating and cooling appear to be mirror images of each other, but there is a clearly observed hysteresis; the phase transformation upon heating occurs at the aforementioned 249 °C, whereas upon cooling, the phase transformation occurs at a lower temperature of 225 °C. The presence of both a volume change and temperature hysteresis confirm the first-order (displacive) nature of the cristobalite α–β transformation. The hysteresis effect can be associated with the nucleation of the converting phase where the barrier for nucleation differs depending on heat treatment direction, that is, heating versus cooling (Hu et al., Reference Hu, Hibino, Ogino and Tsong2001; Breneman and Halloran, Reference Breneman and Halloran2015).
Observed d-spacings for the tetragonal (101)/cubic (111) peaks upon heating (left) and cooling (right) for NIST cristobalite powder. The transition temperature shifts downward by 24 °C when the sample is cooled through the transformation temperature region (225 °C), confirming a hysteresis behavior for this NIST powder sample.

For completeness, we report the full-width-at-half-maximum (FWHM) for the tetragonal (101)/cubic (111) peaks through the transition. Monitoring the FWHM can help assess the increase in microstrain present as the sample undergoes this displacive phase change. Figure 6 shows the FWHM for the monitored tetragonal (101)/cubic (111) d-spacing. There is only a slight change in FWHM as cristobalite undergoes the α–β phase transformation upon heating (Figure 6, left) and an effective mirror image of the FWHM behavior upon cooling (Figure 6, right). This suggests that, for this sample, there is very little development of microstrain in the cristobalite phase due to the displacive phase transformation. The FWHM curves also faintly reveal the phase change via the small step in FWHM values occurring at the same α-β phase transformation temperatures for heating and cooling as was observed for the d-spacing result (Figure 5). It is worth noting here that Breneman and Halloran (Reference Breneman and Halloran2015) observed changes in hysteresis behavior due to cristobalite particle size when the average particle size exceeded 38 μm. Therefore, all our powder samples were verified to be less than 10 μm (D50) in particle size to avoid this effect. With the NIST phase fully characterized in terms of heating and cooling behavior, these results were evaluated against those obtained for the other samples.
Observed FWHM values for the tetragonal (101)/cubic (111) peaks upon heating (left) and cooling (right) for the NIST sample. The FWHM for the NIST material changes very little through the transition, displaying only a slight reduction in the FWHM when transitioning to the cubic phase during heating and a slight increase in FWHM upon cooling from the cubic to tetragonal phase.

D. In situ characterization of KREMER cristobalite
Identical in situ high-temperature XRD measurements and analysis were performed on the KREMER powder. Figure 7 shows a side-by-side comparison of contour plots of the two powders during heating. There was a slight difference in the final maximum temperature for the KREMER powder due to a required temperature calibration correction. The contour plots show an angular range from 20 to 38° 2θ on the x-axis and increasing temperature on the y-axis. Figure 7 (left) shows the result for the NIST powder, revealing a clearly discontinuous change in the pattern at ~250 °C.
Contour plots for NIST powder (left) and KREMER powder (right) during heating. Peaks are indexed as the tetragonal (α) phase and cubic (β) phases in each plot. The NIST phase transition appears more distinct with temperature compared with the KREMER powder sample.

In contrast, Figure 7 (right) shows the contour plot for KREMER powder, showing a more gradual transition from α to β cristobalite phase. The transition occurs at approximately the same temperature (~250 °C), but the two-phase region appears to be extended and the α cristobalite peaks show more significant decay of intensity rather than an abrupt truncation upon heating as is seen for the NIST powder. This suggests that while the KREMER powder is similar in terms of lattice parameter values (as per Table I), the material undergoes transformation more gradually. The origin of this behavior is not fully understood but might be related to small differences in composition, crystallinity, or morphology along with other factors such as X-ray penetration depth arising from variation in powder packing density and possibly minor differences in temperature uniformity. Note that a more gradual transition from α to β cristobalite may prove better in terms of application use. The purpose of employing the α–β transition is to artificially modify the thermal expansion behavior of the glass/ceramic matrix to more closely match that of metal materials. A truncated volume change is more apt to cause mechanical failure due to sudden stresses in the material. Therefore, a slower transition could enable a more uniform matching of thermal expansion coefficients between the glass/ceramic matrix material and the bonded metal.
Figure 8 presents the tetragonal (101)/cubic (111) d-spacing behavior for the KREMER powder. Figure 8 (left) shows the change in peak location upon heating, and Figure 8 (right) shows the corresponding cooling behavior. The same hysteresis behavior is observed for the KREMER powder as for the NIST material, with nearly identical temperatures for the phase transition. The shape of the curve is a bit different. There appear to be slight deviations in d-spacing away from the expected trends as the sample approaches the transition temperature. This slight deviation is likely an artifact of the profile fitting. As the sample approached the transition temperature, either upon heating or cooling, the observed diffraction profile became very broad, indicating a two-phase region with the coexistence of both α and β cristobalite. This very broad profile was different from the NIST sample where the peaks of the two phases could be more easily detected and modeled. Unfortunately, the broad peak profile of the KREMER powder was not easily modeled as two separate peaks for the α and β phases. Instead, the profile tended to have a skewed shape on either side of the transition, having a tail toward the high-angle side (smaller d-spacing) below the transition and a skewed tail toward the low-angle side (larger d-spacing) above the transition temperature. Since it was difficult to model profiles for both phases in this transition range, the broad and skewed profiles were fit with a single profile with an understanding that the deviations in peak shape resulted in the anomalous shifting of the peak locations near the phase transformation temperature due to the skewed nature of the profile. These profile artifacts can serendipitously reveal the temperature span of the two-phase region for the KREMER powder. It is worth noting that the deviations below the transition during heating, for example, from ~200 to 230 °C (Figure 8, left), are considerable, whereas such a deviation below the transition temperature is essentially absent upon cooling. This may imply that the hysteresis behavior that pushes the transition temperature lower upon cooling allows for a more rapid phase change compared to the heating process. In this sense, the heating/cooling plots are not mirror images of each other.
Observed d-spacings for the tetragonal (101)/cubic (111) peaks upon heating (left) and cooling (right). The transition temperature shifts downward by 24 °C when the sample is cooled through the transformation temperature region (226 °C) relative to the transition temperature observed during heating (250 °C).

Figure 9 presents the FWHM results for the KREMER powder sample showing the resulting FWHM during heating (left) and cooling (right). The FWHM for the KREMER material does reveal a small offset in FWHM between the cubic (β) and the tetragonal (α) phases. This change in FWHM was not observed for the NIST sample and suggests that for the KREMER powder, the transformation to a tetragonal structure occurs with a corresponding increase in microstrain. It is notable that the FWHM for the tetragonal phase displays a subtle, but gradual, decrease in value from room temperature to ~200 °C during heating (Figure 9, left). Likewise, the FWHM subtly increases during cooling as seen in Figure 9 (right) from ~200 °C to ambient. This observation is consistent with the microstrain continuing to develop within the cristobalite as the tetragonal cristobalite moves further from the transition temperature. The very broad FWHM values observed near the transition temperature are associated with the two-phase region of α and β cristobalite. Because the intensity for the tetragonal (101)/cubic (111) reflections was modeled as a single profile through the transition, the FWHM becomes anomalously broad. In a similar fashion to Figure 8, the broadening of the fitted profile near the transition provides an assessment of the temperature range of the two-phase region. It appears that the breadth of this two-phase region is wider in temperature during heating than cooling. This again may be related to the hysteresis behavior and suppression of the transition to lower temperatures during cooling.
Observed FWHM values for the tetragonal (101)/cubic (111) peaks upon heating (left) and cooling (right) for the KREMER sample. The significant broadening at the transition temperature is due to the intensity in the two-phase region being modeled as a single broad peak.

E. In situ characterization of 35BULK and 35GRND samples
Figure 10 shows a side-by-side comparison of the contour plots for the 35BULK (left) and 35GRND (right) samples during heating. The overall scale of the cristobalite intensity is lower. This results from the dilution of the cristobalite signal due to mixing with CGI930 glass. However, one can still observe the α to β phase change easily in these figures. Figure 10 (right) shows a similar phase transformation temperature of ~250 °C to that of the KREMER sample (i.e., Figure 7, right). This makes sense because the 35GRND sample is composed of Kremer cristobalite in a CGI930 glass matrix. Table I reveals that the cristobalite phase within the 35GRND powder sample returned to the expected lattice parameter values of the original KREMER raw material. Much of the tensile macrostrain due to glass matrix restriction has been reduced due to the grinding, thereby allowing the cristobalite to behave in like fashion to the KERMER sample seen in Figure 7 (right). Additionally, the 35GRND cristobalite peak intensities show the same gradual transition from α to β cristobalite as was observed for the KREMER result in Figure 7 (right).
Contour plots for 35BULK (left) and 35GRND powder (right) during heating. Peaks are indexed as the tetragonal (α) phase and cubic (β) phases in each plot. The 35BULK sample clearly illustrates a suppressed α–β transition temperature compared to its ground counterpart.

In stark contrast to the 35GRND sample, Figure 10 (left) reveals a dramatic suppression in α to β transition temperature for the 35BULK sample, reducing the transition to just below 200 °C. This significant shift must be related to the bulk nature of the sample and again correlates strongly with tensile macrostrain effects that are likely present. A shift in the α–β transition temperature for cristobalite within a glass matrix has been observed before. Past work on a belt-processed S-glass (or BPS glass) revealed cristobalite within this lithium silicate glass–ceramic to display a suppressed transition temperature of ~200 °C for the bulk specimens employed (Rodriguez et al., Reference Rodriguez, Griego and Dai2016). Coupling these observations with the previous reports from Breneman and Halloran (Reference Breneman and Halloran2014) regarding the detection of stress fields surrounding isolated cristobalite spherulites in fused silica glass via crossed-polarized imaging lends strong support to the presence and impact of tensile strain at the cristobalite/glass interface and the likely impact of this strain on the transition temperature in the 35BULK samples.
There was a desire to understand any effects of cycling through the heating/cooling process to determine if the samples revealed any changes in d-spacing and/or FWHM for either the 35BULK or 35GRND samples. For these cases, the same sample was processed from room temperature to 350 °C and back down to room temperature, and then the same heating/cooling cycle was repeated to generate XRD datasets for Cycle 1 and Cycle 2 heat treatments. Figure 11 reveals the d-spacing behavior of the tetragonal (101)/cubic (111) peaks during the heating–cooling cycling of the 35GRND powder. This plot shows that the heating and cooling cycles look very similar during both Cycle 1 and Cycle 2. Note that the error on the peak locations has significantly increased compared with either Figure 5 or Figure 8. This is due to the lower overall intensity of the cristobalite in the sample from dilution via the glass phase. The phase transition for the 35GRND sample during heating occurs at ~245 °C for Cycle 1, whereas upon cooling, we again see the hysteresis effect with the transition shifted to ~220 °C. The identical behavior is observed for Cycle 2, with the same overall appearance of the cycles and transition temperatures. The results suggest that the structure undergoes a phase change in a repeatable fashion. The temperature differential between heating and cooling (~25 °C) is consistent with that observed in Figures 5 and 8 for the NIST and KREMER samples, respectively.
Tetragonal (101)/cubic (111) d-spacings for sample 35GRND through two heating/cooling cycles. The results suggest a repeatable transformation that demonstrates hysteresis, with a similar temperature differential of ~25 °C between heating and cooling.

If we compare the results for Figure 11 with those of the 35BULK sample, we observe something quite different. Figure 12 shows the results for the tetragonal (101)/cubic (111) d-spacings for sample 35BULK through two heating/cooling cycles. While the cycles appear to reproduce, the hysteresis between heating and cooling is absent, with both cycles transitioning between α and β cristobalite at ~195 °C upon heating, and at this same temperature upon cooling. This provides strong evidence for a macrostrain-related mechanism for hysteresis suppression. It is also notable that the transition temperature observed is considerably lower than the cooling cycle for any of the samples, including the 35GRND sample. This would suggest that the presence of a tensile strain shifts the transition temperature lower, hindering the displacive transformation during cooling, and enabling the transition to occur at the same, lower temperature of 195 °C upon heating. The suppression of thermal hysteresis for cristobalite was also observed previously (Rodriguez et al., Reference Rodriguez, Griego and Dai2016) for BPS glass, though a complete loss of hysteresis was not observed in that work.
Tetragonal (101)/cubic (111) d-spacings for sample 35BULK when undergoing two heating/cooling cycles. The results suggest a repeatable transformation without any apparent hysteresis behavior.

In addition to the suppression of hysteresis, the d-spacing range for the 35BULK versus 35GRND also looks to be different. In Figure 11, we note that the initial room temperature d-spacing value begins at ~4.06 Å and upon heating to 350 °C ends at a value slightly above 4.12 Å. This was true for both cycles in Figure 11. In contrast, Figure 12 shows a larger room temperature value of ~4.07 Å for the 35BULK sample, which has already been attributed to the constraint of the cristobalite due to the glass matrix. The d-spacing at ~350 °C is observed at slightly less than 4.12 Å. This reduced range for the tetragonal (101)/cubic (111) d-spacing indicates a smaller volume change through the α to β phase transformation for the 35BULK sample compared to the 35GRND. Likewise, the phase transformation in Figure 12 appears to take place over a larger range of temperatures, resulting in a smoother transition compared with Figure 11 for 35GRND, which shows a more sudden change in volume similar to that observed for the NIST and KREMER powder samples. These observations suggest that the presence of the glass matrix may smooth the transformation of cristobalite, thereby potentially reducing any damaging effects of the sudden volume change resulting from the α–β transformation.
Analysis of FWHM of the 35BULK and 35GRND samples with cycling was also performed. For brevity, we do not present the FWHM as a function of heating and cooling for these two samples. Instead, we summarize these results in Figure 13, which plots the difference in FWHM between the room temperature scan (as α phase) and the FWHM at 300 °C (β phase). For example, when viewing Figure 9 for the KREMER sample, there is an offset in FWHM between the room temperature condition and the FWHM at 300 °C. This difference (FWHM of (101) @25 °C − FWHM of (111) @300 °C) can serve to evaluate the buildup of microstrain in the α phase. Figure 13 shows the differential values observed for the KREMER sample, revealing an approximate increase of between 0.02 and 0.03° upon both heating and cooling, with cooling showing a slight increase in FWHM. Likewise, the NIST sample showed ~0.01° change in FWHM, or very little peak broadening that could be attributed to microstrain buildup from the α–β phase change. This is strongly contrasted by the 35BULK and 35GRND samples, which show a significant change of FWHM between the 25 °C α cristobalite and the β cristobalite at 300 °C. In the case of the 35BULK sample, the FWHM differential is approximately 0.10° regardless of heating or cooling direction, and the difference in FWHM does not show a significant reduction on the second cycle versus that of the first. The 35GRND sample shows similar differentials in FWHM as the 35BULK sample, with a slight increase in FWHM upon cooling. This microstrain is likely tied to the fact that cristobalite in both 35BULK and 35GRND samples are in some way restrained by the glass matrix present. It is interesting to note that the results for 35BULK and 35GRND in Figure 13 are similar in terms of this microstrain indicator, even though grinding of the 35GRND sample has been shown to have enabled the global-average lattice parameters of the cristobalite phase to relax back to expected values as noted in Table I. Figure 13 also suggests a change in the microstrain magnitude between heating and cooling in terms of the change in FWHM over the 25 °C to 300 °C temperature range. The 35GRND sample shows a possible dependence on heating versus cooling where heating tends to show a smaller differential in FWHM than upon cooling. However, this trend does not appear to be observed for the 35BULK sample. This oscillatory behavior of the FWHM differential is likely tied to the hysteresis behavior observed for the 35GRND sample, whereas the 35BULK sample showed no obvious hysteresis behavior.
Change in FWHM between α phase at 25 °C and β phase at 300 °C. This difference in FWHM can serve as a gauge for the buildup of microstrain in each sample.

To investigate the aspects of microstrain and macrostrain present within the four samples, profile fitting was performed on the (101) peak in the α phase for all room temperature XRD scans. These scans were the same patterns used for refined lattice parameters reported in Table I (i.e., XRD scans collected using a Siemens D500 instrument). Note that the instrument broadening for the D500 diffractometer differs from the Bruker D8 instrument used to perform the in situ heat treatments, so direct comparison of FWHM values between instruments is not possible, but analysis of trends for the samples collected on the same instrumentation is warranted and provides more insight into the cristobalite in each of the samples. The profile fitting results are given in Figure 14, showing the fitted profile for the Kα1 and Kα2 peaks of each profile, along with the determined FWHM and the skew value of the profile. Figure 14 (upper left) shows the result for the NIST sample. The FWHM of 0.108° is very close to the instrument broadening for the D500 diffractometer. The reported skew of 0.274 indicates a slight low angle preference for the profile, but in general, this result is consistent with a relatively ideal sample in terms of minimized microstrain.
Profile fitting of the room temperature α phase (101) peak for the four different samples in this study. A Pearson VII profile shape with a skew parameter was employed for this modeling.

Comparing the result for the NIST sample in Figure 14 (upper left) to that of the KREMER result (Figure 14, lower left), the KREMER powder shows a slightly increased FWHM of 0.142° and a larger low-angle skew of 0.355, which suggests that the increased FWHM may be correlated to the asymmetric skewing of the profile toward lower angle (higher d-spacing). The asymmetry of the profile might be related to the cooling process when the cristobalite transitions into the tetragonal phase. The skew toward the lower angle suggests that at room temperature the distribution of (101) interplanar spacings is weighted more toward an expanded structure. This, in turn, can be tied to the idea that the cristobalite in the KREMER powder may not be an idealized and uniform unit cell, but represents a distribution of lattice parameters that may lean in the direction of the larger cell values due to the origin of its synthesis and cooling from the β phase. The fitted profile for the 35BULK sample (Figure 14, upper right) shows a similar skew value (0.340) to that of the KREMER powder but shows a slightly larger FWHM value. Note that the obvious shift of the peak to lower 2θ angles is consistent with the restraining nature of the glass matrix, which hinders the cristobalite from contracting to the expected room temperature d-spacing. What is most informative concerning these four samples is the result for the 35GRND profile shown in Figure 14 (lower right). This peak is very broad, with a reported FWHM of 0.250° but most notably a skew value of 0.607, which is nearly double that of the other reported samples. This very large skew suggests an even greater asymmetric distribution of lattice parameters for the α cristobalite for the case of the 35GRND sample. As noted in Table I, grinding does enable the cristobalite in the glass matrix to release and contract back to an expected unit cell; however, the observed profile shape for this 35GRND (101) peak suggests that there still remains a large fraction of cristobalite crystallites that are restrained to various larger cell dimensions, creating a significant asymmetric skewing of the profile shape. Therefore, while grinding does release some of the cristobalite crystallites completely, those crystallites that remain in contact with the glass may still be constrained by this matrix phase, resulting in the long tail skewed to higher d-spacing. This result gives further support to the idea that the matrix plays a critical role in controlling cell dimensions by placing a constraining force on cristobalite as it is heated/cooled, and that cristobalite in such a bulk matrix solid displays a complete loss of hysteresis behavior and shift of the overall transition temperature. With this better understanding concerning the effects of the glass matrix on cristobalite, the observation of XRD profile broadening may be a combination of two factors: (1) microstrain due to transition from β cubic to α tetragonal phase and (2) profile broadening resulting from varying lattice parameters for different cristobalite grains due to the effects of tensile strain. The former would likely result in uniform peak broadening, whereas the latter would manifest the asymmetric skewing of the profile shape. With this reasoning, the asymmetric nature of the peak shapes observed in Figure 14 is not indicative of a conventional microstrain broadening per se, but would better be thought of as a biased distribution of cristobalite unit cells, favoring those of a larger cell dimension.
IV. CONCLUSION
Results support the hypothesis that strain effects are responsible for the observed differences in XRD peak locations for pure cristobalite versus cristobalite present within a glass matrix. For the bulk cristobalite/glass composite sample (35BULK), the presence of a glass matrix surrounding cristobalite crystallites during the initial thermal processing of the composite leads to the development of tensile macrostrain at the cristobalite/glass interface. The existence of this tensile strain manifests as a corresponding 2θ peak shift in room temperature XRD patterns relative to the expected diffraction peak locations. This tensile macrostrain can be reduced via grinding, resulting in a 2θ peak shift back to expected locations for the cristobalite phase in the glass matrix (35GRND). The fact that grinding enables the release of the cristobalite to contract back to expected room temperature lattice parameters indicates that a compositional variation for cristobalite is not a major factor affecting the observed 2θ peak shift. Grinding of the 35BULK sample to produce the powder sample 35GRND resulted in XRD profiles with a skewed appearance, indicative of a distribution of unit cell dimensions for cristobalite that favor larger d-spacing values, and suggests the presence of residual unreleased cristobalite in the 35GRND powder. Macrostrain relaxation for 35BULK samples is not observed between room temperature and ~500 °C as indicated by the constant d-spacing values during isothermal hold experiments. This strongly suggests a rigid glassy matrix surrounding the cristobalite grains. The addition of Kremer cristobalite (~8 μm particle size) to the CGI930 glass matrix to form the 35BULK solid samples results in a reduced phase transformation temperature (~195 °C) and a lower volume change through the tetragonal to cubic (α–β) transition. A glass matrix provides a means of generating a tensile isostatic pressure on individual cristobalite crystallites. This tensile macrostrain results in the elimination of the thermal hysteresis behavior for cristobalite, revealing identical phase transformation temperatures during both the heating and cooling of the bulk composite samples.
FUNDING STATEMENT
This work was supported by Sandia National Laboratories, a multimission laboratory managed and operated by National Technology and Engineering Solutions of Sandia, LLC, a wholly owned subsidiary of Honeywell International, Inc., for the U.S. Department of Energy’s National Nuclear Security Administration under contract DE-NA-0003525.
CONFLICTS OF INTEREST
There are no conflicts of interest to disclose.