

1. Introduction
1.1 Perceptual Dialectology
In our daily lives, we encounter speech in almost every minute of our day. By the time we are adults, we are exposed to an enormous amount of speech data that is somehow stored and processed in our brains. Our perceptions about speech originating both close and far away from us offer one approach to these cognitive activities. Following the methods of modern perceptual dialectology (Preston, Reference Preston1989, Reference Preston2004; Niedzielski and Preston, Reference Niedzielski and Preston2000), we can gather information about speech perceptions and map their geographical location. The participants of perceptual dialectology studies were asked to draw areas of speech varieties on maps, assign a label to those speakers, and give examples of their speech. The results of such studies were tabulated to show regions that received the most recognition by the respondents to have a speech variety attached to them (Preston, Reference Preston2010). Interestingly, the studies found that respondents in the United States could not agree where the Southern dialect’s boundaries are, although most of them indicated that such a speech variety is present in their perception. Moreover, in a close analysis of the results of the perceptual maps, Preston notices two opposite notions appearing together: areas speakers assigned a “dialect” according to caricaturistic linguistic features, and large areas unaccounted for by any of the speakers. For the latter, Preston notes, “This space suggests that respondents have no experience with an area, that an area has no caricaturistic linguistic features or stereotypes, or that an area has no popular culture notoriety” (1989:121). The notoriety that certain regions—such as the American South—receive are labeled oftentimes based on the ideas people have about the area’s social, economic, political, and environmental standing (Preston, Reference Preston2010; Gould and White, Reference Gould and White1986). Those labels frequently have little to do with the linguistic repertoire of the speakers, and for the South, they range from “gentlemanly and ‘everyday’ to such negative labels as ‘scratch and claw, hillbilly, damn Yankees, annoyingly nasal’, and ‘spoken mainly by ignorants’” (Preston, Reference Preston2010). The prominence of labels not connected directly with speech gives us an insight into what the speakers reach for when creating perceptual maps: stereotypes.
As shown in the perceptual dialectology research, “local identity is not strong unless the area has some linguistic or other caricature which helps promote such identification” (Preston, Reference Preston1989:118). The stereotype gives us an easy shortcut to access when we are asked about our perceptions of others. This idea is also present in the research done by Diercks (Reference Diercks2002:67) that showed that even if we do not ask respondents for stereotypes, but instead play dialect recordings for them, they still access their preconceived ideas about others to locate and identify speech varieties. In the process, they activate mental maps to serve as the basis for their judgments. The mental map concept explored in depth through the work of Gould and White (Reference Gould and White1986), provided groundwork for areas of perceptual research. Gould and White investigated where people most desire to live in the United States. The mental maps produced showed that for most of the informants, their local area was the most desirable place to live. In addition, the state of California showed up consistently throughout different groups of subjects as a place they would like to live. Desire for both local areas and those quite far from respondents was explained by the process of activation of stereotypes and caricatures (just as described by Preston above) emerging from collapsed ideas about the environmental, social, economic, and political factors pertaining to various places. Interestingly, in the research done by Fought (Reference Fought2002), when Californians were asked about their perceptions of their own state, responses varied greatly.
It seems that California is a state caught between a general aura of desirability and a specific association with negative linguistic stereotypes, and this dual identity can be seen on the perceptual maps of its residents (133).
This phenomenon is also described in Preston (Reference Preston1989) as the “prescriptive orientation” (123) of labels on maps. The prescription oriented labels show us that the caricatures are present not only for the speakers themselves, but their language as well. This way, we can see that the positive stereotype of the speakers does not have to necessarily exclude a caricature of their speech.
Preston (Reference Preston1989) observes that even when the geographical distance between the respondents and the speech areas they indicated was the same, some regions were not indicated similarly. For example, “Canada was mentioned by the Michigan respondents, but not by the western New Yorkers (who live as close to the border)” (Preston, Reference Preston1989:118). This phenomenon was also seen in the work of Gould and White (Reference Gould and White1986:143-146), where children living an equal distance from each other in Sweden and Norway had different perceptions of each other. Swedish children did not have much of a mental map of the bordering Norway, while Norwegian children seemed to have a distinct mental representation of the neighboring area of Sweden. As the research indicates, this perceptual variation occurred mostly as a result of the type of information children receive through schooling and popular media. Further, such variation contributes to the fact that schooling is where shared cultural ideas on the regional or national level are created.
The idea of mental proximity that we create as members of various communities translates into how we perceive speech communities. Although Scandinavian children are geographically close, their perceptions of community are distant and distinct. In the research performed by Kerswill and Williams (Reference Kerswill and Williams2002), informants judged speaking samples to help researchers describe language variation. Their findings reflect the idea that has been seen in the research discussed above: people who are deeply rooted in their community will more readily recognize local speech, indicating a short mental distance between speakers and their location. As the researchers indicate, “It is almost a tautology to say that accents which are familiar to the judge will be better recognised than those which are not... However, the range of factors contributing to familiarity is wide” (Kerswill et al., 2002:200). This research confirms that people care and know more about the places close to them and those they have direct experiences with. The further we travel mentally and geographically, the less perceptions are based on experience and the more they are grounded in information fragments or no information at all.
The ideas presented above bring to the forefront various issues connected to our perceptions. Each documented study sheds new light on the creation and activation of perceptions, contributing insights about dialect boundaries, mental maps, proximity, and stereotypes. At the same time, the findings offer possible explanations for one or some of the issues, not all of them. An approach called linguistics of speech and ideas developing from this theory provide additional opportunities to explore the mechanisms behind our perceptions.
1.2 Linguistics of Speech
The linguistics of speech has its foundation in parole, described by Saussure in the 1900s. As Kretzschmar points out,
The choice of linguistic structure is not inevitable, not ‘natural’ in the sense that it corresponds to an inborn faculty or property of species; it is the nucleus of an argument to create a science of linguistics, one based on a model with particular premises and with a definite arrangement of its variables (2009:38).
Now when we are equipped with technology solutions that Saussure could only dream about, we are capable of investigating speech as a behavior with all its overwhelming frequencies and inherent variation.
Under the linguistics of speech, what people say is the only subject of study. Terms such as “dialect” or “language” are not considered to have any boundaries but instead live on a continuum. Therefore, as Saussure points out, “between dialects and languages there is a difference of quantity, not of nature” (1916:43).
Since then, scientific research in various fields, such as cognitive anthropology, neuroscience, or psychology, have arrived at new solutions and compelling evidence for the explanation of world phenomena. One of those notions is complexity theory, a notion used in physical science to describe the workings of emergent order in non-equilibrium systems. The notion of complex adaptive systems is presented here in opposition to an equilibrium system, which is a closed, low-energy system. As an example of an equilibrium system, we can put a ball into a big bowl, and it will roll around for some time and then rest down on the bottom when the energy is exhausted. The order of the ball’s position has been established, and “it has become a static, low-energy system.” However, “nonequilibrium systems by definition are open, and exchange energy and matter in a dynamic fashion. They very often show order” (Kretzschmar, Reference Kretzschmar2009:178). This can be best illustrated by the example given by Kretzschmar (Reference Kretzschmar2009) of a creation of a whirlpool when a bathtub drains. The whirlpool will be there while the drain remains open and we add water to the tub, which asserts its openness as a system. Also, the self-organizing order that emerges will be there regardless of the circumstances; it does not matter whether it is Monday or Tuesday in Poland or the United States. The whirlpool will be there if there is water in the tub and the drain is open. Moreover, we do not need to stir the water to create the whirlpool. If we provide the conditions required for a complex system to operate, it will behave accordingly.
Moreover, “complex systems, also known as complex adaptive systems, share a number of characteristics besides being open, dynamic, and not at equilibrium” (2009:147). Among those characteristics is the idea that complex systems contain a large number of components, and they show self-organizing emergent order. Thus speech is a perfect example of use for complex system theory as it possesses an immense number of elements—not only the segments of speech categorized by linguists, as for example phonemes, morphemes, words, or sentences, but also the number of speakers inherently variable in their linguistic behavior. However, speakers are agents, so they facilitate the complex system without being a part of it in the same way that pronunciation, words, etc. are in the system. In other words, speech is a kind of tool humans can operate. Speakers are agents who use speech for their own purposes and exercise control bias in what they choose to say, when, and how. Therefore, they are part of the complex system, but not in the same way speech is. Speakers put the speech into motion depending upon what type of control bias they exercise.
The self-organizing emergent order comes from the operation of chance among the elements and interactions between them. We need to take note that the chance here is considered to be a formal idea of randomness. Therefore, random processes happening in the complex adaptive systems result in emergence of patterns and clusters (Kretzschmar, Reference Kretzschmar2009:179).
Now, one more factor needs to be added to the analytical choices that we make, and it is perception. Based on how we perceive speech, we arrive with conclusions about linguistic features, and “thus perception is a necessary element of speech, because without it there could be no linguistic features” (Kretzschmar Reference Kretzschmar2009:46). Taking perception into account opens another explanation of how we can deal with perceptual dialectology under the linguistics of speech:
Since there are no natural dialects, then, the inventories of linguistic features that we collect constitute dialects because we so name them, and they are useful because they help us to conceive of “the primary and natural phenomenon of differentiation into independent areas.”
(2009:48)
Such a statement has its foundation in the notion previously discussed in which the categories that we create do not occur naturally in the world around us, but it is us who create them to comprehend the world. Such a statement leads us to the foundational statement for linguistics of speech, in which the relation between what we know about speech and what we perceive of it is established. Speech is seen as a continuum without boundaries; the boundaries between languages, or in other words linguistic systems, are only a perception of our minds. What is really happening is that from locality to locality people share some linguistic features and differ in others. The further away we are geographically or socially, the less we might have in common when it comes to the linguistic features. However, it will never be the case that speakers on one side of a line will speak in exactly one way and those on the other side differently. The boundaries, or isoglosses, are generalizations created by our perceptions and facilitated by the methodologies used to study speech.
Perceptions are still an important component of our linguistic behavior because they not only constrain our choices in speech, but also reveal how our lack of information is filled with perceptions to create gestalts. Our mind prefers patterns and complete entities. Thus, one of the mechanisms with which it complies with the information received from the world is creating cognitive wholes—gestalts. We are then able to create a perceptual, finite concept out of interrupted and incomplete information. Such a method explains, for example, why we are able to have an opinion about the speech of speakers whom we have never heard or seen before (Kretzschmar, Reference Kretzschmar2009:188). When cognitive anthropology comes to play, Kretzschmar adopts the schema theory into the linguistics of speech approach. Therefore, “schema theory is not about objects with particular, established characteristics (of which an individual is a concrete example, and a prototype is an abstract example), but about abstract specifications for what might be relevant in what comes to be recognized as a category of experience” (Kretzschmar, Reference Kretzschmar2009:188).
This concept, known also as a “frame,” “scene,” “scenario,” or “script,” has been used for a long time; the first mentions of such a thought can be attributed to Kant (1781 [1998]). More recently, Mandler (Reference Mandler1984) described schema as “abstract representations of environmental regularities” (1984:55). Each experience that we gain in our lives leaves a mark and helps to formulate such a schema. Therefore, we recognize the world in the realms of schemas. Gould and White (Reference Gould and White1986:150) showed us that the information that we gain with age behaves in a predictable manner:
Until children are about seven or eight their preference signals are so small that we cannot really detect them against the background noise; but then as sudden flood of information impinges upon them, and the preference surfaces begin to crystallize out of the mental flux. By adulthood the surfaces have set pretty firmly with a high degree of agreement about them.
This relationship may be seen as a base for how our schemas are formulated, especially those cultural schemas that we gain through schooling. Moreover, schema is not only a frame for various types of experiences of our life, but at the same time, it is a mechanism with which we parse and designate to a specific schema all the input of our existence. “Most, if not all, of the activation processes occur automatically and without awareness on the part of the perceiver-comprehended” (Mandler, Reference Mandler1984:56). On top of that, schemas have “slots” for features which can be filled in with concrete detail. The number of slots depends on the speaker and their type of previous experiences, and to some extent the information for one slot can determine the rest of the slots.
Each speaker develops their own individual schemas, but through shared experiences of common culture, as a community, they also develop shared cultural schemas (Kretzschmar, Reference Kretzschmar2009:188). Because both types of schemas are present in the minds of the respondents, when asked about their perceptions about speech, part of the results will be different from the rest, as every individual experience is different. But there will be some overlap, as we do share cultural schemas to some degree. Individual schemas are made out of slots for characteristics out of which a pattern is created. Cultural schemas “‘average’ the ratings by the individuals… except that now… slots for relevant characteristics within schema, are the target for analysis, and not fixed characteristics themselves” (Kretzschmar, Reference Kretzschmar2009:189). Such an approach to the analysis is more flexible than the prototype approach. In any schema, we develop “slots” through our experiences.
For example, through participating in schooling we may develop a schema called “a classroom.” In such a case, we may have slots for “the teacher,” “students,” “seating organization,” “time period,” “recess,” “textbooks,” and so on. Those slots allow us to fill them up with specific information pertaining to a Biology class, as opposed to an English class, as opposed to a Chemistry class. As a result, each experience of that schema will be slightly different, but it will use common slots to organize it, recognize it, and maybe even experience it. When using schemas, we do not always have all the information needed to fill in the slot with a certain feature, so we do need a mechanism to help fill in the gaps. Such a mechanism is described as gestalt, originally used by the Berlin School in psychology in the late 19th and early 20th century. Since then, it has been a part of various disciplines, such as psychology, anthropology, or cognitive science. It also found its way into linguistics, especially cognitive linguistics, in the work of Lakoff (Reference Lakoff1987), Evans and Green (Reference Evans and Green2006), or Grice (Reference Grice1989). The use of gestalt mechanism that is adapted by linguistics of speech is described by Evans and Green (cited in Kretzschmar, Reference Kretzschmar2009) as important “because they allow unconscious perceptual mechanisms to construct wholes or ‘gestalts’ out of incomplete perceptual input” (2009:186).
Gestalt plays an important role in the research conducted on speech perception, since it is a way to account for lack of experience and information to create a definite perception. As explained by Günther (et al., Reference Günther, Levitin, Schapiro and Wagner1996), an observational artifact can be created using the gestalt mechanism, and at the same time it invokes the notion that an object can be created out of ideas or perceptions. In this case, subjects created an observational artifact named “speech variety,” out of incomplete information, based on the scarce linguistic items, and other experiences in the community. In this way “speech variety” becomes an object that can be put on a map, as was seen in the results of the perceptual maps. In this frame of mind we can think of places that have become observational artifacts as multidimensional regions: ”Region is then necessarily a complex multidimensional construct, and the physical and behavioral characteristics of regional culture always exist in a dynamic, self-aware relationship with the perceptions of participants” (Kretzschmar, Reference Kretzschmar2011:190). In this way, we can start to explain how those multidimensional regions are being constructed and how much and what type of input is needed for such a region to appear on a map.
Using the ideas presented above, I will investigate the distribution and emergence of perceptions of speech in Poland created by Polish participants. I will argue that the perceptual, multidimensional regions that appear in “draw-a-map” result from the process of activating gestalt processes to create an observational artifact based mostly on the concept of geography that is facilitated by a shared cultural schema.
2. Methods
In my research, I used Dennis Preston’s “draw-a-map” methodology. Respondents from Preston’s study (1989) were given a map of the U.S. with state boundaries on it and asked to circle areas where people speak in various ways and to add labels to them (Preston, Reference Preston1989). The perceptual map task presented here was a part of a bigger project investigating the speech production and perception of Poznań speech.Footnote 1 I wanted to see if the respondents would perceive the speech of Poznań as distinct from other places; therefore, it was necessary to have the city on the map. As Preston points out, the amount of information provided on the map is crucial to the type of responses that we want to receive. He reports:
[M]any could not escape the notion that state lines were dialect boundaries, a fact which supports the conclusion that nonlinguists' impressions of the position of dialect boundaries are historical-political, not linguistic... Perhaps a map with major rivers, cities, and mountains, would have prevented this sort of response .
(Preston, Reference Preston1989:25)
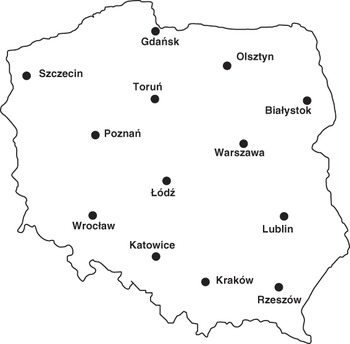
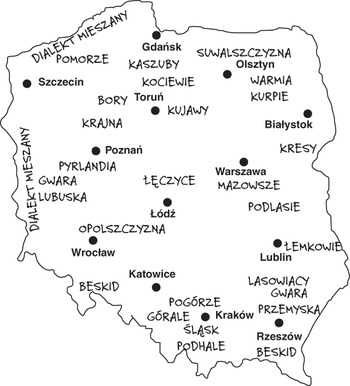
Therefore, I have decided that it might be more useful for the proposed research to indicate cities on the map instead of other administrative divisions. Map 1 displays the map used for the task with 13 major cities used. All of those cities are distributed in a regular pattern across the country.
The map of Poland used for the ‘Perceptual map of Poland’ task.

The maps were black and white for technical reasons; a lot of details would potentially disrupt the comprehension of the task. I wanted to keep a balance by providing enough detail for easy geographical orientation and not obscure it with too much information.
The informant sample was collected by convenience through snowball sampling in 2008. All of the respondents were students at Adam Mickiewicz University in Poznań and had no previous training in linguistics. The respondents filled in a paper version of the task, asking them (following Preston, Reference Preston1989) to circle areas where people speak in various ways and to add labels to them.Footnote 2 This way of conducting and distributing the task proved to be productive as it resulted in 215 completed perceptual maps.
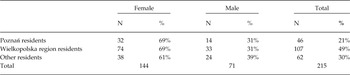
All of the respondents were in the 18-30 age group, and mostly indicated their occupations as students, with the occasional exception those indicating themselves as white collar workers. Moreover, the respondents had the same level of education (high school), as they were all in the process of obtaining a higher education. I did not ask for demographic information of their parents. Thus, out of all the collected categories,Footnote 3 gender and place of birth/upbringing were the only ones that showed variation in the answers. Table 1 shows the distribution of the informants, according to the gender and the place of upbringing.
The perceptual maps respondents.

Once I collected the maps, I processed them so I could observe patterns emerging from my data. First, I scanned the maps. In Adobe Photoshop CS2, I colored the circled areas and erased any other information from the scan. Then, I used the PICtoASCII program, which converts bitmaps into ASCII symbols. This program allows saving such a converted bitmap in a .txt format in which various colors correspond to different symbols, and white space is white space. Then, using the Find and Replace function in Microsoft Word, I inserted tab delimitations in order to be able to open such maps in a Microsoft Excel spreadsheet. I used formulas to count all the symbols in the cells. This way I was able to add all the maps together. This type of formula resulted in a spreadsheet containing numbers distributed in the shape of Poland, in which each number corresponds to the number of respondents who indicated some sort of speech in that particular cell, corresponding to a respective area on the map. This map has been transformed into a 2D graph to show the results.
3. Results
3.1 Speech Perceptions
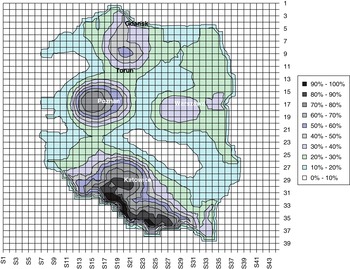
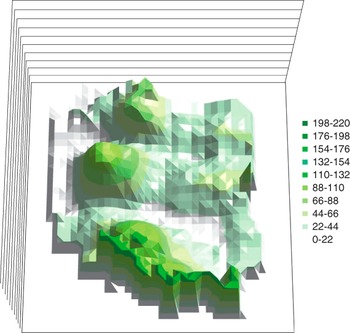
The result map of all of the responses indicating perceptions on the map of Poland is displayed in Map 1.
The darkest areas of the map are where the highest numbers were located, and white areas are where 10% or fewer of the informants indicated anything on the map. We can see that there are four main areas where at least 40% of the subjects circled something on the map; those areas are in the North, South, East, and West of Poland. There is a vast surface around the epicenters with less than 30% of the respondents perceiving any speech variety there. There is a dramatic difference between the little amount of area that many subjects indicated, and a large surface that not many of them agreed upon. It seems that Poznań, in the eyes of the respondents, has a particular type of speech. Another city clearly pointed out is Katowice in the South. Warszawa, although visible in the East, does not receive the same level of agreement as the previous two. In the North, the situation seems to be different. The area specified the most is not around any major city. It may be an indication of a speech pattern present in the area but not strongly associated with the surrounding towns. A similar situation can be observed in the South, where the mountain region of Poland received the most recognition out of all. The most important observation that those perceptual maps show, is that people perceive locations to have speech varieties; however, respondents do not agree where exactly those places are located, indicating that this is more of a mental concept.
3.2 Labels on Perceptual Maps
While the respondents circled the areas on the maps, they also labeled the areas they indicated. When I collected all of the labels from the maps, four semantic categories emerged from the data:
Geographical names, in which the subjects labeled the area according to the name of the region, for example Wielkopolska; or used town/city names, such as Poznań, Kielce; or some other description of the region, as for example góry “mountains,” wschód Polski “East of Poland.”
Names of people, in which informants gave names of groups of people living in an area, very often based on the geographical names, for example poznaniacy “Poznanians,” ślązacy “Silesians”; or gave characteristics describing the people, for example szaleni kierowcy “crazy drivers” (for people in the West), and głupi warszawiacy “stupid Warszawians.” Another strategy was to use nicknames for people living in certain areas, for example pyry, pyrusy, pyrole “potato people” (for people from Poznań), scyzorki “pocket knives” (for people from Kielce), legioniści “legion people” (people from Warszawa, fans of local soccer team named Legia Warszawa “Warszawa legion”).
Dialect labels. All of the instances in which the words dialect, patois, language, or accent were used are included in this group, as were the names for speech varieties, like góralszczyzna “the speech of mountain highlanders” and śląski “Silesian language.”
Features of speech, in which respondents gave a characteristic of the local speech: for example naleciałości z rosyjskiego “influences from Russian” (about east region), zaciąganie “drawl” (about east region).
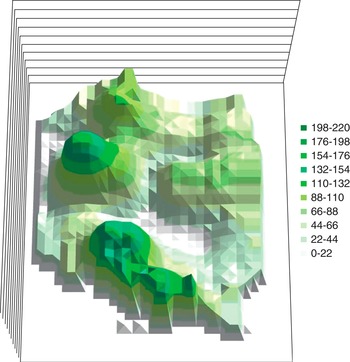
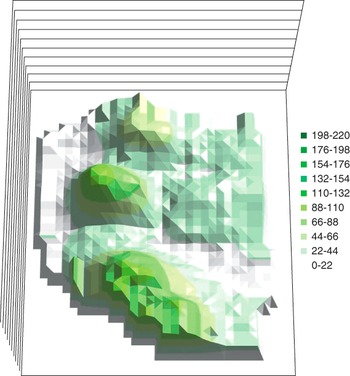
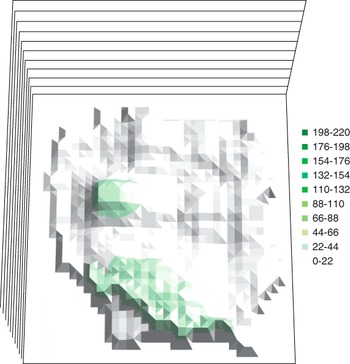
Those four categories provide an insight into the type of perceptions that the respondents have about where, how, and by whom speech is used in Poland. Each of the 215 maps that had some speech perception data on it was separated into as many as four individual spreadsheet maps, each holding only areas labeled by one of the semantic categories. This way I was able to add all maps with the same type of label together. Maps 3 through 6 show those results below.
Total results of perceptions of speech varieties in 2D view with some cities.

Distribution of perceptions labeled in the category of “Names of People”

Distribution of perceptions labeled in the category of “Geographical Names”

Distribution of perceptions labeled in the category of “Dialect Labels”

Distribution of perceptions labeled in the category of “Features of Speech”

First of all, not a single category appeared on all of the 215 maps. The label that appeared on the highest number of maps was the “Names of People” category (on 161 maps), then “Geographical Names” (on 123 maps), “Dialect Labels” (on 107 maps), and “Features of Speech” (on 34 maps). The areas covered by those distributions are similar, but they are not exactly the same. The more frequent categories cover more areas, but all of the peaks for all of the categories correspond to the areas around Poznań and in the mountains in the South. This reinforces the idea that respondents not only perceive those regions as possessing some sort of speech variety, but also reflect it in the highest number of labels.
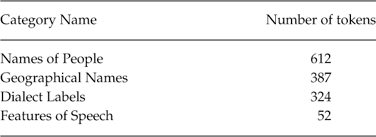
The number of maps that included labels gives us one view, but when we look at the number of tokens for each category, we can see that the first three categories are also overwhelmingly numerous, and the “Features of Speech” category is very small compared to them. We can see the number of tokens for each type of semantic category from all of the 215 maps in Table 2.
Token distribution in each label category on 215 perceptual maps.
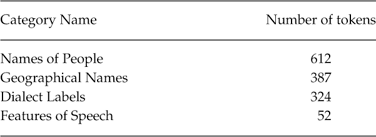
The average number of labels per map is 6.7. This tells us that on average the subjects put 6 or 7 labels on a map, and they must have been from different categories of labels, because none of the category averages came close to 7. The “Names of People” category has an average of 3 labels per map, “Geographical Names” 1.9, “Dialect Labels” 1.5, and “Features of Speech” 0.3. The various ways to describe people and where they live seems to be the most frequent category, pointing to the fact that it might be the most important way to describe a locality. However, as shown by the aerial distribution on the maps, this locality does not have to be physically and correctly connected with a geographical location. It is more of an approximation; the places that we label are more of a mental concept than concrete realities. We will come back to this issue in the later discussion.
Another revealing facet of the way people see others in their speech communities is shown when we look at the combinations of categories of labels occurring together. As we have seen earlier, most of the time respondents put several labels on a single map. Map 7 gives us an example showing a hand-drawn map with several types of labels. Only aggregating and analyzing a number of maps like that shows how those choices were structured, and possibly gives us insight into the way perceptions are organized.
A hand-drawn perceptual map showing multiple labels from “Dialect Labels,” “Geographical Names,” and “Names of People” categories.

First of all, only 5% of the respondents did not use labels, and only 7% put all four categories of labels on their map. We do not know the reasons why some respondents did not label their maps. It might be that they did not have labels to put on, but it might be as well that they did not follow the instructions. The respondents who put all types of labels on the map were not numerous (7%), but they show us that some people can pull together all of the facets of the perceptions that they have. Their behavior indicates how complex our perceptions can be.
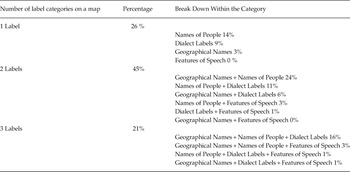
The next group includes all the maps for which only one category of label was chosen. This was the second most popular choice. As the results show us (in Table 3), if we were to put just one type of label on the map, our first choice is most likely to name the people; next, the variety of speech they use; and finally where they are located. Such an order shows us that the non-linguistic features are first to be chosen to show our perception of others.
Label categories distribution.

That leads us to the group of two label categories on a map. This was the most popular choice, as it covers 45% of the maps (see Table 3). Out of those, only 4% take the “Features of Speech” category as a partner. The overwhelming majority is made out of a combination of the first three categories, “Names of People,” “Geographical Names,” and “Dialect Labels.” So, if we were to put more than one type of label on a map, chances are it would be a description of the people living there, and we would add information about where they live, and what to call their speech. However, we would be least likely to point out any linguistic features of their speech, and the linguistic features would not be combined with a geographical name.
The relationship between non-linguistic and linguistic labels is similar in the group consisting of three different label categories appearing together on the map. When people put three different types of labels on the map, the set of the non-linguistic labels covered 16% of data out of the 21% total for this group (see Table 3). The remaining 5% of maps on which linguistic features do appear is divided into the three possible category combinations, each of which occurs at a low level of these; the combinations that include “Dialect Labels” and “Features of Speech” occur at the lowest level.
4. Discussion
When we look at the relationships between the labels that are described in the context of the people’s most frequent choices, we see a disjunction between the “Features of Speech” category and the rest of the categories. Moreover, the relationship between “Geographical Names,” “Dialect Labels,” and “Names of People” is reinforced by the fact that, almost exclusively for the “Names of People” category and exclusively for “Dialect Labels” category, the concept of geography is present within the labels; for example: Kashubians, people from Poznań, or speech of Wielkopolska, dialect of Silesia, language in Warszawa. Therefore, the concept of geography seems conceptually to be the common thread for all the labels, except the linguistically driven “Features of Speech” category. That shows us that it is the concept of geographical names of regions that is the common denominator. However, it seems that geography alone is not enough because we saw that it is not the most frequent label when in isolation; the “Names of People” category was. If we assume, following Niedzielski and Preston (Reference Niedzielski and Preston2000:18), that “the communicative function of language is so strong that it overcomes the ability to give an accurate report of performance whether of self or of others and whether of general or restricted phenomena,” then we can start considering the basis of those stereotypes based on the labels provided by the respondents. This way, we can offer a possible process in which, when a mental concept of a place is created, the ideas of people, and the name of the speech that they use is very important, but the underlying concept of geography is what connects them. It is not to say that the speakers indicate an exact location as the geographical map would tell us. Instead, they are using an approximation of where such a place is located (as discussed above in the research of Gould and White, Reference Gould and White1986). The main purpose is to describe the mental meaning of this place as reflected in the labels. The linguistic features that linguists ask about do not rise to be the main concern of the respondents, and even when they do put them on, they reflect a folk understanding of speech with descriptions such as: they say “Tej” and “nie,” Poznań pronunciations, they sing when they speak, they have a lot of German words (all examples about speech in the Poznań area). Therefore, not only is the linguistic description superficial, but it is also not frequent. On the other hand, what we see is a great emphasis on the geographical cognitive concepts present in the labels in addition to people living there and the names for their speech.
The fact that nobody used linguistic features to stand on their own emphasizes even more that we do not rely primarily on linguistic knowledge in our perceptions. Following Preston’s (Reference Preston2010) assertion mentioned earlier that “nonlinguists seem to be using factors other than the perception of purely linguistic differences,” we can see this in the fact that the linguistic features are not the first thing subjects consider when creating the mental image of a place. They are last. Moreover, the lack of the relationship between the linguistic and geographical features suggests that there is something inherently different about our perceptions of speech and the concept of geography.
This distinction between the linguistic and nonlinguistic foundations leads to one more important point in the quest to describe the way those perceptions were created. As Preston (Reference Preston2010) observes in the U.S. research:
[The] labels suggest that a regard for language correctness is a dominating one… Correctness is not, however, the only theme to emerge. The respondents were clearly distinguishing between correct and pleasant varieties. Language attitude studies confirm, then, that regional varieties are not all equal, and such findings help further establish the basis for another perspective on varieties: an account of what speakers of various regions (and classes, sexes, ethnic groups, age groups, and so on) believe about dialect variety.
This quote suggests that the two dimensions of the labels attached to perceptual maps in the U. S. research have to do with correctness and pleasantness. However, when we look at the labels present on the Polish maps, those dimensions do not seem to be prevalent. Instead, the underlying concept of geography seems to be connecting and influencing the shape of the labels attached to the perceptions. Both the U.S. and Polish data seem to be mostly based on a nonlinguistic basis, but that base seems to be different. The question remains, how then does the process of creating perceptions seem to be similar while at the same time, the basis for those perceptions is so different?
One possible explanation can be found in the approach presented by Kretzschmar (Reference Kretzschmar2009), which suggests that the results indicated that people did not keep information about language separate from non-linguistic information: linguistic and non-linguistic schemas that overlap arise because a majority of individual speakers are participating in a shared culture. Each experience that we gain in our lives leaves a mark and helps to formulate such a schema. Therefore, we recognize the world in the realm of schemas. Schemas are “organized frameworks of objects and relations which has yet to be filled in with concrete detail” (D’Andrade, Reference D’Andrade1995:124). With that said, throughout our lives, we experience the world in many dimensions, and through those experiences patterns emerge, in which we organize and categorize the world. With time, we create schemas that provide us with structure of slots that we can fill in with individual pieces of information. Moreover, schema creation and processing is not only a framework for various types of experiences of our lives, but at the same time it is a mechanism with which we parse and designate to a specific schema all the input of our existence (D’Andrade, Reference D’Andrade1995:122). The highest frequency labels associated with the cultural schemas present on the map of Polish speech varieties suggest that what people know about speech is not based on linguistic knowledge. Instead, the concept of geography, likely gained in school, or more generally through living in Poland, is the most common concept evoked when “speech variety” schema is triggered.
This observation opens the door for an interpretation in which subjects created schemas for the labeling of speech varieties using geographical knowledge, as their awareness of linguistic details was scarce or nonexistent. However, the issue of very limited input needed to create a schema of “Poznań speech” can be explained by the use of gestalt mechanisms based on the low frequency linguistic items present on the perceptual maps. When a schema is invoked, it is then perceived as an observational artifact of “Poznań speech.” In such an observational artifact of “Poznań speech” the assumption is that there must also exist speakers, location, vocabulary, and other items. Therefore, it only takes a label or two to indicate it on a map, and possibly it only takes a word or two of those considered to be Poznań-specific uttered by a speaker for that person to be perceived by others as belonging to the group of “Poznań speakers.” The types of labels found on the maps suggest that the concept of geography is enough to create an observational artifact that can also be seen as a multidimensional region (Kretzschmar, Reference Kretzschmar2011).
In such a region, geography seems to be reflected in the labels as the common denominator. However, it is not enough. People do not pinpoint geographical locations exactly, because people care about their local surroundings much more than anywhere else, and they do not have a comprehensive knowledge about places far away (Kretzschmar, Reference Kretzschmar2009, Reference Kretzschmar2011). Moreover, “A region is not merely some arbitrary tract of geography, but instead a location in time and space in which people behave in some particular way, and in which we may find physical evidence related to that behavior” (Kretzschmar, Reference Kretzschmar2011:187). In this light, we can see Poznań or any other location that became an observational artifact to be such a region, in which we have people, location, and their speech intermingled. Labels that people assign to the observational artifact created for those regions show that what we care about is where people are from, since the majority of the labels employ the concept of geography. Therefore, the location or the region is what we care about the most and what shows up the most on the perceptual maps. This idea shows in contrast to Preston’s (Reference Preston2010) U.S. findings, where the idea of correctness and pleasantness of speech seemed to be more important as the basis for the creation of schema. Within the concept of region we can see “the necessity for merged geographical/social categories like region, because putting location and other information together is the only way to achieve coherence, by imposing order on apparently miscellaneous perceptions” (Kretzschmar, Reference Kretzschmar2011:193-194). Thus, the idea of folding the geographical and social information into one and putting it on the map seems to explain why the majority of labels are associated with those concepts and not linguistic features. We have seen that two out of the four highest levels of agreement about speech perceptions were located around a specific point on the map—Poznań or Warszawa. Heaving those cities on the map definitely helped to anchor the observational artifact on the map. However, in the two other observational artifacts present on the perceptual maps, in the South and North of Poland, there is no city to attach the artifact to. Instead, for the South, the area indicated seems to show that people are not really sure where the highlanders do live, but they live “somewhere in the South.” The same situation is evident in the North in connection to the Kashubian speech. The region itself is designated in various ways by the people living there, speaking the language, and performing research on the language. That lack of sharply-defined boundaries of the region is also evident in the distribution of the perceptions. Many of the respondents know about it and have a general location in the North for this speech variety, but they do not know “exactly” where it is. People just do not have enough information to give us a comprehensive description of features of speech varieties in a country. Instead, the common denominator that might be the easiest to reach for is a geographical concept in the form of a region. Such a region does not have to be based on an abundance of information, because speakers can activate the gestalt mechanism to fill in the gaps. The product of such a process is a multidimensional region in the form of an observational artifact to be readily drawn on a map.
Therefore, perceptions about speech end up not being solely about what and how we speak, but more about who and where we are. The research presented above points to the intricacies of how we create our mental maps of speech varieties. Our experiences with the world beyond speech largely determine how we recreate the world around us. This observation accounts for our ability to generate ideas about people and places spatially far away from us out of “thin air,” without requiring any informational or experiential input. Using tools from perceptual dialectology, linguistics of speech, cognitive linguistics, and linguistic geography, we can investigate the web of connections that speakers develop to create mental maps of their worlds. By utilizing the expertise from the aforementioned research, we can start building a methodology that can accommodate the complicated workings of human perception. Once we can better describe perception and how it works, we might be able to use perception to investigate the connection between speech perception and speech production. Links between perception and production might in turn reveal how much our perception influences the production of our speech and how much the research on speech production has been reflecting perceptions of respondents.