Introduction
There is a vast literature on the statistical analysis of human growth curves. The earliest work in this area concentrated on the formulation of parametric growth models, with Jenss, Bayley, Preece, Baines, Count and Gompertz being prominent contributors. These models are designed to capture known features of growth and development (such as the mid-childhood growth spurt) and have reached a high degree of sophistication with broad applications.Reference Dasgupta and Hauspie 1 , Reference Sumiya, Tashima, Nakahara and Shohoji 2 For example, such models have been used in searches for quantitative trait loci that control the key features of human growth trajectories.Reference Li, Das and Wu 3
The purpose of this article is to propose various new nonparametric modeling approaches that can bring greater flexibility, as well as ease of implementation, to the analysis of growth trajectories based on sparse data. Our emphasis is on methods that are suited for the study of prenatal or early childhood development, in which large fluctuations in growth velocity and high variability between subjects are not easily handled by parametric models. Despite a resurgent interest in the analysis of human growth trajectories, current statistical methods are limited by an overreliance on parametric modeling and are only capable of examining each variable separately, or require computationally intensive methods that are unsuitable for exploratory analyses. Repeated measurements of length, weight, body mass index and head circumference, for example, may be available on most subjects in a study, but usually only sparse temporal sampling of such variables is feasible. It can thus be challenging to gain a detailed understanding of growth patterns, and smoothing techniques are inevitably needed. Moreover, the problem is exacerbated by the presence of large fluctuations in growth velocity during early infancy, and high variability between subjects.
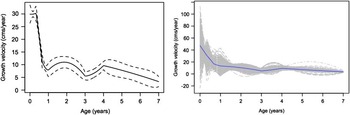
We propose a nonparametric Bayesian methodReference López-Pintado and McKeague 4 for reconstructing growth velocity curves from sparse temporal data (or repeated measures) on a single variable. Figure 1 illustrates this method as applied to length measurements in a sample of 532 girls who participated in the Collaborative Perinatal Project (CPP; see ‘Application to CPP data’ section for further details). The left panel shows the reconstructed growth velocity curve (along with error bounds) of a specific individual, and the right panel replicates this for the whole sample. A key advantage of this method over existing approaches is that error bounds are included in the reconstruction. A version of data depth that is suitable for visualizing functional dataReference López-Pintado and Romo 5 is also discussed; the right panel of Fig. 1 highlights the deepest growth velocity curve in the sample and can be interpreted as a functional equivalent of the sample median.
The left panel shows the reconstruction of an individual growth velocity curve (solid line) with error bounds (dashed lines); the right panel shows the reconstructed growth velocity curves for all individuals in the sample with the deepest curve highlighted.

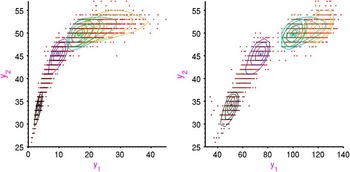
In addition, we propose a method for visualizing patterns in the growth trajectories of multiple variables. Commonly used growth charts produce plots of univariate quantile curves, but such plots clearly omit all information related to dependencies between the various measurements under study. This is potentially misleading, as growth charts are often used as a diagnostic tool for detecting possible outliers, whereas a multivariate outlier clearly need not be an outlier from a marginal point of view, and vice versa. To address this problem, we introduce a method based on Tukey's notion of halfspace data depth,Reference Hallin, Lu, Paindaveine and Šiman 6 leading to the construction of flexible multiple-output growth charts, see, for example, Fig. 5.
Growth velocities
Nonparametric frequentist approaches to the analysis of growth trajectories have been extensively studied in the setting of functional data analysis.Reference Ferraty and Vieu 7 , Reference Ramsay and Silverman 8 In particular, functional principal components analysis is used when it is of interest to estimate the ‘dominant modes of variation’ of a sample of trajectories. Typically, however, a crucial first step is needed before such analyses are possible: the trajectories need to be reconstructed on a fine grid of equally spaced time points. Methods for reconstructing trajectories in this way have been studied using kernel smoothing,Reference Ferraty and Vieu 7 smoothing splines,Reference Ramsay and Silverman 8 local linear smoothing,Reference Hall, Müller and Wang 9 mixed effects modelsReference James, Hastie and Sugar 10 , Reference Rice and Wu 11 and principal components analysis through conditional expectations.Reference Yao, Müller and Wang 12 , Reference Yao, Müller and Wang 13
In many settings involving functional data, the gradients of the trajectories (i.e. growth velocities) are of central interest, rather than the trajectories themselves, especially when dynamical effects are concerned. Difference quotients between observation times can be used to generate simple approximate gradients, but these estimates are piecewise constant and would not be suitable for use in functional data analysis unless the observation times are dense. In the case of regularly spaced observation times, spline smoothing to approximate the gradient of the trajectory over a fine grid is recommended.Reference Ramsay and Silverman 8 More generally, methods of numerical differentiation, including spline smoothing, are an integral part of the extensive literature on ill-posed inverse problems for linear operator equations. In this literature, the observation times are usually viewed as becoming dense (for the purpose of showing convergence);Reference Kirsch 14 in particular, the assumption of asymptotically dense observation times plays a key role in the study of penalized least squares estimation and cross-validation.Reference Nashed and Wahba 15 , Reference Wahba 16
Growth velocities can be reconstructed given sparse and irregularly spaced observation times (one observation time per trajectory is even enough) by borrowing strength between the trajectories in the data set. For such sparse observations, it has been shown that the best linear predictor of the gradient can be estimated in terms of estimated principal component scores, assuming Gaussian trajectories and that the pooled observation times become dense.Reference Liu and Müller 17 A disadvantage of this approach, however, is that data at the individual level play a relatively minor role in the reconstruction, and its accuracy depends on how well each individual gradient can be represented in terms of a small number of estimated principal component functions (this in turn would require an accurate estimate of the covariance kernel of the trajectories, an unlikely scenario in the case of sparse observation times).
López-Pintado and McKeagueReference López-Pintado and McKeague 4 , Reference López-Pintado and McKeague 18 recently developed a flexible Bayesian approach to reconstructing growth velocities from sparse data, as outlined in the next section. Their approach is designed to adapt to observation times that are both sparse and irregularly spaced, and which can vary across subjects. The observation times are allowed to be arbitrary, as long as they include the endpoints of the time interval (so interpolation is possible). The prior distribution for the growth velocity is specified by a multivariate normal distribution at the observation times, and a tied-down Brownian motion between the observation times. This leads to an explicit representation of the posterior distribution in a way that exactly reproduces the data at the observation times. The empirical Bayes approach is then used to estimate the hyperparameters in the prior, borrowing strength between subjects, but in a simpler manner than estimating principal component scores.Reference Liu and Müller 17 An important aspect of this approach is that reconstructed gradients can be computed rapidly over a fine grid, and then used directly as input into existing software, without the need for sophisticated smoothing techniques. Furthermore, a comparison of the results from repeated draws from the posterior distribution (multiple imputation) provides an easy way of assessing uncertainty in the conclusions (of standard functional data analyses) due to data sparsity.
The empirical Bayes approach is well developed for reconstructing individual growth velocity curves from parametric growth models.Reference Shohoji, Kanefuji, Sumiya and Qin 19 A nonparametric Bayesian growth curve model has been developed for testing for differences in growth patterns between groups of individuals.Reference Barry 20 In addition, a nonparametric hierarchical-Bayesian growth curve model for reconstructing individual growth curves is available, but requires the use of computationally intensive Markov chain Monte Carlo methods.Reference Arjas, Liu and Maglaperidze 21
Bayesian reconstruction
We first consider how to reconstruct a growth velocity curve for a single subject. The observation times will typically vary slightly across the sample, but will be clustered around certain nominal ages (e.g. birth, 4 months, 8 months, 1 year, etc.). Let the observation times for the specific individual be 0 = t 1 < t 2 < ⋯ < tp = T, and assume that the endpoints of the time interval over which the reconstruction is needed are included. Letting the subject's growth velocity at age t be X(t), the statistical problem is to estimate the growth velocity curve X = {X(t), 0 ⩽ t ⩽ T} from data on its integral over the gaps between the observation times. Reconstructing X based on such data is an ill-posed inverse problem in the sense that no unique solution exists, and thus some type of external information or constraint (i.e. regularization) is needed to produce a unique solution.Reference Kirsch 14
The difference quotient estimate of X(t) in the interval between the ith and (i + 1)th observation times is given by

where Δ
i
is the length of the interval. Higher-order difference estimates are produced by taking into account the proximity to neighboring observation times, say replacing yi
by the weighted estimate  , where wi
= Δ
i
/(Δ
i
−1 + Δ
i
) for i = 2, …, p−1. Neither of these estimates borrow strength from other trajectories in the sample, but they provide the building blocks of empirical Bayes estimators that take advantage of the whole sample, as we now explain.
In the Bayesian approach to ill-posed inverse problems, regularization takes the form of specifying a prior distribution on X. It is desirable to make the prior flexible enough to cover a broad range of growth velocity patterns, yet simple enough that it is tractable to find the posterior distribution without the need for computationally intensive methods. López-Pintado and McKeagueReference López-Pintado and McKeague
4
showed that this can be done using the following hierarchical prior: (1) at the observation times, X = (X(t
1), …, X(tp
))′ has a p-dimensional normal distribution with mean  and non-singular covariance matrix Σ
0 and (2) the conditional distribution of X given X is a tied-down Brownian motion with given infinitesimal variance σ
2 > 0. Allowing an arbitrary (multivariate normal) prior at the observation times provides flexibility that would not be possible using a Brownian motion prior for the whole of X. In addition, the availability of data at these time points makes it possible to specify the hyperparameters in the multivariate normal (as we discuss below), which is crucial for practical implementation of our approach.
The posterior mean of X takes the computationally tractable form of a quadratic spline with knots at the observation times:

for t belonging to the interval between the ith and (i + 1)th observation times. Integration shows that  exactly reproduces the data. Here
 is the ith component of the posterior mean of X, given by
 where
 ,

and

The posterior distribution is Gaussian, with a covariance kernel (not depending on Y) that takes a similarly tractable form as the mean.
The posterior mean  can be used for reconstructing the unobserved growth velocity X(t), provided various hyperparameters are specified in advance: the prior mean
 and prior precision matrix
 . This is done via a nonparametric empirical Bayes approach applied to the full sample of trajectories, initially treated as having identical sets of (nominal) observation times. The sample mean of Y is used to specify
 . A constrained ℓ
1 minimization method of sparse precision matrix estimation (clime)Reference Cai, Liu and Luo
22
is applied to the (singular) sample covariance matrix of Y to specify
 . By restricting the resulting posterior covariance kernel and mean to the actual observation times for a given subject, we obtain suitable hyperparameters across the whole sample that adjust for any changes from the nominal observation times.Reference López-Pintado and McKeague
4
The infinitesimal standard deviation σ is a smoothing parameter (playing the role of a time-scale), and can be selected using a type of cross-validation based on the prediction error from leaving out an interior observation time.Reference López-Pintado and McKeague
4
We have found that  is relatively insensitive to σ. On the other hand, the width of credible intervals around
 is roughly proportional to σ. In practice, insight into an appropriate choice of σ can also be gained through inspecting plots of
 , say for values σ in the range 1–3 for the height data (as suggested by cross-validation), and it is worthwhile to include pointwise 95% credible intervals around
 as a way of assessing the uncertainty in the reconstruction (see Fig. 3 for examples).
An R package ‘growthrate’ implementing this reconstruction method has been developed by López-Pintado and McKeague.Reference López-Pintado and McKeague 18 The package includes the data set and examples of the code used to compute the reconstructed growth velocity curves displayed in this article, and is available on the CRAN archive. 23
Functional data depth
Given a sample of reconstructed growth velocity curves, it is of interest to look for ‘outlying’ patterns of growth. One way to do this is to use the notion of functional data depth recently developed by López-Pintado and Romo,Reference López-Pintado and Romo 5 with the aim of introducing robust methods into functional data analysis. Robust methods are even more relevant in a functional setting than in multivariate problems because outliers can affect functional statistics in more ways and they can be more difficult to detect. For instance, a curve could be an ‘outlier’ without having any unusually large value. This notion of depth is particularly convenient for identifying outliers because shape is also relevant in addition to magnitude. Direct generalization of multivariate depth (discussed in ‘Growth charts and statistical depth’ section) to functional data often leads to either depths that are computationally intractable or depths that do not take into account some natural properties of the functions, such as shape.
Let x
1(t), …, xn
(t) be a sample of real-valued functions defined on the time interval [0, T]. The band delimited by these curves is the set of points (t, y) such that xi
(t) ⩽ y ⩽ xj
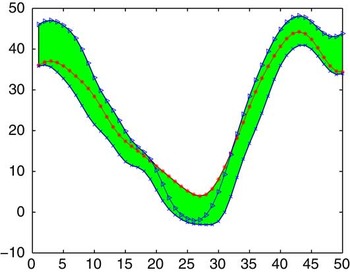
(t) for some i, j = 1, …, n. An example for the case of n = 3 curves is provided in Fig. 2. The band depth of a function x(t) is then defined as  , where J ⩾ 2 is fixed, and pj
is the proportion of bands that contain the graph of x among the bands derived from j curves in the sample. In the sequel, we use band depth with J = 3, which is recommendedReference López-Pintado and Romo
5
for several reasons: (1) when J is larger than 3, the index Dn
,
J
can be computationally intensive; (2) bands corresponding to large values of J do not resemble the shape of any of the curves from the sample; (3) the band depth-induced order is very stable in J; and (4) the band depth with J = 2 is the easiest to compute, but if two curves cross, the band delimited by them is degenerate at a point and it is unlikely that any other curve will be inside this band.
A band determined by three curves (the shaded region), as used in the definition of functional data depth.

Growth charts and statistical depth
In this section, we discuss the use of statistical depth for analyzing multiple growth variables (e.g. head circumference, weight and height) at fixed ages (in contrast to single variables at multiple ages, as studied in the ‘Functional data depth’ section). Statistical depth was first considered for multivariate data to generalize order statistics, ranks and medians to higher dimensions. Given a probability distribution P on k-dimensional Euclidean space, the depth of a k-vector x represents the probability that a random draw from P is ‘more of an outlier’ than x. Various definitions of multivariate depth have been proposed and analyzed.Reference Mahalanobis 24 – Reference Zuo and Serfling 29 The notion has been applied, for instance, as an attempt to extend rank tests to a multivariate context,Reference Liu and Singh 30 in control charts for multivariate processes,Reference Liu 31 confidence regions,Reference Yeh and Singh 32 regressionReference Rousseeuw and Leroy 33 and for visualizing sample dispersion.Reference Liu, Parelius and Singh 34
Our discussion of multiple-output growth charts involves Tukey's notion of halfspace depth,Reference Tukey
25
which is defined as follows. Consider all hyperplanes Π running through x: each Π divides  into two closed halfspaces, with probabilities
 and
 , respectively. Putting
 , select the hyperplane Π*, say, for which that probability P
Π reaches a minimum: that minimum is called the halfspace depth
 of x with respect to P.
The collection of all points x with given halfspace depth d P (x) is called a depth contour. An empirical version of this definition leads to the construction of empirical depth contours. Similar to their population counterparts, empirical depth contours have the attractive geometric property that they enclose nested, convex sets. In addition, empirical depth contours are polytopes, each face of which runs through exactly k sample points (when generated from a continuous distribution P). For k = 1, depth contours reduce to pairs of quantiles of complementary order, τ and 1−τ, where 0 < τ < 1.
Quantile contours
The collection of empirical depth contours provides an interesting picture of the sample at hand, and a powerful data-analytical tool. Unfortunately, however, effective computation of depth contours was based, until recently, on algorithms with prohibitive complexity as k grows, and hardly implementable beyond k = 2 or 3 (although approximate methods are availableReference Zuo 35 – Reference Kong and Mizera 37 ).
Hallin et al. Reference Hallin, Paindaveine and Šiman 38 recently established a strong connection between halfspace depth and regression quantiles. That connection has two important benefits: a quantile-based interpretation of depth contours, and, perhaps even more importantly, bringing the power of linear programming techniques to the practical computation of empirical contours. Moreover, that connection also opens the way to a tractable definition of (multiple output) regression depth, and depth-based multiple-output growth charts.
First recall that the classical quantile of order τ, in a univariate sample X
1, …, Xn
, can be defined as a minimizer of  over
 , where ρτ
(x) = x(τ−I[x < 0]) is the check function, and I is the indicator function; in the case τ = 1/2, note that ρτ
(x) = |x|/2. This definition of quantiles naturally extends to a k-dimensional sample X
1, …, X
n
, with the empirical quantile hyperplane of order τ defined as a hyperplane
 that minimizes, over
 , the sum

of vertical weighted deviations, with the kth component representing the vertical direction. Now, choose an arbitrary unit vector u∈Sk
−1, the unit sphere in  , and consider it as the ‘vertical’ direction: the ‘vertical’ component of a vector X is then (u′X)u and, denoting by Γu
a k × (k−1) matrix of column unit vectors such that (u, Γu
) constitutes an orthonormal basis of
 , we have
 . Letting
 = τ
u, the directional empirical quantile hyperplane of order τ for direction
u is obtained as in the above display, but with u characterizing the vertical direction, yielding a hyperplane
 minimizing, over
 , the sum

of weighted deviations along direction u, with weights (1−τ) or τ according as X i lies above or below the hyperplane. Fixed-τ collections of Π τ u hyperplanes define polyhedral empirical quantile contours of order τ by means of the intersections of upper halfspaces corresponding to all the quantile hyperplanes of the same quantile level τ. Population versions are obtained in the same way, with sums replaced by mathematical expectations.
Quantile contours can be easily computed by parametric linear programming methods that can handle even samples up to size 500 and dimension k = 5; see Paindaveine and Šiman.Reference Paindaveine and Šiman 39 The main finding in Hallin et al. Reference Hallin, Paindaveine and Šiman 38 is that halfspace depth contours and quantile contours actually coincide. As a consequence, quantile contours inherit the geometric features of depth contours mentioned earlier, benefit from the interpretation and the analytical features of quantiles and allow linear programming numerical implementation. Another benefit is the possibility of reconstructing conditional depth/quantile contours via local methods – providing a convincing definition of (multiple output) regression depth contours and paving the way for the construction of multiple-output growth charts, as explained in the ‘Multiple-output growth charts’ section.
Multiple-output growth charts
Growth charts are expected to describe the distributions of selected body measurements in children, as a function of age. That description takes the form of a plot of quantiles against age. Existing methods are usually limited to producing marginal growth charts, that is, plots of univariate quantile curves. Such plots clearly omit all information related with dependencies between the various measurements under study. This is regrettable, as growth charts are often used as a diagnostic tool for detecting possible outliers, whereas a multivariate outlier clearly need not be an outlier from a marginal point of view, and vice versa. A semiparametric approach to multiple-output growth charts has been studied by Wei.Reference Wei 40
The local methods described in a preprint of Hallin et al.
Reference Hallin, Lu, Paindaveine and Šiman
6
allow for nonparametric multiple-output growth charts, hence a joint inspection of several measurements as a function of age. Let (ti
, X
i
), i = 1, …, n, be a random sample of k-dimensional growth measurements X
i
, along with the age ti
at which each observation was made. We are interested in using these data to infer the depth/quantile contours of X at a given age t
0 (which may not be among the observation times). The local constant method consists in computing the weighted depth/quantile hyperplanes  minimizing, over
 , the sum

with u ranging over the unit sphere Sk −1; the weights are of the type considered in traditional kernel methods: wi (t 0) = K((ti −t 0)/h)/h for some univariate density K and bandwidth h > 0. For any given t 0, this method yields a collection of nested ‘horizontal’ cylinders (with respect to the t-axis), the intersection of which with the hyperplane t = t 0 provides a reconstruction of the depth/quantile contours of X at age t 0; such an intersection is called a t 0-cut (see Fig. 5 for examples). These cuts can be obtained exactly by means of the algorithm and Matlab code presented in Paindaveine and Šiman.Reference Paindaveine and Šiman 39
Application to CPP data
In this section, we present some examples to illustrate the methods we have introduced. All the examples use data collected from participants in the CPP from examinations at the (nominal) ages of birth, 4, 8 and 12 months, and 3, 4 and 7 years. Here, by the ‘nominal’ age we mean the targeted age of the measurement; the actual age of the measurement varies around the nominal age.
Example 1: growth velocity curves
In our first example, we use the following inclusion criteria: female, birth weight 1800–4000 g, gestational age 37–42 weeks, non-breast-fed, maternal age 20–40 years, the mother did not smoke during pregnancy, complete data on length and actual examination age and increasing length measurements with age of examination (about 1% of the subjects were excluded under this criterion). This results in a data set of p = 7 height measurements on each of n = 532 subjects. As mentioned in the ‘Growth velocities’ section, this data set is provided in the R package growthrate,Reference López-Pintado and McKeague 18 which also includes the code used to produce the growth velocity curves displayed above.
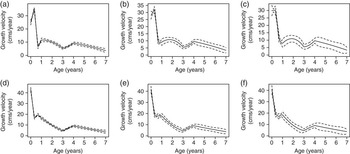
Figure 3 gives the reconstructed growth velocity curves (of length) for two subjects, and for three choices of σ. The choice σ = 1 produces very tight bands, which may be unrealistic because the growth rate is unlikely to have sharp bends at the observation times; the more conservative choices σ = 2 and 3 allow enough flexibility in this regard and appear to be more reasonable. Note that the σ = 2 and σ = 3 bands bulge between observation times (and this is especially noticeable in the last observation time interval), which is a desirable feature as we would expect greater precision in the estimates close to the observation times.
Reconstructed growth velocity curves for two subjects in Example 1; posterior mean  (solid line), pointwise 95% credible intervals (dashed lines) based on σ = 1, 2, 3 in (a,d), (b,e) and (c,f), respectively; for one subject in (a,b,c), and a second subject in (d,e,f).

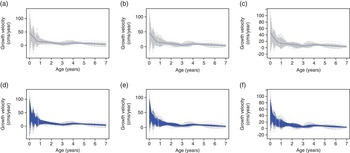
Figure 4 is based on the notion of band depth defined at the end of the ‘Growth velocities’ section, which allows the ordering of a sample of curves from the center outwards and consequently to define the middle 50% of curves, generalizing the notion of the classical boxplot to functional data. An R package ‘fbplot’ for computing functional boxplots has been developed by Sun and Genton.Reference Sun and Genton 41 Such plots provide a useful diagnostic tool for detecting unusual patterns in the shape of individual growth velocity curves. In addition, the information provided by data depth could be used to create a variable describing the extent to which a subject has an unusual growth pattern, and used for predicting adult health outcomes. For example, regressing IQ at age 7 on the indicator ‘not in the deepest 50%’ and adjusting for various other covariates (birth weight, birth length and gestational age) suggests that an unusual growth pattern is (negatively) associated with IQ (data not shown).
Reconstructed growth velocity curves for the whole sample in Example 1 based on σ = 1, 2, 3 in (a,d), (b,e) and (c,f), respectively; the dark line in (a,b,c) is the deepest curve, and the dark bands in (d,e,f) are functional boxplots (representing the deepest 50% of the curves).

Example 2: bivariate growth charts
This example is based on CPP data for 1775 girls from the Boston site, restricted to subjects having complete data on length, weight and head circumference. The monotonicity of length and head circumference as functions of age was violated (by more than 4 cm for length, and 3 cm for head circumference) by 12 individuals; those 12 highly suspicious observations were excluded, which still left n = 1268 complete records for the analysis.
Figure 5 displays the multiple-output growth charts described earlier. The two plots show the bivariate t 0-cuts of the growth trajectories of weight (kg) and head circumference (cm), and length (cm) and head circumference (cm), at five equispaced ages between birth and 7 years. Head circumference is on the vertical axis in each plot. Clearly, there is a much higher correlation between the pairs of variables at earlier ages than at later ages, especially in the left panel. These plots provide a useful diagnostic tool for detecting unusual patterns of growth in combinations of variables, and this might not be noticed in standard growth charts that examine each variable separately. For example, these pictures illustrate age dependence of both the correlation structure and the ratios of the plotted characteristics that could not be detected from the marginal univariate growth charts. The two plots also clearly show that marginal outliers need not be multivariate outliers and vice versa. Consequently, bivariate growth charts would rightly diagnose some children with small head circumference and small length or weight as normal even when the univariate growth charts indicated the contrary. Needless to say, depth contours could be constructed for any age, for example, for the reference ages or for the age of a child under particular investigation.
Estimated age-specific depth contours (cuts) in Example 2 for [left panel] head circumference (y 2) and weight (y 1), and [right panel] head circumference (y 2) and length (y 1), at equispaced ages t 0 = 0 (birth; black), 1.75 (blue), 3.5 (green), 5.25 (cyan) and 7 (yellow) years. Observations are shown by dots (darker for younger subjects, lighter for older ones).

Conclusion
We have proposed various new nonparametric methods for the analysis of growth trajectories, bringing greater flexibility and ease of implementation in existing approaches. For the CPP data set, these methods can lead to interesting findings about early childhood growth patterns. First, we reconstructed growth velocity curves using an empirical Bayes technique that adapts to data sparsity and gives a way of assessing uncertainty in the reconstruction. Second, we discussed the use of functional data depth and functional boxplots that provide useful diagnostic tools for detecting unusual patterns in growth trajectories. Finally, using regression quantiles and Tukey's notion of data depth, we proposed flexible and robust growth charts for multiple variables.
Acknowledgments
The research of Ian McKeague was supported partly by NIH Grant R01 GM095722 (PI: McKeague) and NIH Grant P01 AG 023028-01; he also gratefully acknowledges the help and encouragement of Ezra Susser. The research of Sara López-Pintado was supported by Spanish Ministry of Education and Science Grant SEJ2007-67734. The research of Marc Hallin was supported by Sonderforschungsbereich ‘Statistical modelling of nonlinear dynamic processes’ (SFB 823) of the Deutsche Forschungsgemeinschaft, and by a Discovery Grant of the Australian Research Council. The research of Miroslav Šiman was supported by Project 1M06047 of the Ministry of Education, Youth and Sports of the Czech Republic.