


Introduction
Although clinical supervision is crucial to the initial and continuing professional development of mental health practitioners, research and practice are hampered by unreliable and invalid measures. Studies have indicated the value of an observational instrument in redressing this situation. Called Teachers' PETS (Process Evaluation of Training and Supervision: Milne and James, Reference Milne and James2002), it operationalizes an experiential learning model in which effective supervision is defined empirically, in terms of those supervisor behaviours that increase the supervisees’ use of four learning modes (i.e. experiencing; reflecting; conceptualizing; and experimenting: Kolb, Reference Kolb1984). According to this popular model (e.g. accepted by the British Association for Behavioural and Cognitive Psychotherapy), the job of the supervisor is to facilitate the supervisee's ability to: recall key material from their experience of their therapy work; to reflect on this from a personal perspective, so as to organize and understand it better; to then re-conceptualize it, based on the public knowledge-base and the supervisor's experience; to then use this improved grasp to plan actions to test out this learning (e.g. within the supervision session, through educational role-play). Using a momentary sampling procedure, Teachers' PETS entails observing alternately the supervisor's facilitation behaviours (e.g. listening and questioning), and then observing the supervisee's reactions (e.g. experiencing and reflecting). This represents a way to address the challenge of determining what constitutes effective supervision, by observing how successful supervision is in activating the supervisee's learning during supervision sessions (as per mini-outcomes in therapy).
Although promising, the PETS approach may not be adopting the optimal level of analysis, the best units of measurement. For example, Ladany, Friedlander and Nelson (2005) have advocated a critical events approach, which adopts “episodes” as the relevant unit of measurement. This leads to the question: which level of analysis is best when evaluating supervision?
Aim
To address this issue, we studied learning within supervision at two complementary levels: detailed micro-analysis, based on momentary time sampling (MTS: termed the “frequency” measure here), and critical change “episodes” (Greenberg, Reference Greenberg, Rice and Greenberg1984; Ladany et al., Reference Ladany, Friedlander and Nelson2005). Ladany et al. (Reference Ladany, Friedlander and Nelson2005) suggested that this episodes approach has not yet been applied within supervision research. We assessed the reliability of an episode version of Teachers' PETS, comparing its sensitivity to the original frequency approach. We hypothesized that the frequency method would prove more sensitive to changes in supervisory effectiveness, because it is relatively fine-grained and objective.
Method
Participants
Hour-long audio tapes of routine clinical supervision sessions within the National Health Service (NHS) were coded for two male supervisors, both qualified mental health nurses. They volunteered to participate in a Trust-wide project on “revitalizing clinical supervision”. Five supervisees also consented to participate, consisting of two qualified nurses, one support worker, and two clinical psychology trainees. All were female, and all worked in the NHS. Ethical approval was granted by the Trust's R&D Department.
Design and procedure
A single-subject (N = 1), multiple baseline design across participants was utilised. Ten tape recordings of the supervision were analysed, five baseline sessions and five of cognitive-behavioural supervision (CBT; the intervention). The supervisors had received training in this intervention from the first author, using “evidence-based supervision”, which subsumes a CBT approach (EBS: Milne and Westerman, Reference Milne and Westerman2001). The training was an initial half-day workshop, in which the consultant explained and demonstrated the EBS approach, followed by corrective feedback on the supervisor's use of EBS during a pilot/training phase. EBS is characterized by the supervisor guiding experiential learning (i.e. with methods such as educational role-play, discussion of the supervisee's therapy tapes, and corrective feedback), whilst monitoring the supervisee's learning. EBS is measured by Teachers' PETS. The rationale for EBS is that supervision will be more effective if it is based on methods for which there is research support, and if it is congruent with the kind of therapy that is being supervised (in the present case, CBT). The phase from which the tapes were drawn was not revealed to the coders until after coding had taken place.
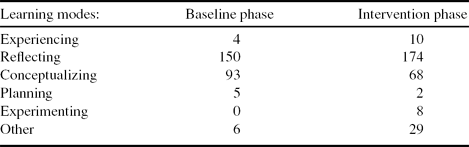
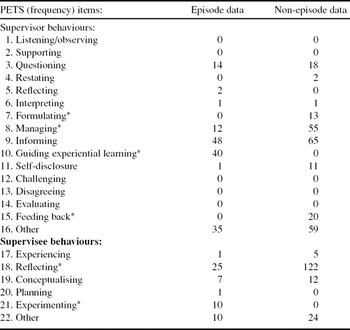
The observational instrument Teachers' PETS (frequency: see Milne and James, Reference Milne and James2002) was used to produce a micro-analysis across these 10 sessions. This involved recording the alternating behaviours of supervisor and supervisee at 10-second intervals. Supervisor and supervisee behaviours were coded into one of 22 possible categories, as defined in the PETS manual. The six supervisee behaviours (learning modes) are listed in Table 1 (as per Milne and James, Reference Milne and James2002, for reasons of precision and sensitivity we subdivided Kolb's 1984 category of “Experimenting” into its affective and behavioural components, labelled as Experiencing and Experimenting). These items represent the mini-outcomes of supervision within PETS, our way to assess within-session effectiveness. In particular, theory (Kolb, Reference Kolb1984) and research (Milne and Westerman, Reference Milne and Westerman2001; Milne and James, Reference Milne and James2002) lead us to predict that EBS will increase the supervisor's use of GEL, resulting in more Experimenting by the supervisee. The 16 supervisor behaviours are listed in Table 2.
Observed frequencies of the supervisee's learning (the measure of supervisory effectiveness, using the tool PETS-frequency), from the baseline (i.e. supervision as usual) and intervention phases (i.e. CBT supervision)

Observed frequencies of the items within PETS (frequency), drawn from the data classified as episodes (i.e. as defined by using the PETS-episode tool), and the remaining non-episode data (* = significantly different)

At the more molar level, PETS (episode) followed the Greenberg (Reference Greenberg, Rice and Greenberg1984) method, which required the observer to listen to each full supervision session, and to then identify all “problem markers” (antecedents), and all subsequent supervision behaviours (i.e. interventions), also using these PETS categories. When a consequence (or mini-outcome) occurred for the supervisee (i.e. when learning was observed, such as reflection), the full interaction sequence was defined as an episode. This permitted the frequency of episodes per supervision phase to be calculated.
Results
Inter-rater reliability was assessed prior to data-collection. For PETS (frequency), there was 79% agreement between two independent coders, and 96% for PETS (episode), based on a total of 637 and 197 independent observations respectively. After data collection was concluded, a “drift” reliability assessment indicated agreement had dropped to 66% and 62% respectively (based on 100 and 144 independent observations respectively. All calculations were based on subtracting disagreements from agreements, providing a relatively conservative reliability estimate).
In relation to our hypothesis, two statistical comparisons were carried out. Using tests of proportion (based on the arcsine transformation: Cohen, Reference Cohen1988), the proportions of behaviour falling into each PETS (frequency) category that assessed the supervisees’ learning (i.e. the operationalization of effectiveness) were compared between the data contained within the baseline and intervention phases. Given the 6 PETS (frequency) effectiveness categories, a conservative Bonferroni correction was applied (0.0083, i.e. alpha = .05 divided by 6) to control for Type 1 error. The PETS (frequency) data, summarized in Table 1, indicated significantly less conceptualization in the CBT supervision phase (Z = 0.28; p = .000), and significantly more experimentation (Z = 0.33; p = .000) and “other” behaviours (Z = 0.34; p = .000). Thus, as expected, there were significant differences in observed supervisory effectiveness between the PETS (frequency) data from these phases. However, PETS (episode) also detected a difference during the intervention phase, defining four episodes (occurring within two of these five sessions), compared to none during the comparable baseline period. These findings indicate that both levels of analysis were sensitive in predicted ways to the effects of the CBT supervision intervention.
To further evaluate both levels of analysis, a retrospective test was conducted to see whether these four observed episodes were found to differ from the non-episode data from the same two supervision sessions, when measured by PETS (frequency). As shown in Table 2, the data for these episode and non-episode periods showed considerable variability, both in the observed frequencies of supervisory behaviours across the PETS (frequency) categories and between phases, ranging from zero (e.g. for Formulating, in the episodes) to 122 (i.e. Reflection, in the non-episode data).
Using tests of proportion (based on the arcsine transformation: Cohen, Reference Cohen1988), the proportions of behaviour falling into each PETS (frequency) category were compared between the data contained within the four episodes and the remaining non-episode data. Given the 22 PETS categories, a conservative Bonferroni correction was applied (0.0023, i.e. alpha = .05, divided by 22) to control for Type 1 error. No significant difference was found overall (i.e. between all the observed episode and non-episode data obtained from PETS-frequency). However, six significant differences were obtained among the 22 individual PETS categories for these two supervision samples. These differences were for: Formulating; Managing; Guiding experiential learning (GEL); Feeding back; Reflecting; and Experimenting, in a pattern that was consistent with the EBS model. Specifically, two of the significant differences reflected the higher expected frequencies for GEL and Experimenting within the episode data (Z = 10.66; p = .0000; Z = 5.18; p = .0000). Conversely, the remaining four categories were higher for the non-episode data (Z = −5.28 to −3.13; p = .0000), indicating that supervision within these non-episode periods utilised relatively more varied, didactic supervision methods, facilitating the supervisee's reflection. As expected, then, PETS (frequency) appeared to provide the more sensitive analysis, by distinguishing between episodes, and by detecting supervisory effectiveness during non-episode periods.
Discussion
This study compared two micro-analysis approaches to measuring supervision and its effectiveness. We achieved our objective of modifying the observational instrument Teachers' PETS to record reliably the more molar level of analysis, called “change episodes”, though it was a concern that observations drifted to an unreliable level. However, this was unlikely to have confounded the present comparison, as both PETS approaches were similarly unreliable following data collection.
The predicted superior sensitivity of the fine-grained, momentary time sampling “frequency” version of PETS was indicated. Although both levels of analysis detected the assumed differences between the baseline (supervision as usual) and intervention phases (CBT supervision), measuring frequency distinguished between experiential and didactic episodes, and detected effective supervision outwith episodes. This observed distinction between episodes is consistent with the guiding theory (Kolb, Reference Kolb1984), and with the findings from related research (e.g. Milne and James, Reference Milne and James2002). It is also important practically, as experiential work probably enhances generalization to therapy.
We should acknowledge, however, that change processes underpinning learning may not always be observable, and that other change mechanisms may occur outside the observed episode. To illustrate, studies of CBT for depression have found that many patients experienced marked improvements (sudden gains) in a single between-session interval. Another weakness of PETS is that it only considers mini-outcomes.
As in therapy, judging supervisory effectiveness is complex and requires multiple methods and measures (e.g. evaluating the link between the supervisee's learning, how this generalizes to therapy, and whether this improves clinical outcomes). Therefore, instruments such as PETS can be viewed as necessary (in demonstrating an initial mini-outcome), but insufficient to evaluate systematically the effectiveness of supervision.
Acknowledgements
Thanks to the supervisors (Stan Graham and Brian Rowley) and their four supervisees for their interest and involvement in this project.



Comments
No Comments have been published for this article.