
I. INTRODUCTION
Nanotube structures are known for various materials including titanium oxide. Tubular titanium oxide-based nanostructures are interesting for many applications such as energy storage and conversion, photocatalysis, and hydrogen storage. Their dominant characteristic is the high specific surface area. Depending on the application, the material can be modified enabling electrical conductivity or catalytic activity.Reference Sun and Li1–Reference Štengl, Bakardjieva, Šubrt, Večerníková, Szatmary, Klementová and Balek6 Two methods for the fabrication of titanium oxide-based nanotubes are described in the literature: anodic oxidation and hydrothermal treatment. Anodic oxidationReference Paulose, Prakasam, Varghese, Peng, Popat, Mor, Desai and Grimes7 yields single-walled titania nanotubes which form highly ordered arrays. Metallic titanium foils are oxidized in a two-electrode arrangement at constant potential at room temperature. Ethylene glycol containing NH4F and H2O is used as electrolyte, and typical voltages during anodic oxidation are 40–60 V. The anodization process leads to tubular structures with diameters of about 100 nm, which are oriented perpendicular to the surface of the titanium foil. The specific surface area thus obtained is about 40 m2/g. Due to the oriented arrangement of the tubes, potential applications mainly as filter material are discussed. For that reason, the aim of many research activities is to increase the length of the tubes, i.e., the thickness of the array, to achieve stable free-standing membranes.
Alkaline hydrothermal treatmentReference Kasuga, Hiramatsu, Hoson, Sekino and Niihara8,Reference Pradhan, Mao, Wong, Chupas and Petkov9 yields multiwalled titanate nanotubes (TNTs) with much smaller dimensions. The tubular structures are of snail type with typical inner diameters of about 3–10 nm. The length of the nanotubes is between 0.2 and 500 µm. Due to the small dimensions, high specific surface area is obtained. Values up to 478 m2/g were observed.Reference Liu, Chen, Zhang and Schwank10 Several types of modification of the nanotubes are proposed in the literature to add functionalities. An important example is the decoration with nanoparticular catalysts.Reference Bavykin and Walsh11
For the application as the electrode material in fuel cells or batteries, beside high specific surface area, high electrical conductivity is required. Pure TNTs have a conductivity of ≈10−8–10−6 S/cm due to their semiconducting natureReference Alves, Fonseca, Brandão, Krambrock and Ferlauto12,Reference Hu, Li, Li, Meng and Tong13 which is not sufficient for the application as the electrode material. To increase the electrical conductivity of titania nanostructures, successful doping with carbon via carbothermal treatment in reducing atmosphere (acetylene–nitrogen) was reported in Refs. Reference Kado, Hahn and Schmuki14–Reference Hahn, Schmidt-Stein, Salonen, Thiemann, Song, Kunze, Lehto and Schmuki17. The authors describe the formation of single-walled titania nanotubes via self-organizing electrochemical anodization and subsequent calcination. The nanotubes have a diameter of 100 nm and are of anatase phase. After mild carbothermal treatment at 500 °C in nitrogen–acetylene gas mixture, the nanotubes are doped with carbon, which was proved by photocurrent measurements.Reference Hahn, Ghicov, Salonen, Lehto and Schmuki15 Above 600 °C, the formation of substoichiometric titanium oxides (suboxides), titanium oxycarbides, and titanium carbide (TiC) occurs.Reference Schmidt-Stein, Thiemann, Berger, Hahn and Schmuki18 In comparison, when commercial TiO2 powders (Aeroxide® TiO2 P25 Evonik Industries AG, Essen, Germany) are carbothermally treated in nitrogen–acetylene gas mixture, a significant increase of electronic conductivity is observed.Reference Huang, Li and Xing16
However, the carbothermal treatment cannot be directly transferred to nanotube material synthesized via the hydrothermal method due to the low thermal stability of protonated TNTs.Reference Herbst19 The as-synthesized TNTs contain a high amount of sodium cations, which are exchanged for protons during post-processing. In the protonated form, the nanotube material is stable only up to 200–300 °C. Significant loss of the specific surface areaReference Zhang, Jin, Zhang, Guo, Yang, Li, Wang and Zhang20 or even the collapse of the tube morphologyReference Morgado, de Abreu, Pravia, Marinkovic, Jardim, Rizzo and Araújo21 is observed upon calcination above 300 °C. For that reason, posttreatment of TNTs with different carbon sources leads to rather low specific surface areas or even the loss of tubular morphology. For example, Wu et al. synthesized protonated TNTs via the hydrothermal method. After drying, the nanotubes were treated in ethanol vapor and subsequently calcined at 400 °C in nitrogen atmosphere, leading to single-walled carbon-doped TiO2 nanotubes of anatase phase with the specific surface area of 146.3 m2/g. The carbon content was not reported.Reference Wu, Dong, Zhao, Wang, Liu and Guan22 Furthermore, Ansón-Casaos et al. mixed protonated TNTs (≈300 m2/g) with different amounts of glucose and calcined the mixtures at 410 °C in nitrogen atmosphere. The resulting products were solid titania nanorods of anatase phase with a carbon content in the range of 0.3–25.4 wt% and a specific surface area in the range of 99–237 m2/g. Besides carbon doping, accumulation of porous carbon on the nanorod surface was detected for carbon contents above 5 wt%, leading to an increased specific surface area.Reference Ansón-Casaos, Tacchini, Unzue and Martínez23 Therefore, a different carbon doping approach is needed to increase the electrical conductivity of TNTs while maintaining the high specific surface area.
It was shown that carbon is retained in titanium oxide-based nanotubes and nanowires after hydrothermal treatment when carbon-doped TiO2 precursors are used.Reference Xu, Wang, Li and Zhang24–Reference Goriparti, Miele, Prato, Scarpellini, Marras, Monaco, Toma, Messina, Alabastri, de Angelis, Manna, Capiglia and Zaccaria26 Xu et al. obtained carbon-doped TiO2 via sol–gel method and synthesized TNTs via the hydrothermal method. After calcination at 500 °C, carbon-doped TiO2 nanotubes of anatase phase were formed. The slightly increased electrical conductivity, detected by impedance spectroscopy, was ascribed to carbon in the TiO2 nanotubes. The carbon content was not reported. Goriparti et al. describe a multistep process to obtain carbon-doped nontubular TiO2-(B) nanowires. First, TiC is thermally oxidized in air to form carbon-doped TiO2, which is subsequently converted into carbon-doped titanium oxide nanowires via alkaline hydrothermal treatment. After calcination at 300 °C, the carbon-doped TiO2-(B) nanowires are formed. Impedance spectroscopy shows a slight increase of electrical conductivity ascribed to carbon presence in the nanowires. However, the authors could only prove the increase of incorporated carbon compared to a reference sample.
The publications mentioned above show that a reducing atmosphere and rather high carbon content seem to be crucial to significantly increase the electrical conductivity of titania nanostructures but cannot be applied to protonated TNTs, due to their low thermal stability.
Hence, the aim of our study is to examine a different approach. The focus of our investigations was to analyze whether TiO2 powders, carbothermally pretreated in reducing atmosphere, can be converted into carbon containing TNTs via hydrothermal treatment. Of particular interest is the correlation between the carbon content in precursor powders prior to and in the products after the hydrothermal treatment in dependence of the carbothermal pretreatment parameters.
II. EXPERIMENTAL
A. Carbothermal treatment of titania powders
The samples were treated carbothermally in acetylene/nitrogen flow.Reference Hahn, Schmidt-Stein, Salonen, Thiemann, Song, Kunze, Lehto and Schmuki17 A prototype reactor was used consisting of tubular heating elements which were thermally insulated from the environment. The length of the heated zone was 3 cm. The powder was inserted as uniaxially pressed cylinders in an alumina tube with an inner diameter of 6 mm. Thermocouples were inserted into the powder sample as well as in the heating elements. The reactive gas was passed directly onto the sample to ensure that the powder is flowed through.
Titania powder samples were treated in acetylene/nitrogen flow (10/90 vol%) of 0.3 L/min at 700 °C, 800 °C, 900 °C, 950 °C, 1000 °C, and 1050 °C for 10 min with a heating and cooling rate of 50 and 25 K/min, respectively. During heating and cooling, the acetylene–nitrogen flow was 0.1 L/min. After carbothermal treatment, the samples were denoted as “CP” with a following number describing the treatment temperature divided by 100. For example, “CP-9.5” represents a carbothermally treated titania powder at 950 °C. “CP-0” stands for an untreated titania sample.
B. Hydrothermal treatment
All samples are based on titanium dioxide powder by Evonik industries (Aeroxide® TiO2 P25 Evonik Industries AG, Essen, Germany ≥99.5% purity). The powder typically has a specific surface area of about 50 m2/g and consists of anatase and rutile with crystallite sizes of about 21 nm (more details on the raw materials can be found in the Supplementary Material). In the following, the untreated sample powder is denoted as CP0 and CP7-CP10.5 for carbon-treated samples. CP0 or carbon-doped titania powders (CP7-CP10.5) are converted into TNTs via hydrothermal treatment. 1 g of powder was dispersed in 325 mL deionized water and the suspension was ultrasonically treated for 15 min under magnetic stirring. In the following step, 160 g sodium hydroxide (NaOH, Carl Roth GmbH & CO. KG, Karlsruhe, Germany ≥99% purity) was added. The suspension was hydrothermally treated for 20 h under stirring (500 rpm) in an open PTFE flask with a magnetic stirrer, placed into a silicone oil bath (115 °C) and connected to an empty wash bottle via silicone hose. Subsequently, the suspension was washed with deionized water until the conductivity of the filtrate fell below 20 µS/cm. Subsequently, sodium ions were exchanged for protons via leaching in 0.1 M HCl for 15 min under stirring with a magnetic stirrer. The material was washed with deionized water until the conductivity of the filtrate was below 4 µS/cm. Ion exchange was confirmed by XRF measurements revealing a sodium content below 0.1 at.%. The suspension was vacuum-filtrated and the resulting powder was dried at 60 °C for 24 h in air. The obtained nanotube samples were denoted based on the precursor powder used during hydrothermal treatment, with the addition of “-NT”. For example, “CP9.5-NT” stands for the nanotube sample that was synthesized from carbothermally treated titania “CP9.5” precursor powder.
C. X-ray diffraction
X-ray diffraction (XRD) patterns were recorded with a laboratory powder diffractometer XpertPro (PANalytical, Almelo, Netherlands) using Cu Kα1/2 radiation. The samples were prepared on 20-mm sample holders by back-loading method without further treatment. The diffraction patterns were taken in an angle range of 5–100° 2θ using a PIXcel detector (PANalytical, Almelo, the Netherlands). The nominal step size was set to 0.013°, and the time per step was 13.77 s. Qualitative phase analysis was performed using HighScore Plus (PANalytical, Almelo, the Netherlands). Quantitative phase content was determined via Rietveld refinement using PowderCell 2.4 (Federal Institute for Materials Research and Testing, Berlin, Germany).
D. Specific surface area (BET method)
The specific surface area was determined via the Brunauer–Emmett–Teller method (BET) using a NOVA 2200 Quantachrome apparatus (Boynton Beach, FL). The samples were dried at 150 °C for 60 min under vacuum prior to measurement. The adsorption–desorption isotherms were measured at 77 K with liquid nitrogen.
E. Scanning electron microscopy
Scanning electron microscopy (SEM) images were taken with a LEO 1525 (Carl Zeiss NTS GmbH, Oberkochen, Germany). The samples were mounted on double-side carbon tape and sputtered with carbon.
F. Thermogravimetry
The water and carbon content of all samples was investigated by thermogravimetric analysis (TGA). TGA was performed using a TG Iris F1 (Netzsch Geraetebau, Selb, Germany). Open alumina crucibles were used. The sample amount was 10–20 mg. The measurements were conducted with synthetic air. The reaction products were analyzed with a coupled FT-IR spectrometer (Tensor 27, Bruker Optics, Billerica, MA).
Earlier investigations showed mass gain during measurement, which occurs due to oxidation of titanium suboxide phases present in carbothermally treated samples above 800 °C. The mass gain overlaps with the mass loss due to oxidation of incorporated carbon impeding accurate measurement of carbon content. For that reason, all samples were pretreated with H2O2 to oxidize titanium suboxides prior to measurement.
The samples were treated in 60 vol% H2O2 for 15 min and dried at 60 °C in air for 24 h.
G. Transmission electron microscopy
Nanotube samples were prepared from washed and dried powder on carbon-coated Transmission electron microscopy (TEM) grids. TEM imaging was performed using a FEI TECNAI F30 S-TWIN transmission electron microscope (Thermo Fisher Scientific Inc., Waltham, Massachusetts) equipped with a field emission gun and working at 300 kV. TEM images were recorded with a CCD camera (16-bit 4096 × 4096 pixel GATAN ULTRASCAN4000, Roper Technologies, Inc., Sarasota, Florida) and acquired by Gatan Digital Micrograph software. TEM in-line holography was realized by focal series reconstruction from image series recorded using the FEI TECNAI F30 S-TWIN as described above, without aberration corrector, under suitable high-resolution TEM conditions. 40 images were recorded at a primary magnification of 790,000 with 3-nm focal increment, thus covering a focal range of 114 nm including Gaussian focus. The accumulated dose per focal series was 168 e−/Å2. The images were hardware-binned by 2, followed by an additional software binning by 2 resulting in a physical pixel size of 0.0576 nm. After image alignment, an area of interest was chosen for exit wave reconstruction, employing a Gerchberg–Saxton algorithm implemented in Python. Residual axial aberrations were corrected by an automated minimization routine also implemented in Python.Reference Lehmann27
III. RESULTS
A. Undoped TNTs
As a reference material, undoped TNTs were synthesized via the hydrothermal route. Synthesis parameters were optimized in earlier experimentsReference Herbst19 and are given in the experimental section. Criteria for optimization were specific surface area, amount of nontubular by-products, and morphology. SEM investigations (data not shown) revealed that the nanotubes are strongly bundled. Appropriate adjustment of solid content during hydrothermal treatment minimized the amount of by-products which were identified as residual precursor powder.
Higher temperatures and longer treatment time resulted in the formation of nanofibers.
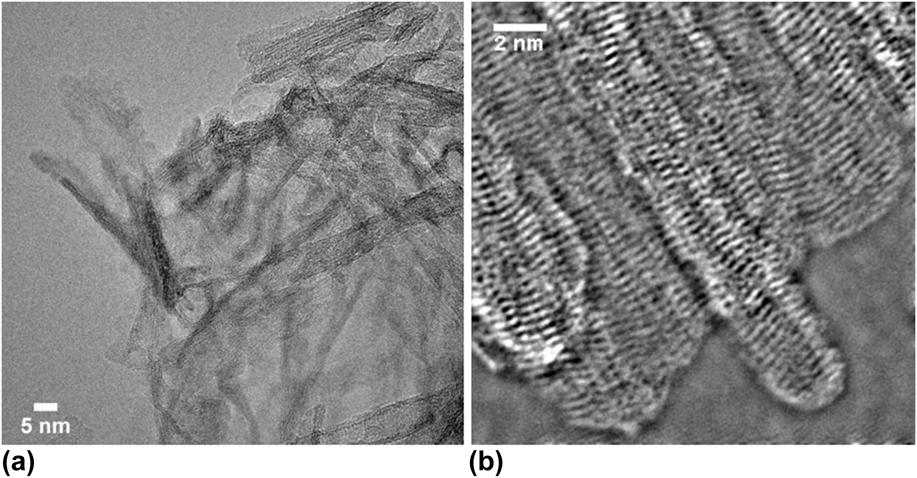
Figure 1 shows a TEM micrograph of the sample CP0-NT synthesized using the optimum parameters for hydrothermal treatment. The micrograph proves the tubular structure and illustrates the multiwall character of the nanotubes, which are strongly bundled. The inner diameter of the nanotubes is about 5 nm. BET measurements of the sample revealed a specific surface area value as high as 380 m2/g.
TEM micrographs of TNTs obtained via hydrothermal treatment of titania powder (P25) at 115 °C for 20 h in NaOH solution. (a) Bundle of TNTs (CP0-NT) and (b) detailed TEM micrograph showing the tube walls.

The synthesis parameters were transferred to the hydrothermal treatment of carbon-doped precursor powders. The results were compared to the undoped TNTs.
B. Carbothermally pretreated precursor powder
To obtain the carbon-doped precursor powder, pure titania powder was carbothermally treated in acetylene/nitrogen flow following the parameters given in the experimental section. The resulting powder was characterized regarding morphology, carbon content (measured by weight loss), phase content, and specific surface area.
C. Thermogravimetry
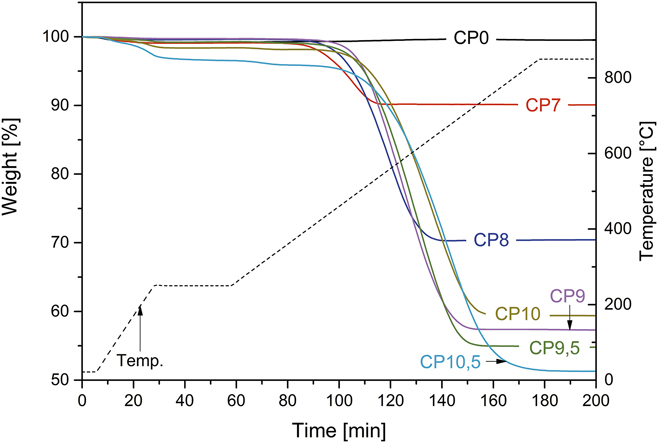
The TGA curves for untreated pure titania (CP0) samples and powders carbothermally treated at different temperatures in nitrogen/acetylene flow are depicted in Fig. 2. All samples show an initial weight loss due to adsorbed water. The pure titania sample shows no further change during measurement. By contrast, all carbothermally treated powders show significant mass loss upon heating (samples CP7-10.5). The decrease starts at a temperature of about 380 °C, which corresponds to carbon starting to disintegrate. The reaction products were investigated with coupled FT-IR spectroscopy. The spectra showed the presence of carbon dioxide and carbon monoxide (Fig. S1). Thus, the mass loss occurring after 380 °C was ascribed to carbon. All thermogravimetry curves reach a plateau at high temperature. The weight difference between the end value and the mass level after initial water loss was used to determine the carbon content of the samples.
Thermogravimetry curves for titania samples treated in nitrogen/acetylene flow at 700–1050 °C. The result for untreated powder is shown as a reference (“CP0”) (modified afterReference Herbst19).

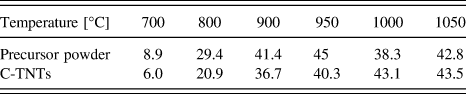
The carbon content of the carbothermally pretreated samples is between 8.9 and 44.3 wt%. Individual values are given in Table II. The amount of carbon incorporated in the powders increases with the reaction temperature applied during carbothermal treatment. The values rise up to a pretreatment temperature of 900 °C, from which it is nearly constant for higher temperatures.
D. XRD
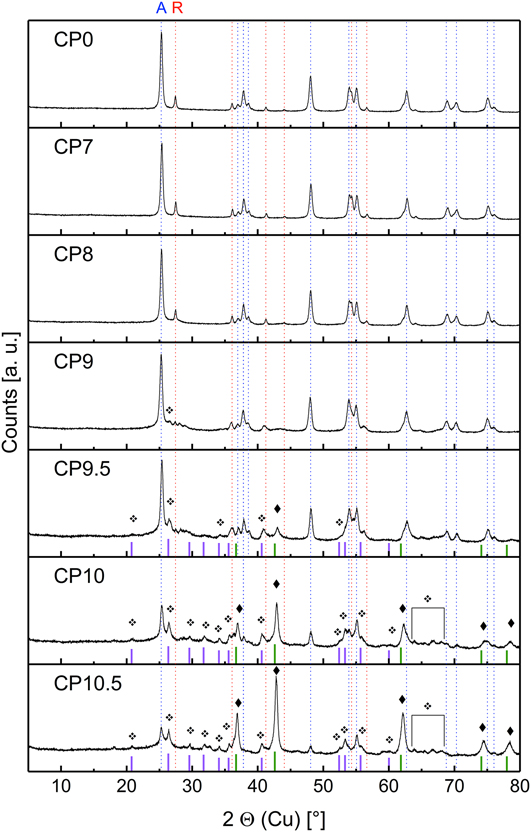
The phase content of the carbothermally treated powders was investigated using XRD (Fig. 3). For comparison, the untreated titania powder P25 (CP0) was characterized regarding qualitative and quantitative phase content. The measurements reveal that the sample CP0 is a mixture of anatase and rutile. Quantitative phase analysis via Rietveld refinement further reveals an anatase content of about 88 vol% (Fig. S2).
XRD patterns of titania powders before (CP0) and after carbothermal treatment at temperatures in the range of 700–1050 °C (CP7-10.5). The lines represent peak positions from ICSD database (PDF-No.). A (blue dashed): anatase-TiO2 (00-021-1272); R (red dashed): rutile-TiO2 (00-021-1276); ♦ (green): titanium oxycarbide TiC0.6O0.4 as reported in Ref. Reference Pohrelyuk, Yas’kiv, Fedirko and Huryn28; ❖ (pink): superimposed peaks of several TinO2n−1 phases (color online, see the Supplementary Material for full patterns, modified afterReference Herbst19).

Comparing the diffraction patterns of the undoped reference sample and the powders treated carbothermally at temperatures below 900 °C, it is noteworthy to mention that the phase content does not change significantly. Higher pretreatment temperatures induce phase transition from anatase and rutile to substoichiometric titanium oxides. From the suboxide series only Ti9O17, Ti4O7, and Ti3O5 could be detected depending on the pretreatment temperature. Detailed plots including all reference lines can be found in the Supplementary Material (Figs. S5–S8). The formation of suboxides starts with Ti9O17 after pretreatment at 900 °C. At 950 °C and higher temperatures, Ti3O5 and Ti4O7 are observed. Above 900 °C, the reducing atmosphere during carbothermal treatment leads to the formation of titanium oxycarbides from the solid solution TiO–TiC. The anatase phase is present in all samples. Rutile is not detected after treatment at 950 °C and higher temperatures.
E. BET and SEM
The results of BET measurements and SEM investigations of carbothermally treated powder and untreated commercial P25 titania powder (CP0) were compared. Typical specific surface area values of untreated powder are in the range of 50 m2/g. The sample shows the typical morphology showing larger agglomerates consisting of smaller primary particles. The SEM image is part of the Supplementary Material (Fig. S9).
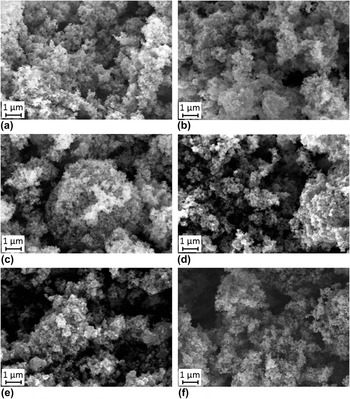
Carbothermal treatment of the titania powder does not change the morphology and the specific surface area significantly. After treatment at 700 °C up to 900 °C (CP7-CP9), the specific surface area is about 55 m2/g. Higher temperatures lead to a small decrease in the specific surface area down to 45 m2/g. The values are supported by the SEM analysis, where no significant agglomeration or sintering effects can be observed (Fig. 4).
SEM micrographs of carbothermally treated titania powders at 700–1050 °C. (a) CP7—52 m2/g, (b) CP8—54 m2/g, (c) CP9—55 m2/g, (d) CP9.5—45 m2/g, (e) CP10—45 m2/g, and (f) CP10.5—48 m2/g. (modified afterReference Herbst19). For the micrograph of untreated titania powder (CP0), see Fig. S9.

F. Carbon-doped TNTs from carbothermally pretreated powder
1. Thermogravimetry and specific surface area (BET)
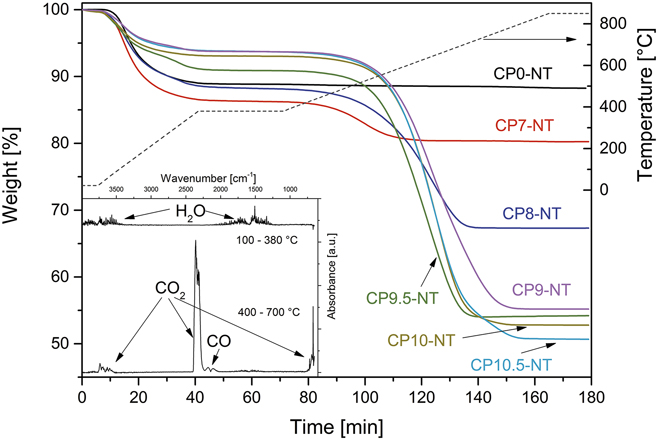
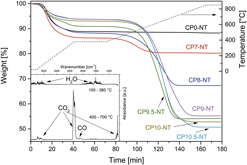
Nanotubes were synthesized via the hydrothermal route from the pretreated carbon containing titania powders using the optimized parameters as described above. The TGA of nanotube samples shows again initial mass loss in the temperature interval between 100 and 380 °C (Fig. 5). The corresponding analysis of degradation products revealed desorption of water. The comparison of the values of weight loss in the initial state for powders (Fig. 2) and tubular samples demonstrates that the tubes adsorb a higher amount of water indicating high specific surface area.
TGA of TNTs (CP7NT–CP10.5-NT) synthesized from carbon-doped titania powders (CP7-10.5). CP0-NT was synthesized from undoped titania powder (CP0). The inset shows the corresponding FTIR spectrum of the measured exhaust gases (modified afterReference Herbst19).

Between 380 and 700 °C further mass loss occurs, which is in analogy to the powder samples correlated with the degradation of incorporated carbon. The degradation products were analyzed using coupled FT-IR spectroscopy and were again identified as carbon monoxide and carbon dioxide.
Similar to the observations from the thermogravimetry of the powder samples, the undoped tube sample shows initial mass loss due to adsorbed water. After that no further change in the TG curve is observed. All samples synthesized from carbothermally treated precursor powders show additional weight loss indicating the incorporation of carbon in the material. The values for adsorbed water and incorporated carbon were again calculated based on the difference between initial values and plateaus after loss of water and weight constancy at 800 °C.
The amount of mass loss referred to water and carbon is correlated with the parameters for the pretreatment of the precursor powder. With increasing pretreatment temperature of titania powders (CP7-10.5), the carbon content in nanotube samples CP7-NT–CP10.5-NT increases from 6.0 to 43.5 wt%, whereas the amount of adsorbed water decreases from 13.6 to 6.2 wt% (see Table I).
Water and carbon content and specific surface area of undoped TNTs (CP0-NT) and carbon-doped TNTs (CP7-NT–CP10.5-NT), synthesized from untreated titania (CP0) and carbothermally treated titania powders (CP7-10.5), respectively.

The specific surface area of the samples after hydrothermal treatment is also dependent on the temperature of pretreatment of the precursor powders. The values do not reach the reference value of the undoped sample and decrease with increasing precursor powder treatment temperature (see Table I). The amount of adsorbed water correlates with the values for the specific surface area.
2. XRD
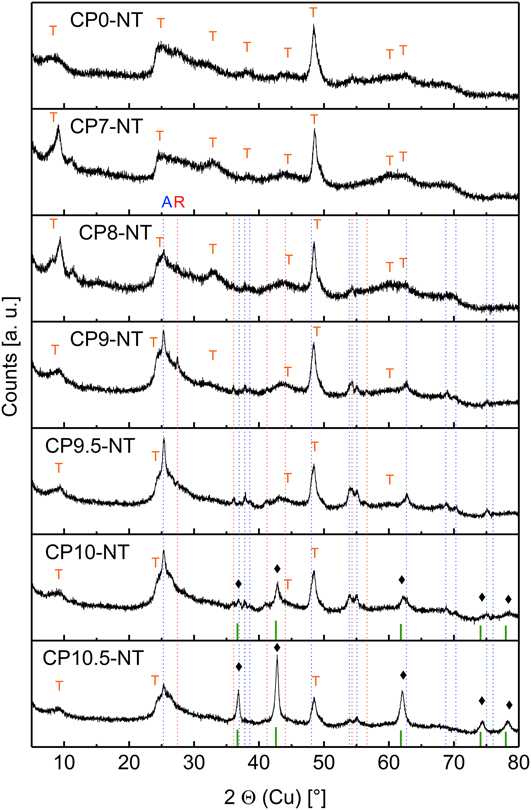
Powder diffraction patterns (Fig. 6) were taken from TNTs synthesized from carbothermally pretreated powders (CP7-10.5) and from undoped titania powder (CP0) for comparison. As expected, the undoped sample (CP0-NT) shows the typical diffraction pattern for TNTs as reported by various authors.Reference Pradhan, Mao, Wong, Chupas and Petkov9,Reference Wu, Dong, Zhao, Wang, Liu and Guan22,Reference Tang, Zhang, Deng, Wei, Le Tam, Chandran, Dong, Chen and Chen29,Reference Yang, Jin, Wang, Li, Zhang, Zhang, Guo and Zhang30 The XRD patterns are characterized by broad peaks. Peak positions, intensities, and widths may differ due to various hydrothermal syntheses and post treatment procedures. In Fig. 6, the peak positions commonly observed for TNTs are marked: ∼10°, ∼25°, ∼34°, ∼38°, ∼44°, ∼48°, ∼60°, and 62°. The crystal structure of TNTs is widely discussed, but the layered H2Ti3O7 monoclinic titanate structure is accepted by most authors.Reference Liu, Chen, Zhang and Schwank10
Patterns of carbon-doped TNTs (CP7-NT–CP10.5-NT) and undoped TNT sample (CP0-NT). The lines represent peak positions from ICSD database (PDF-No.). A (blue dashed): anatase-TiO2 (00-021-1272); R (red dashed): rutile-TiO2 (00-021-1276); ♦ (green): titanium oxycarbide TiC0.6O0.4.Reference Pohrelyuk, Yas’kiv, Fedirko and Huryn28 T: characteristic positions for TNTs (color online, modified afterReference Herbst19).

The diffraction patterns from nanotube samples fabricated from powders pretreated at 700–900 °C (CP7-NT–CP9-NT) show no significant difference to patterns from the undoped nanotube material. Closer inspection reveals triple peaks around 10° for the samples CP7-NT and CP8-NT. Additionally, the peak at ∼34° is more pronounced.
Peaks at ∼10° are ascribed to the interlayer distance between tube walls. Splitting into various peaks indicates more than one population of nanostructures having different interlayer distances. Fitting the peak positions of the CP7-NT and CP8-NT patterns leads to estimated d-values of 1.1, 0.9, and 0.8 nm. The interlayer distances allow the correlation with nanotubes, nanosheets, and nanoribbons. The peak splitting points toward nontubular but elongated by-products which are frequently observed and were investigated in detail by Papa et al.Reference Papa, Millot, Saviot, Chassagnon and Heintz31
The diffraction patterns from samples synthesized from precursor powders treated at higher temperatures than 700 °C show better signal-to-noise ratio and new Bragg reflections with smaller FWHM, indicating additional crystalline phases. Starting with the pretreatment temperature of 800 °C, additionally to the nanomaterial, crystalline phases are observed. Anatase reflections can be found for all samples, most distinct at 950 and 1000 °C. Rutile is detected at 800, 900, and 950 °C and disappears for higher pretreatment temperatures. Titanium oxycarbides are found in the tube samples synthesized from powders carbothermally treated at 1000 and 1050 °C.
The typical nanotube pattern is suppressed for higher temperatures. However, the characteristic peaks at ∼10°, a shoulder to the anatase peak at 25°, and the highest peak at 48° 2θ remain visible.
3. SEM
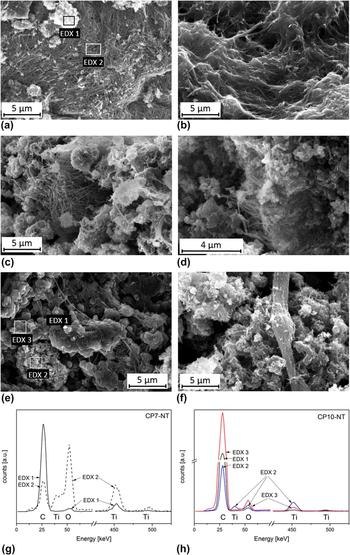
SEM images of samples after hydrothermal treatment of carbon-doped precursor powders are depicted in Fig. 7. All images show elongated structures beside agglomerated powder particles. The observations correspond to the results from specific surface area analysis and XRD. Although the investigations allow no quantitative interpretation, all samples seem to contain nanotubes, nanosheets, or nanowires. Particular by-products seem to be more pronounced for higher pretreatment temperatures. For samples synthesized from precursor powders treated at higher temperatures, slight coarsening of byproduct particles is observed.
SEM images and EDX plots of carbon-doped TNTs. (a) CP7-NT, (b) CP8-NT, (c) CP9-NT, (d) CP9.5-NT, (e) CP10-NT, (f) CP10.5-NT (modified afterReference Herbst19), (g) EDX spectra of sample CP7-NT, and (h) EDX spectra of sample CP10-NT.

EDX investigations were performed in several characteristic regions of the sample to investigate the chemical composition focusing on information about the carbon content. Parts consisting predominantly of elongated structure and agglomerated powder were selected for measurements.
The measurement at the 700 °C sample in a region containing predominantly nanotubes reveals carbon, titanium, and oxygen. The same elements were detected in the powder region. The relative peak intensities suggest that the relative amount of carbon is higher in the particle fraction. Note that the samples were sputtered with carbon to achieve sufficient conductivity for SEM analysis. For that reason, carbon can be expected on the whole sample. Analogous investigations at the sample synthesized from the powder pretreated at 1000 °C show similar results. All parts of the sample contain titanium, oxygen, and carbon. The highest relative amount of carbon is detected in a region where coarsened particles are observed. Parts of the sample consisting of finer powder show a lower amount of carbon. Intermediate values are measured at platelet structures. Single elongated structures were too narrow to perform selective EDX measurements.
4. TEM
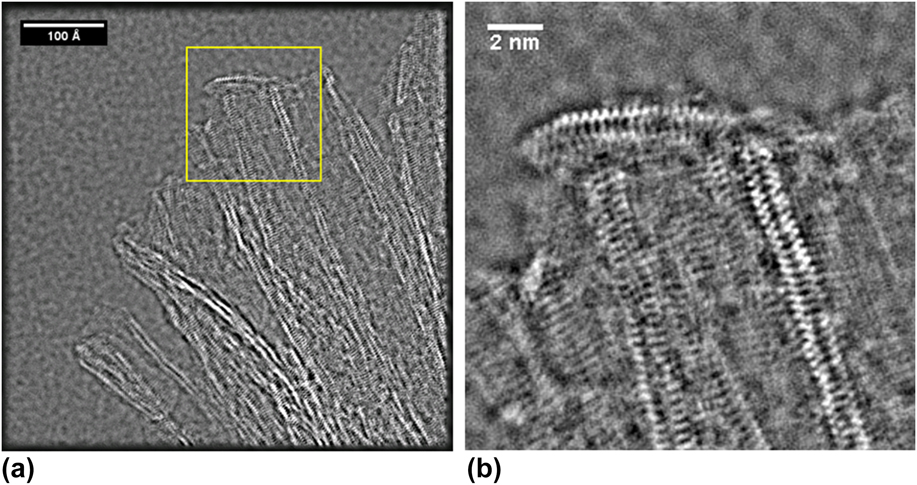
The nanotube sample (CP7-NT) obtained from carbon-doped titania powder (CP7) pretreated at 700 °C was investigated using TEM (Fig. 8). The phase image of the TEM exit wave reconstruction proves that tube morphology was obtained via hydrothermal treatment of carbon-doped titania powders. The inner void and the tube walls are visible in the TEM images and show the typical dimensions of TNTs. As expected, the tubes are strongly bundled. For imaging, the end of a bundle was chosen where the individual tubes start to separate. The nanotubes depicted in Fig. 8 seem to be of multiwall type with two walls.
TEM micrographs. (a) Bundle of carbon-doped TNTs (CP7-NT) which were synthesized from titania powder pretreated at 700 °C (CP7) and (b) detailed TEM micrograph of (a) showing the tube walls.

IV. DISCUSSION
A. Chemical and structural properties of carbothermally treated titania (precursor powder)
Commercially available titania powder (P25) was treated carbothermally in the temperature range of 700–1050 °C in acetylene/nitrogen flow. The resulting material was investigated regarding phase content, carbon content, and morphology.
B. Pretreatment temperatures 700–800 °C
XRD investigations reveal that the phase content is identical with that of untreated titania (CP0) for treatment temperatures of 700 °C (CP7) and 800 °C (CP8). The untreated TiO2 powder consists of anatase and rutile. Mild reaction conditions under reducing atmosphere do not change the phase content as it is detectable within the limits of XRD. However, significant carbon content of about 9–29 wt% was measured by TGA-FTIR for samples CP7 and CP8, respectively. Due to the absence of the crystalline carbon phase in our XRD patterns, we suggest that the carbon in samples CP7 and CP8 is mainly present as amorphous carbon. We suppose that the amorphous carbon is located on the powder particles, possibly as a shell. The assumption is supported by the absence of grain coarsening, which is validated by SEM and BET results. Such shells around titania grains were reported in Ref. Reference Huang, Li and Xing16 by Huang et al. The authors demonstrated that after 20 min in acetylene–nitrogen gas mixture at 700 °C, pure titania P25-powder was coated with a uniform amorphous carbon shell (≈5 nm), which was not detectable by XRD and which also prevented severe sintering of titania grains. Furthermore, our experiments showed that below 900 °C, phase content regarding the titanium dioxide polymorph did not change with temperature treatment although the transformation of anatase to rutile could be expected. It is well established that for fine titania powders, the formation of rutile occurs around 600–700 °C since rutile is the thermodynamically stable phase.Reference Hanaor and Sorrell32 However, in our experiments, the amount of rutile does not increase upon thermal treatment. This observation further supports the postulation of an amorphous carbon shell. It is frequently reported that the anatase to rutile transformation is shifted to temperatures above 900 °C due to the presence of carbon coating,Reference Huang, Li and Xing16,Reference Tsumura, Kojitani, Izumi, Iwashita, Toyoda and Inagaki33 a carbon containing atmosphere,Reference Enache, Schoonman and van de Krol34 or carbon aerogels.Reference Meng, Li, Liu and Cao35 The mechanism behind the shift in the transformation temperature is not yet identified in the literature and needs further investigation. The inhibition of rutile crystallization during carbothermal treatment of titania can be beneficial for a high-yield synthesis of carbon-doped TNTs because rutile shows slower dissolution-kinetics during hydrothermal synthesis than anatase.Reference Morgan, Triani, Blackford, Raftery, Frost and Waclawik36
The carbon content significantly increases from 9 to 29 wt% for the samples CP7 and CP8. The increase with the reaction temperature can be ascribed to a higher yield of carbon, due to higher reaction rates of acetylene decomposition.Reference Khedr, Abdel Halim and Soliman37,Reference Towell and Martin38
C. Pretreatment temperatures 900–1050 °C
Above 900 °C, we observe several substoichiometric titanium oxides (suboxides) starting with Ti9O17 at 900 °C (CP9) followed by mixtures of Ti4O7, Ti3O5, and titanium oxycarbide in samples CP9.5–CP10.5. Suboxides with the general formula TinO2n−1, also known as Magnéli phases,Reference Andersson and Magnéli39 are formed in reducing atmosphere from titania. The titanium to oxygen ratio is dependent on the degree of reduction which is mainly determined by the reducing environment, particle size, packing density, temperature profile, and reduction duration.Reference Walsh and Wills40 With the increasing temperature, the titanium to oxygen ratio increases.Reference Dewan, Zhang and Ostrovski41,Reference Sen, Xu, Yang, Sun, Song, Wan and Dai42 Our results from the XRD measurements correspond to the observations reported in the literature. The highest reaction temperatures applied lead to products with the highest titanium to oxygen ratio, i.e., to oxycarbides. Titanium oxycarbides are phases within the solid solution of TiO and TiC with the general formula TiOxC1−xReference Jiang, Hou, Huang, Zhou, Hou, Cao and Zhu43 and complete miscibility. It was shown by in situ XPS measurements in carbon containing reducing atmosphere that TiOxC1−x is formed via intermediate titanium suboxides, by replacing oxygen vacancies with carbon atoms.Reference Calvillo, Fittipaldi, Rüdiger, Agnoli, Favaro, Valero-Vidal, Di Valentin, Vittadini, Bozzolo, Jacomet, Gregoratti, Kunze-Liebhäuser, Pacchioni and Granozzi44 The process is time-dependent, where the suboxide phase is converted into TiOxC1−x with prolonged reduction duration.Reference Dewan, Zhang and Ostrovski41 Considering that the carbothermal treatment in our experiments was rather short (10 min), it is reasonable that we observe a mixture of anatase, TiOxC1−x, and suboxides due to an incomplete conversion. For example, Koc et al. obtained a mixture of Ti3O5 and TiOxC1−x after a 2-h reduction of carbon-coated P25 titania powder at 1200 °C,Reference Koc and Folmer45 whereas Huang et al. report the formation of pure TiOxC1−x from carbon-coated P25 titania after a reduction of 4 h.Reference Huang, Li and Xing16
D. TNTs from carbon-doped precursor powders
XRD patterns and TEM investigations proved that TNTs were obtained from the pretreated carbon containing titania powder. After hydrothermal treatment, the characteristic peaks for TNTs were observed. SEM investigation shows elongated structures in all samples beside agglomerated powder particles in different amounts. TEM images prove that the sample synthesized from titania treated carbothermally at 700 °C contains tubular morphologies typical for TNTs.
In addition to structure and morphology investigations, the specific surface area measured via nitrogen adsorption was taken as a measure for the amount of nanotube formation. The reference point for our experiments was the specific surface area of undoped nanotube samples synthesized in our laboratory. We achieved 380 m2/g for the reference nanotube sample (CP0-NT) which is in good agreement with the literature studies.Reference Mozia, Borowiak-Paleń, Przepiórski, Grzmil, Tsumura, Toyoda, Grzechulska-Damszel and Morawski46,Reference Mozia, Borowiak-Paleń, Przepiórski, Grzmil, Tsumura, Toyoda, Grzechulska-Damszel and Morawski46–Reference Wang, Lin, Li, Yang, Chi and Lin48 In comparison, values between 340 m2/g (CP7-NT) and 175 m2/g (CP10.5-NT) were obtained for the samples synthesized from carbothermally pretreated titania powders (CP7-10.5). It is noteworthy to mention that for all samples, the specific surface area is significantly higher than that measured at pretreated powder samples which varies around 45–55 m2/g. The high specific surface area can be taken as indication for the successful transformation of at least part of the precursor powder into nanotubes. The presence of nanotubes in the sample CP7-NT was proven using TEM. Tube walls and the inner void are clearly visible. Not all samples could be investigated by TEM so that the information about the morphology of the nanomaterial can be drawn only from SEM investigations and specific surface area measurements. However, both methods support the assumption that also in the samples synthesized from precursor powders treated at higher temperatures, nanotubes were formed. SEM investigations show the presence of elongated structures beside agglomerated powder particles. However, from the images only, it is not possible to decide whether the elongated structures are nanotubes or nanofibers. A first hint is that nanofibers are usually observed after hydrothermal treatment at temperatures higher than 170 °C.Reference Bavykin and Walsh11 Additionally, the value for the specific surface area points toward nanotubes. Geometrical considerations assuming ideal morphology lead to simple correlation between specific surface area, diameter, and wall thickness, respectively.Reference Bavykin and Walsh11 The following equations can be derived (neglecting the end surfaces):
 $$S = {4 \over {\rho d}}\quad {\rm{for}}\;{\rm{nanofibers}}\quad ,$$
where S = specific surface area, ρ = density, d = diameter and:
 $$S = {2 \over {\rho h}}\quad {\rm{for}}\;{\rm{nanotubes}}\quad ,$$
where h = wall thickness (for more complete equations, see the Supplementary Material).
Please note that the specific surface area of the tubes is only dependent on the wall thickness, which for the titanium oxide tubes is around 2 nm.
Following Bavykin and Walsh,Reference Bavykin and Walsh11 the density was assumed to be 3.16 g/cm3. Assuming that the whole sample consists of nanotubes, a wall thickness of 1.86 nm is calculated for CP7-NT after Eq. (2). The value corresponds well to that estimated from TEM investigations. The samples CP8-NT to CP10.5-NT show lower specific surface areas. The lowest value measured was 175 m2/g. Calculating a wall thickness based on that value using Eq. (2) leads to 3.62 nm which is still reasonable for TNTs. Assuming that the elongated structures are nanowires without inner voids, reveals a diameter of 7.23 nm following Eq. (1). However, typical diameters of titanate nanofibers range between 20 and 200 nm. Furthermore, the samples consist also of larger powder particles which contribute much lower to the specific surface area. Summarizing all these considerations, it is plausible to state that also from precursor powders pretreated at temperatures above 700 °C, nanotubes are formed beside residual precursor powder.
As described in the results section, the specific surface area of the nanotube samples decreases with increasing pretreatment temperature of the precursor powder (Table I). Additionally, a lower amount of adsorbed water is observed. Both results indicate that at higher pretreatment temperature, the formation of titanium nanotubes was partially suppressed in favor of other phases. The assumption is further supported by the SEM images and the phase analysis.
As mentioned above, with increasing pretreatment temperature, a higher fraction of agglomerated powder particles is observed beside elongated structures. EDX investigations show that the relative amount of carbon in the particle fraction is higher than in the fibrous regions. Although the interpretation of the measurement data is difficult due to carbon sputtering of the samples prior to SEM investigations, the comparison of the signal intensities suggests that a high amount of carbon is retained in the particle fraction. Simultaneously, the XRD measurement shows the presence of rutile and an increasing amount of titanium oxycarbides with increasing pretreatment temperatures. We assume that the nontubular fraction is mainly residual titanium oxycarbide and rutile not reacted during the hydrothermal treatment. The assumption is supported by investigations regarding the stability of TiC in several corrosive media.Reference Philipp49 The authors report that TiC is inert against strong aqueous bases such as NaOH. Among the possible titanium oxide phases, rutile is most stable against dissolution during hydrothermal treatment.Reference Morgan, Triani, Blackford, Raftery, Frost and Waclawik36 Other titanium oxide phases such as anatase or titanium monoxide are less stable or even soluble in aqueous media and disappear during hydrothermal treatment.
From those observations, we conclude that carbothermal treatment of titania powders at temperatures below 800 °C is most suitable for the synthesis of carbon-doped TNTs among the conditions tested. Criteria for optimum synthesis parameters are high yield and high specific surface area of the tubular products obtained.
The question whether carbon doping of the tubes was successful is not easy to answer from the data we obtained. Several observations point toward carbon incorporation into the tubes:
(i) The overall carbon content of the nanotube samples increases from 6.0 wt% (pretreatment temperature 700 °C) to 43.5 wt% (pretreatment temperature 1050 °C).
(ii) All samples show the same carbon content before and after hydrothermal treatment within the error limits (Table II).
(iii) The mass loss during thermal analysis which could be correlated with carbon degradation, occurs at temperatures only above 380 °C which suggests strong bonding of carbon within the structure.
Carbon content in wt% of precursor powders and carbon-doped TNTs (C-TNTs) in dependence of powder pretreatment temperature.

Further investigation using spectroscopic methods, especially XPS and AC impedance spectroscopy could give further insight into the nature of carbon incorporation into the material.
However, our investigations clearly demonstrate that TNTs with high specific surface area (340 m2/g) can be synthesized from carbothermally treated titania precursor powder (700 °C). It is noteworthy to mention that the samples contain a significant amount of carbon (6 wt%). Although the nature of carbon incorporation could not be clarified, the experiments open a new path toward tubular nanostructures from titanium oxide avoiding posttreatment which is known to destroy the nanotube morphology.
V. SUMMARY AND CONCLUSION
A new method for the fabrication of carbon-doped TNTs was investigated. The hydrothermal method was modified replacing the untreated titania powder starting material by carbon-doped titania powders obtained via carbothermal treatment in acetylene/nitrogen flow. All samples were characterized by means of XRD, SEM, BET, and TGA. After hydrothermal treatment, the reaction products were additionally analyzed by TEM. Below 900 °C, carbothermal treatment of titania does not change the phase content significantly, while the carbon content increases from about 9 wt% (700 °C) to about 21 wt% (800 °C). From 900 °C to 1050 °C, various substoichiometric titanium oxides and titanium oxycarbides are formed with a maximum carbon content of about 43 wt%. Nanotubes with high specific surface area (340 m2/g) were successfully formed via hydrothermal treatment. Carbon content in the samples could be proved although the type of incorporation could not be clarified.
It was shown that carbon is incorporated in the new precursor powder. After treatment at 700 °C, the precursor powder consists of anatase and rutile. About 9 wt% carbon is incorporated into the powder, presumably as amorphous carbon coating. Such precursor powder was successfully transformed into TNTs with high specific surface area (340 m2/g), 6 wt% carbon, and a low amount of by-products. Higher pretreatment temperatures lead to the formation of titanium suboxides and titanium oxycarbides in the precursor powders with a carbon content up to about 43 wt%. After hydrothermal treatment of such powders, a higher amount of unreacted agglomerates beside tubular structures is observed.
The carbon content in the precursor powders and the hydrothermally treated material is comparable. The precise amount of carbon incorporated into the nanotube structure and the exact location of the carbon atoms remain unclear and should be subject of further investigations. First investigations of the electrical conductivity of carbon-doped precursor powders and carbon-doped TNTs show a significant influence of the carbothermal pretreatment. This behavior will be examined by AC impedance spectroscopy in further studies.
Supplementary Material
To view supplementary material for this article, please visit https://doi.org/10.1557/jmr.2018.49.
ACKNOWLEDGMENT
The authors thank the German Research Foundation (DFG) for financial support (GZ: HE 7821/1-1, Projektakademie Ingenieurwissenschaften).