Introduction
Anxiety disorders in late life represent the most common late-life mental health illnesses and are often comorbid with other mental and physical illnesses (e.g. Byers et al., Reference Byers, Yaffe, Covinsky, Friedman and Bruce2010). Within a 12-month period, anxiety disorders were found to affect 7–12% and depressive disorders 2.6–5% of adults over 65 years (Byers et al., Reference Byers, Yaffe, Covinsky, Friedman and Bruce2010). It has also been well documented that significant impairment and lower level of quality of life are experienced by older anxious individuals, whether they present with sub-syndromal anxiety symptoms or clinically significant and more severe anxiety disorders (de Beurs et al., Reference De Beurs, Beekman, van Balkom, Deeq, van Dyck and van Tilburg1999). Sub-syndromal anxiety symptoms in late life are even more prevalent than (formal) anxiety disorders, with prevalence estimates ranging from 15% to 52.3% in community samples (Bryant et al., Reference Bryant, Jackson and Ames2008). Yet, anxiety has traditionally been less well studied in terms of assessment and treatment strategies than depression in old age (Byrne and Pachana, Reference Byrne and Pachana2010). Thus, assessing anxiety with psychometrically sound geriatric anxiety measures is critical in the older population. Without adequate recognition of anxiety disorders, older adults will not receive suitable, if any, treatment for these issues.
The detection of anxiety in older adults may be complicated by various co-occurring challenges, including the relatively high frequency of medical disorders in old age (Murphy and Helmick, Reference Murphy and Helmick2012), and unintended adverse or interaction effects following medication use and poly-pharmacy (Therrien and Hunsley, Reference Therrien and Hunsley2012), other mental health problems like depression (Byrne and Pachana, Reference Byrne and Pachana2011), and cognitive impairment, and dementia (Seignourel et al., Reference Seignourel, Kunik, Snow, Wilson and Stanley2008). When the older adult is experiencing somatic symptoms related to a chronic medical condition or acute illness, the presence of these symptoms may confound reporting of anxiety symptoms on measures that include multiple somatic symptoms. Likewise, the use of various pharmacological compounds may interact in ways that disturb reporting of anxiety by the patient as well as the clinicians understanding the actual symptoms. Considering the individual´s cognitive functioning, it is well documented that cognitive impairment is associated with reduced reliability and validity on measures of psychiatric symptoms. Finally, older adults as well as mental health professionals may wrongly attribute anxiety symptoms to an expected normal aging process, with the risk of limiting access to relevant treatment options for older patients. Hence, these challenges underscore that measures or instruments developed and used for assessing anxiety in older adults should be validated across various samples and communities in clinical as well as research settings.
The Geriatric Anxiety Inventory (GAI; Pachana et al., Reference Pachana, Byrne, Siddle, Koloski, Harley and Arnold2007) is a 20-item scale developed specifically for measuring symptom severity of anxiety among older persons. It has been validated in different clinical and community samples, and in various populations and countries (e.g. Gould et al., Reference Gould, Segal, Yochim, Pachana, Byrne and Beaudreau2014). Generally, the scale has demonstrated excellent reliability and internal consistency, discriminant ability, predictive, and convergent validity (e.g. in stroke patients, Kneebone et al., Reference Kneebone, Fife-Schaw, Lincoln and Harder2016). As such, the GAI scale seems to have proven itself as a viable instrument with strong psychometric properties.
However, several studies on the GAI with respect to factor analysis have yielded divergent findings. Several studies reported a unidimensional factor structure (Byrne and Pachana, Reference Byrne and Pachana2011; Johnco et al., Reference Johnco, Knight, Tadic and Wuthrich2015). Notably, a study by Yan et al. (Reference Yan, Xin, Wang and Tang2014) reported both a confirmatory factor analysis (CFA) and an item response model of GAI. The CFA analysis supported a unidimensional solution. However, using more traditional statistical methods, others have found different factor solutions. A two-factor solution with “worries” and “physical symptoms” as factors was recently reported by Bendixen et al. (Reference Bendixen, Hartberg, Selbæk and Engedal2016), while Màrquez-Gonzàlez et al. (Reference Màrquez-Gonzàlez, Losada, Fernàndez-Fernàndez and Pachana2012) reported a three-factor solution, referring to the factors as a “cognitive factor” (or mainly as a worry dimension), an “arousal factor” (nervousness), and a “somatic symptoms factor” (e.g. “butterflies in the stomach”). Another three-factor solution was reported by Guan (Reference Guan2016), with the factors named as “mental anxiety,” “negative anxiety,” and “physical anxiety.” Notably, the factor solution was very different from the structure reported by Màrquez-Gonzàlez et al. (Reference Màrquez-Gonzàlez, Losada, Fernàndez-Fernàndez and Pachana2012), indicating that items do not load consistently on factors across studies. A four-factor solution had been reported in two studies (Diefenbach et al., Reference Diefenbach, Bragdon and Blank2014; Loynachan et al., Reference Loynachan, Lee, Lamb and Pyykkonen2016). Hence, overall there are mixed findings regarding the dimensionality and factor structure of the GAI.
Understanding the factor structure is relevant for the scoring of GAI and thus the interpretation of the score. For example, anxiety consists of diverse manifestations (e.g. somatic, cognitive, etc.), thus a heterogenic set of scale items could manifest itself in several correlated factors. The question perhaps of interest for clinicians is given a presence of a number of correlated factors, should one use only a total score, or should one also use separate factor scores – alone –, or in addition to a total score?
There may be different possible reasons for the divergent findings across the studies. For example, there might be differences in cultural response styles, differences in semantics or in meaning due to translation processes, or varying sample characteristics (e.g. clinical vs. community), among other reasons. All of the above might contribute to different factor structures observed in the studies.
However, and importantly, the varying findings of one-factor, two-factor, three-factor, and four-factor structures are not necessarily in conflict, as anxiety might consist of general as well as specific factors. Methodologically, however, the presence of general and specific factors calls for a different approach than the one offered in most commonly used and traditional factor analysis. For constructs containing general and specific factors, a bifactor model might be a useful approach, as it allows us to examine both unidimensionality through a general “G” factor, at the same time allowing specific factors or sub-dimensions (S's) (Reise, Reference Reise2012). Thus, a bifactor model estimates how much of the item variance is explained by the G-factor, and how much is due to specific factors. Furthermore, given the factor structure and loadings, the data may support the scale as a unidimensional construct, or support the use of a multidimensional structure and scale (Reise, Reference Reise2012).
The Geriatric Anxiety Inventory short form (GAI-SF; Byrne and Pachana, Reference Byrne and Pachana2011) is a five-item scale based on the “best” – or most predictive – items from the full GAI on receiver operating characteristic curve (ROC) analysis (Pachana and Byrne, Reference Byrne and Pachana2011). While there are extensive studies regarding the full version of the GAI, only a few validation studies of the short form exist. A one-factor solution for the GAI-SF has been reported (e.g. Johnco et al., Reference Johnco, Knight, Tadic and Wuthrich2015). Still, there is a need to evaluate the GAI-SF psychometrically as well, specifically with regard to factor structure.
In order to ascertain that the test scores are comparable and items have the same meaning for older adults across different demographic status (e.g. gender) or different health status (e.g. depression), one should test GAI for differential item functioning (DIF) across these characteristics. For example, older woman tend to report higher anxiety levels in comparison with older men, but men and women should still have the same likelihood of answering yes to an item measuring anxiety, if they have the same total sum-score on a specific scale (Mueller et al., Reference Mueller2015). But this cannot just be assumed a priori; it has to be tested empirically. Therefore, it is also a need to test if the items in the GAI and the GAI-SF have equal or different item function across central patient/person characteristics like sex or cognitive functioning, as well as other mental health problems, like depression. That is, for participants in the sample, do the items provide the same information across (such) subgroups?
Thus, the first aim of this study is to fit a bifactor model of the GAI and the GAI-SF, respectively. Thereafter, to the extent that a unidimensional scale is supported, our second aim is to fit a Rasch model of the GAI and the GAI-SF, respectively. The third aim is to test sex, cognitive functioning, and depressive symptoms for DIF.
Methods
GAI translation
The GAI was translated from English to Norwegian by two psychologists with a clinical specialty in aging and old age mental health (IHN & KMH). A larger group of clinical psychologists and psychiatrists provided feedback on face and content validity of the translation. Following established methods for translating instruments (World Health Organization, 2016), the Norwegian translation was then translated back into English by a professional translator, and discrepancies were further discussed with the mental health experts until a satisfactory version was reached. In order to assess potential cultural and linguistic differences in expressing anxiety symptoms (Màrquez-Gonzàles et al., Reference Màrquez-Gonzàlez, Losada, Fernàndez-Fernàndez and Pachana2012), the resulting Norwegian version was presented to a small panel of healthy older adults recruited from a retirement association (6 women, 1 man, age range 62–78 yrs.). The panel was asked to comment on the items and the face validity of the scale, with two clinical psychologists guiding the discussion. Although the panel pointed out a few “difficult” items (e.g. with regard to “I sometimes feel a great knot in my stomach” the panel suggested that some people may feel the knot in their chest or throat rather than in stomach), the conclusion was that all items were meaningful and understandable. Thus, no further revisions were made.
Participants
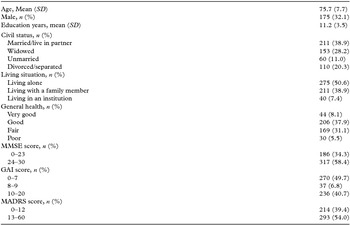
The sample comprised in- and out-patients from four departments of geriatric psychiatry in Oslo, Norway, 368 women (67.8%) and 175 men (32.1%). Mean age was 75.7 (SD = 7.7, range 51–95). On average, the participants had 11.1 years of education (SD = 3.5). Socio-demographic and clinical characteristics of the sample are presented in Table 1. About one-half of the participants (50.6%) were living alone, and 38.9% were married or cohabiting with a partner. A smaller proportion lived in nursing homes, 7.4%; while 41.6% were receiving home-based nursing care. General health was rated as “good” or “very good” for 46.0% of the sample, and “poor” for 5.5%.
Socio-demographic and clinical characteristics

Measures
The GAI (Pachana et al., Reference Pachana, Byrne, Siddle, Koloski, Harley and Arnold2007) is a 20-item scale measuring anxiety symptoms among older adults. In the present study, Cronbach's α was 0.94. The Cronbach's α for participants with an MMSE-NR score below 24 was 0.95. Mean GAI score was 8.2 (SD = 6.5), and 47.5% scored over the cut-off of eight, suggesting the presence of an anxiety disorder (Byrne et al., Reference Byrne, Pachana, Goncalves, Arnold, King and Khoo2010). See http://gai.net.au/ for an introduction to the GAI.
The Geriatric Anxiety Inventory short form (GAI-SF; Byrne and Pachana, Reference Byrne and Pachana2011) is a five-item measure based on the original GAI scale. In the present study, Cronbach's α was 0.84. The Cronbach's α for participants with an MMSE-NR score below 24 was 0.87.
The Mini-Mental State Examination (MMSE-NR; Strobel and Engedal, Reference Strobel and Engedal2008) is a standardized interview measuring cognitive functioning among older adults. The total score ranges between 0 and 30, and a score below 24 is interpreted as most likely indicating cognitive impairment. Mean MMSE score was 23.9 (SD = 4.4, range = 4–30), and 34% had a score compatible with cognitive impairment (<24). It should be noted that the GAI has been used successfully as a self-report instrument for those with possible cognitive impairment (Boddice et al., Reference Boddice, Pachana and Byrne2008; Rozzini et al., Reference Rozzini2009).
The Montgomery–Åsberg Depression Rating Scale (MADRS; Montgomery and Åsberg, Reference Montgomery and Åsberg1979) is a clinician-rated instrument with 10 items measuring core intensity symptoms of depression. Each item has a score with range from “0” to “6.” A cut-off >12 was used to classify significant depression. The mean MADRS score was 17.1 (SD=11.6, range = 0–49) and 54% had a score compatible with significant depression (>12).
General Health was evaluated by a physician using a single item score with categories “Very good,” “Good,” “Fair,” and “Poor” (Lyketsos et al., Reference Lyketsos1999).
Procedures
The data are collected from a register of patients admitted to one of four departments of geriatric psychiatry in Oslo, Norway. Due to the fact that the sample is drawn from an ongoing register study, our samples only partially overlap with the sample used by Bendixen et al. (Reference Bendixen, Hartberg, Selbæk and Engedal2016). Importantly, the rationale for the studies and statistical methods applied, differ substantially. However, for an overview of the procedure for handling the register data, see Bendixen and Engedal (Reference Bendixen and Engedal2015) and Bendixen et al. (Reference Bendixen, Hartberg, Selbæk and Engedal2016).
Ethical consideration
The study was approved by the Regional Ethics Committees, REK Sør-Øst and REK-Vest.
Statistical analysis
All analysis was conducted with the statistical software R (R Core Team, 2016). As a start, we conducted a confirmatory bifactor analysis using the specific three-factor solution reported in the Spanish version of GAI (Màrquez-Gonzàlez et al., Reference Màrquez-Gonzàlez, Losada, Fernàndez-Fernàndez and Pachana2012), by using the mirt package in R.
Furthermore, evaluating essential unidimensionality through a strong general G factor (Reise, Reference Reise2012) was conducted using the common variance (ECV) defined as the ratio of explained variance by the G factor, divided by the variance explained by both the general factor and the specific factors. The index “coefficient omega hierarchical” (ωH) (Reise, Reference Reise2012) was also applied for this purpose. The ωH was estimated using the omegaSem function of psych package in R. This function performs an exploratory analysis and then takes the highest loading items on each factor and performs a CFA using the sem package. Hence, the latter also allowed us to compare two different models (the three-factor model reported by Màrquez-Gonzàlez et al. (Reference Màrquez-Gonzàlez, Losada, Fernàndez-Fernàndez and Pachana2012) – “The Spanish model” – vs. an “exploratory/confirmatory model” (“E–C”)), and this makes it possible to establish item parameter invariance through roughly demonstrating overlapping model solutions (Reise, Reference Reise2012).
The assumptions inherent in a Rasch model are that of unidimensionality, local independence and latent monotonicity. Furthermore, in a Rasch model, the person ability and the item difficulty are evaluated along the same latent trait, and each item is expected to have equal discrimination and different difficulty, and each respondent has a latent trait corresponding to an item difficulty.
Rasch models are evaluated through different fit indices. Infit and outfit values above 0.6 and below 1.4 indicate good fit. The eRm package in R was used for the above Rasch analysis.
Yen's adjusted Q3 is a formal and recommended test of local dependency (Finch and French, Reference Finch and French2015). It is possible to control for multiple testing, and effect size measures of model fit are available. A correlation of ±0.20 indicates violations of local independence (Finch and French, Reference Finch and French2015). The TAM package in R was used for modeling aQ3.
The DIF procedure tests whether the probability of answering “yes” – or passing an item – is different for various subgroups, when the subgroups have the same scores (matched) on the latent trait. That is, when a group of men and women have the same sum score on GAI, they should have the same probability of answering any specific GAI item, across the scale (e.g. for any sum score). We tested the subgroups sex (female = 1), MMSE (cutoff > 23) and MADRS (cutoff > 12), using logistic regression, using the difR package in R. Uniform DIF refers to item difficult parameters being different between the comparison groups, while non-uniform indicates that the item discrimination parameter is different between the comparison groups. The DIF estimates are classified according to effect size as “A” (negligible effect), “B” (moderate effect), and “C” (large effect”).
Results
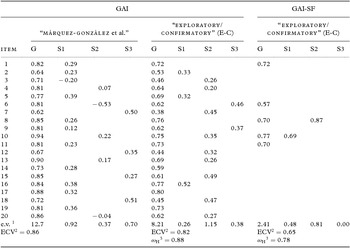
In Table 2 the bifactor models for the GAI and the GAI-SF are presented. In both models of the GAI, the general factor G was strong in comparison with the specific factors. For both models the ECV is high, “Spanish” = 0.86 and “E-C” = 0.82. For the latter, the “coefficient omega hierarchical” was 0.88, thus supporting the use of a general factor solution. For the specific factors, both bifactor models came out with three separate factors, one specific factor with most items indicating worry, another specific factor with items indicating somatic symptoms, while the third specific factor seems to be related to being bothered by little things, and/or worrying about trivial things. Hence, the models seem to give roughly overlapping factor solutions.
Bifactor models of GAI and GAI-SF

1 e.v. = explained variance, 2 common variance, 3“coefficient omega hierarchical.”
For the bifactor model of the GAI-SF, the “coefficient omega hierarchical” (0.78) supported a strong general factor. However, Items 8 (“I think of myself as a worrier“) and 10 (“I often feel nervous”) comprise specific factor loadings, with each item resembling unique specific factors. Notably, Item 8 forms a very strong specific factor in addition to its loading on the general factor.
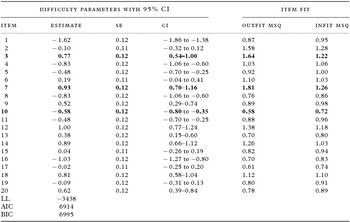
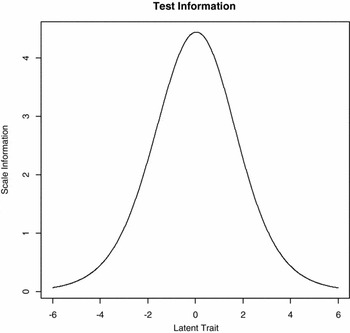
A summary of the results for the Rasch (1Pl) model of the GAI is given in Table 3. Item 1 (“I worry a lot of the time”) is the easiest item (b = −1.62 (SE = 0.12), and Item 12 (“I can get an upset stomach due to my worrying”) the most difficult (b = 1.00, SE = 0.12). The terms “easiest” and most “difficult” item on the GAI measure refers to how prevalent the answer yes was to the items across the scale and sample. The more prevalent, the more easy an item is. Furthermore, many items had overlapping item difficulty parameters on the latent trait, as can be seen from Table 3. Regarding item fit, Items number 3 (“I often feel jumpy “), 7 (“I often feel like I have Butterflies in my stomach”), and 10 (“I often feel nervous”) showed indication of bad fit due to the outfit statistics. The accuracy of the GAI was equal to 0.78, with sensitivity at 0.77 and specificity at 0.79. Area under ROC was estimated to 0.86. Test information can be seen in Figure 1.
A Rasch (1Pl) model of GAI

The test information curve indicates that the GAI covers the latent anxiety dimension approximately from minus two to plus two.

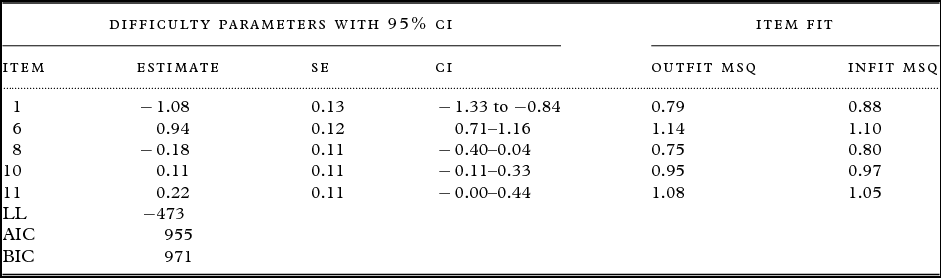
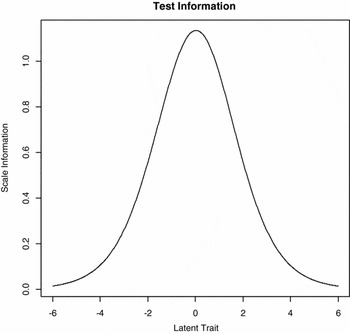
The summary of the results for the Rasch (1Pl) model of the GAI-SF is presented in Table 4. Item 1 (“I worry a lot of the time”) was the easiest, with item difficulty “b” = −1.08 (SE = 0.013), and Item 6 (“Little things bother me a lot”) the most difficult, b = 0.93 (SE = 0.12). Furthermore, the other three items (8, 10, and 11) were lumped together around zero, or around the middle value of the latent scale. The infit and outfit values were within the normal range for all items. The accuracy of the GAI-SF was equal to 0.74, with sensitivity at 0.79 and specificity at 0.68. Area under ROC was estimated to 0.82. Test information for the GAI-SF can be seen in Figure 2. Comparing the full scale with the short form, the test information curves indicate that both scale forms cover the same latent dimension, approximately from −2 to + 2.
Summary of a Rasch (1PL) model of GAI-SF

The test information curve indicates that the GAI-SF covers the latent anxiety dimension approximately from minus two to plus two.

The summary of adjusted Q3 for the GAI indicates some violations of local independence (SRMR = 0.084). In total, 6 of 190 possible residual correlations indicated violation of local dependence. The highest positive violation was for Item-pair 10 and 15 (aQ3 = 0.30). The second highest was for Item-pair 7 and 18 (aQ3 = 0.27), thereafter followed Item-pair 10 and 13 (aQ3 =0.25), Item-pair 6 and 9 (aQ3 = 0.25), Item-pair 1 and 8 (aQ3 = 0.23), and finally Item-pair 16 and 17 (aQ3 = 0.22).
The analysis of Yen's aQ3 and local dependent item-pairs in GAI-SF showed that there were no item-pair violations for the residual correlations.
For the GAI, the DIF analysis of sex indicated neither uniform nor non-uniform DIF. The uniform DIF analysis of MMSE indicated that the difficulty parameters on Items 2, 7, and 16 were significantly different comparing groups according to the established threshold of MMSE. However, the effect size of the result was negligible (“A”) for all three items. As for the non-uniform DIF, or the comparison of different discrimination parameter functioning across MMSE, there was a significant DIF for Item 18, but here also the effect size of the results was negligible (“A”).
For the GAI, the uniform DIF analysis of depression indicated that the difficulty parameters on Item 5 and Item 17 were significantly different across the subgroups. However, the results indicated that this effect was negligible (“A”) for both items. As for the non-uniform DIF, or different discrimination parameter functioning across MADRS, the test was significant for Items 14 and 15. However, here also the effect size of the results was negligible (“A”) for both items.
For the GAI-SF, the DIF analysis of sex, MMSE, and MADRS were all non-significant, thus indicating neither uniform nor non-uniform DIF.
Discussion
Overall, the two bifactor models demonstrated strong support for a unidimensional structure of the GAI. While there was support for several sub-dimensions, the majority of the variance was explained by the general “G” factor. Thus, our results support the notion that the GAI is essentially unidimensional, but with some specific factors as well (Reise, Reference Reise2012). The finding of a strong G factor and concurrent specific factors may also explain the mixed and different factor solutions previously reported (Byrne and Pachana, Reference Byrne and Pachana2011; Màrquez-Gonzàlez et al., Reference Màrquez-Gonzàlez, Losada, Fernàndez-Fernàndez and Pachana2012; Diefenbach et al., Reference Diefenbach, Bragdon and Blank2014; Yan et al., Reference Yan, Xin, Wang and Tang2014; Johnco et al., Reference Johnco, Knight, Tadic and Wuthrich2015; Guan, Reference Guan2016; Loynachan et al., Reference Loynachan, Lee, Lamb and Pyykkonen2016). Based on these results we recommend using a sum score of all items due to the demonstration of a very strong G factor as a basis for assessment.
The Rasch model fitted for the GAI seemed to fit reasonably well for the majority of the items. There were some exceptions, however. Items 3, 7, and 10 had item fit violations. However, it should be noted that the outfit statistics are susceptible to the influence of outliers, and that for this reason infit statistics in general are more emphasized over outfit statistics (Bond and Fox, Reference Bond and Fox2007; Molde et al., Reference Molde, Hystad, Pallesen, Myrseth and Lund2010). As such, all infit values are within the recommended values within the range 0.6–1.4, thus indicative of a well-fitting model, i.e. the ordering of symptom severities fits well with the Rasch model.
There were also item pairs where the residual correlations indicated violations of local independence. Items 7 and 18 loaded all on sub-dimensions in the two bifactor models; hence for these items there is a logical explanation of why they violate the assumption of unidimensionality. Three other items and item-pairs seem to contain some common trivial similarity, like Item-pair 1 (“I worry a lot of the time”) and 8 (“I think of myself as a worrier”); Item-pair 6 (“Little things bother me a lot”) and 9 (“I can't help worrying about even trivial things”), and Item-pair 10 (“I often feel nervous”) and 15 (“I often feel shaky inside”). For the two latter item pairs, these loaded both on a general factor and comprised specific factors as well, in one of the bifactor models. For the other item-pair violations, like Item 10 (“I often feel nervous”) and Item 13 (“I think of myself as a nervous person”), there are both trivial content similarities in addition to loadings on a general factor as well as on a specific factor. The same was true for Item-pair 16 and 17. Thus, both trivial similarity in content and the loadings on specific factor(s) may possibly explain the violations of unidimensionality overall, or in general. It should be noted that former studies reporting factor analysis of GAI have not reported any formal test of unidimensionality, by using residual correlations as recommended. Hence, it is not an option to compare our results in that respect to other studies. In light of the above notions, our conclusion is that the GAI fulfills the properties in a Rasch model reasonably well enough to allow for interval scoring. Normally, when computing a sum score of a scale, one calculates an arithmetic mean score, which actually assumes equality of intervals inherent in the scale. However, often the sum score is calculated by converting data from a lower (ordinal) to a higher (interval) level of measurement in psychological research. Thus, our results ensure that one may create sum scores with true interval scale properties for the GAI.
For the GAI-SF, the bifactor model also supported a strong G factor, while at the same time several specific factors were found. The Yen's aQ3 statistics indicated no violations of local independence. Hence, our conclusion regarding the GAI-SF is that a total sum score based on interval scoring seems appropriate here as well.
For the full GAI, the item overlap is substantial, indicating several superfluous items, or items that do not provide any additional information to the scale. The same is true to a certain extent for GAI-SF, where Items 8, 10, and 11 lumps together around zero at the latent scale. The results imply that there are areas of anxiety that are not equally well measured or covered by the GAI, or that there are parts or areas of anxiety that the scale does not discriminate equally well among. This is most probably not unique for the GAI, however, a challenge to the measurement and development of anxiety measures in general.
Furthermore, comparing the sensitivity and specificity of the full form versus the short form, there was just a small difference favoring the full form. However, the area under the curve estimate supports a notion that the information provided by the full form is not much different from that of the short form. All in all, the data favor the use of a short(er) scale. As Byrne and Pachana (Reference Byrne and Pachana2011) has pointed out, the use of GAI-SF may be especially feasible in acute geriatric settings used as a screening tool, or in larger-scale epidemiological surveys, due to the need of saving space for administering several questionnaires at the same time.
Regarding the evaluation of the GAI, we must ask, for what purposes do we want to use this measure, or what aspects of anxiety do we wish to cover? Such questions are highly relevant in the clinical contexts where the GAI scale is used. Are we looking for more specific diagnostic entities, or are we looking for easily accessible and valid screening test to measure sub-threshold anxiety in the community? If revisions are to be undertaken, the above notions should be asked a priori, that is, before one starts looking for possible candidate items. One suggestion to be drawn from our results is that in order to develop an even more discriminative anxiety scale, one should look for items that place themselves across a broader spectrum, covering different parts of a latent anxiety area. Another suggestion is if a “pure” unidimensional scale is preferred, one could omit the items loading more strongly on the subscales. Another option is also to drop both redundant items and subscale items, developing a new short strictly unidimensional version of GAI. Our conclusion is that neither is strictly necessary, but that the first option is the most wanted. In our view, such a revision is perhaps the most clinically relevant related to screening anxiety in both clinical and community samples of older adults.
As for different item functioning across sex and subgroups of participants below or above the clinical cutoff of MMSE and MADRS, the overall negligible effect size for the significant items overall is reassuring. Hence, both forms of the GAI function well across subgroups of sex, MMSE, or MADRS.
Strengths and limitations
The strength of the study is a relatively large sample size of geriatric psychiatry in-and-out-patients, with an adequate range of scores on all target measures. However, the translation of an inventory from one language to another may represent a risk that the item and scale properties are disturbed or changed due to differences in the understanding of item content. Hence, it is recommended that the results of this study are compared or replicated within other communities and clinical samples from different cultural and language contexts. One could also test the accuracy and ROC information of the scale using various diagnostic entities, for example, different anxiety disorders (e.g. Generalized Anxiety Disorder).
Conclusion
The full version of the GAI and the GAI-SF both have a strong G factor, overall supporting a unidimensional construct and the use of an interval sum score across all items. There is also no noticeable sign of DIF for subgroups of gender or for groups of participants according to cut-offs on the MMSE or MADRS scales. The GAI and GAI-SF cover much of the same latent trait, and in the GAI scale several items seem to be redundant.
Conflict of interest
None
Description of author's roles
The study was conducted in cooperation between the co-authors. Professor Knut Engedal and Anette B. Bendixen provided the data from a register study (see also Bendixen, and Engedal (Reference Bendixen and Engedal2015)). Professor Torbjørn Torsheim is a professor in psychometrics and delivered valuable advice on the analysis. All the authors have been involved in discussion and writing of the paper.
Acknowledgments
None.