Introduction
Chromium (Cr) is an essential ultra-trace element for humans and laboratory animals (Mertz, Reference Mertz1993), which increases glucose tolerance, potentiates insulin action and, thus, shunts more energy towards growth and production (Swanson et al., Reference Swanson, Harmon, Jacques, Larson, Richards, Bohnert and Paton2000). The biological efficacy of organic Cr compounds in stressed ruminants is well documented although the results with non-stressed ruminants are variable (Chang and Mowat, Reference Chang and Mowat1992; Bunting et al., Reference Bunting, Fernandez, Thompson and Southern1994; Kitchalong et al., Reference Kitchalong, Fernandez, Bunting, Southern and Bidner1995; Gentry et al., Reference Gentry, Fernandez, Ward TL White, Southern, Bidner, Thompson, Horohov, Chapa and Sahlu1999). Inorganic Cr salts like chromic chloride (CrCl3) are relatively less available for absorption (Mordenti et al., Reference Mordenti, Piva and Piva1997) and hence are of little biological significance. However, some recent publications indicate that supplementation of CrCl3 may also improve growth and productive performance in non-stressed goats (Paul et al., Reference Paul, Haldar and Ghosh2005; Haldar et al., Reference Haldar, Ghosh, Pakhira and De2006), dairy heifers (Biswas et al., Reference Biswas, Haldar, Pakhira, Ghosh and Biswas2006) and broiler chickens (Ahmed et al., Reference Ahmed, Haldar, Pakhira and Ghosh2005). Additionally, little difference in glucose tolerance was observed when goats were supplemented with CrCl3 or Cr–yeast complex (Haldar et al., Reference Haldar, Samanta, Banarjee, Sharma and Ghosh2007). Insulin action was intensified in calves supplemented with Cr-nicotinic acid or CrCl3 and the response was identical in both the treatment groups (Kegley et al., Reference Kegley, Spears and Brown1997). Nevertheless, the issues concerning the circumstances in which ruminants get the maximum benefit from Cr supplementation and the size of that benefit are still debatable.
The peste des petits ruminants (PPR) is a caprine disease simulating rinderpest, which causes havoc mortality and severe morbidity in goat flocks. Despite the development of a successful vaccine (Singh et al., Reference Singh, Bandopadhyay, Sreenivasa and Dhar2004a and Reference Singh, Sreenivasa, Dhar, Shah and Bandopadhyay2004b), the dwarf Bengal goats are at the niche of susceptibility to PPR and hence secondary measures augmenting immunity against PPR in Bengal goats remain a pertinent issue. The immune-enhancing capability of Cr in ruminants receiving vaccine antigens (Ag) may be exploited to potentiate the immune response of goats receiving primary vaccination against PPR (Burton, Reference Burton1995). However, to our knowledge research involving sero-monitoring of goats supplemented with Cr and vaccinated against PPR has not been done yet.
In the present study, dwarf black Bengal goats (Capra hircus) were supplemented with 0.5 mg Cr as CrCl3 for 60 days and their gross performance and different hematological and serum biochemical traits were measured. The objectives of the experiment were to measure the effects of supplemental CrCl3 on (i) glucose utilization and insulin kinetics during an intravenous glucose tolerance test (IVGTT), and (ii) the primary antibody (Ab) response due to vaccination against PPR in dwarf black Bengal goats.
Material and methods
Animals and treatments
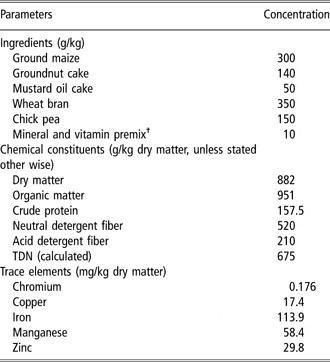
Castrated male black Bengal goats (n = 12, average age 10 months, initial mean body weight (BW) 9.1 ± 0.79 kg) maintained by the experimental farm of the Department of Animal Nutrition, University of Animal and Fishery Sciences, were selected with minimum possible intra-flock variation in terms of age and BW. The goats were apparently disease-free at the start of the experiment and were physically acclimatized to the experimental setup. Nevertheless, as adaptation, the goats were withdrawn from pasture 30 days prior to the beginning of Cr supplementation and were fed with a concentrate mixture (Table 1) that constituted the sole feed for the animals later during the experimental and post-supplementation periods. The goats were vaccinated against goat pox a fortnight before the supplementation began. Rectal temperature was checked and any exceeding 40°C was treated with paracetamol and kept under surveillance till the temperature returned to the normal level (~39°C). The goats were treated for internal and external parasites with ivermectin (Ivomec™; Virbac Animal Health India Pvt. Ltd, Kolkata, India, 0.2 mg/kg BW administered subcutaneously) and were exercised moderately on a concrete yard adjoining the experimental house. The experimental flock was divided into two treatment groups (n = 6 per group), which were placed in separate pens each measuring 4 m × 4 m. During feeding the goats were placed in individual crates (1.2 m × 0.6 m) designed for feeding and watering of the goats. Measured quantity of the concentrate was offered in feed troughs at 0800 and 1500 h and the orts were quantified after 2 h of each feeding. Water for drinking was offered ad libitum. Plastic feed troughs and pans were used for feeding and watering, respectively, and all the metal structures were plastic coated. Samples of the diet and the orts were collected daily in polyethylene sachets and pooled at monthly intervals for analysis of dry matter (DM), organic matter (OM), nitrogen (N) and CP (methods 942.05 and 984.13 of AOAC, 1995), NDF and ADF (Van Soest et al., Reference Van Soest, Robertson and Lewis1991).
Ingredients and chemical composition of the basal diet

TDN=total digestible nutrients.
†Vitamin premix provided the following 100 kg−1 of diet: Vitamin A (82 500 IU), B2 (50 mg), D3 (12 000 IU), K (10 mg), 10 g; vitamin B complex (B1, B6 and B12, pantothenate and niacin) and vitamin E, 20 g. Mineral premix provided per 100 kg of diet: NaCl, 400 g; NaHCO3, 100 g; CuSO45H2O, 6 g; CoCl26H2O, 0.44 g; ZnSO47H2O, 32 g; FeSO47H2O, 21 g; MnSO4H2O, 33 g; mixed in a di-calcium phosphate base.
The goats were weighed at −1, 0, 59 and 60 days of Cr supplementation before morning feeding and the weights from two consecutive days were averaged. Total BW gain and average daily gain (ADG) in live weight was calculated. Feed conversion ratio (FCR) was calculated as the ratio of total feed intake over total gain in live weight in 60 days.
At the end of adaptation (day 0), Cr supplementation started and the goats were fed with the basal concentrate (control) and supplemented with 0.5 mg Cr (+Cr) for 60 days (experimental period) as chromic chloride hexahydrate (CrCl3.6H2O, molecular weight 266.45, minimum assay 97%; Hi-Media Laboratories Ltd, Mumbai, India). Accurately weighed 0.2563 g CrCl3, 6H2O was thoroughly mixed with ground corn (approximately 100 g) and the volume was made up to 500 g with ground corn in a mechanical blender. From this stock exactly 5 g was packed in paper sachets and fed to individual goats, trained to consume the sachets voluntarily, before the morning feeding. The corn used for this purpose was crushed initially in a pestle and mortar and then ground in a small-capacity custom-made mechanical grinder with blades made of reinforced plastic.
At the end of Cr supplementation, the goats continued to receive the same basal concentrate for 30 more days, only with the exception that the supplemental Cr was withdrawn in the +Cr dietary group (post-supplementation period). During the adaptation, experimental and the post-supplementation periods, the goats did not show any apparent sign of illness. Rectal temperature was checked fortnightly and feces were regularly examined for cestode and nematode infestations.
Intravenous glucose tolerance test
An IVGTT was performed on day 55 (Kaneko et al., Reference Kaneko, Harvey and Bruss1997). The test was done on two consecutive days with three goats from each treatment group being tested everyday. The goats were fitted with sterile indwelling jugular catheters of 14-gauge dimensions (Jelco™, Johnson and Johnson, Mumbai, India) the day prior to the IVGTT. A 30-cm piece of 18-gauge thin-walled Teflon tube was introduced through the catheter into the jugular vein and the catheter was sutured to the skin. Catheter patency was maintained by a single flushing with heparinized normal saline (100 IU heparin/ml; Hi-Media Laboratories Ltd). After an overnight fast the pre-challenge blood samples (0 min) were collected following which an intravenous bolus dose of glucose (0.5 g/kg BW as 50% sterile solution of dextrose anhydrous; E-Merck India Ltd, Mumbai, India) was administered at ambient temperature within a period of 30 s and this was immediately followed by a 10 ml normal saline flush. Blood samples were collected 15, 45, 60 and 90 min post-infusion in sterile glass vials that were placed immediately in ice and the serum was separated for glucose and insulin assay. The peak serum concentration of glucose and insulin following the glucose infusion was determined and the clearance rate (k) for glucose and insulin was calculated (Kaneko et al., Reference Kaneko, Harvey and Bruss1997) as follows:

in which k (% per min) is the fractional turnover rate (or clearance rate) of serum glucose or insulin as calculated from the natural log (ln) of their circulating concentrations between t 1 (the time of attaining the peak serum concentration, which was 15 min and 45 min post-infusion, respectively, for glucose and insulin) and t 2 (the time at which the last sample was collected, i.e. 90 min post-infusion). The serum half-life (T 1/2) was calculated as follows:

where T 1/2 is the half-life (min) of serum glucose or insulin and k is the calculated fractional turnover rate determined between t 1 and t 2.
Blood collection and serum assay
Blood collections were scheduled to reflect the serum concentrations of insulin, cortisol, glucose and Cr during the experimental and post-supplementation periods. Peripheral blood samples were collected at 0700 h from all the goats following an overnight fast by jugular venipuncture at the start (days −1 and 0) and at the end (days 59 and 60) of Cr supplementation, and on days 10, 20 and 30 post-supplementation for biochemical, hormonal and immunological assays. An area measuring approximately 4 cm × 5 cm over the skin of the jugular vein was shaved and disinfected with 70% alcohol. A sterile 14-gauge × 5 cm silicon catheter (Jelco™, Johnson and Johnson) was inserted into the jugular vein through the disinfected area. The catheter was flushed with a 6% sodium citrate–saline solution (weight/volume) to maintain the patency. After a rest period of 30 min, approximately 10 ml whole blood was collected in sterile tubes containing either Na-EDTA (1 mg/ml whole blood; E-Merck India Ltd) or no anticoagulant. The latter tubes were placed immediately in ice for 60 min to clot the blood. No glucose oxidation inhibitor was used during the clotting period. The serum was separated from the cells by centrifuging the clotted blood at 3000 rpm (Remi Laboratory Centrifuge, Model R-8C; Remi Motors, Mumbai, India) and the serum thus harvested was divided into aliquots and transferred into 10-mm × 35-mm polystyrene tubes (Hi-Media Laboratories Ltd), capped and stored (−20°C). Serum samples designated for immunological assay were stored separately.
Commercial kits were used for cortisol (Equipar Diagnostica, Saronno, Varese, Italy), insulin (Monobind Inc., California, USA) and glucose (E Coline in vitro diagnostic kits; E-Merck India Ltd) assays. Concentration of insulin (μl/ml) and cortisol (ng/ml) was determined in duplicate in a plate ELISA reader (Ranskan Sprint Elisa; Ranbaxy, New Delhi, India) using streptavidin-coated wells with sample sizes of 100 μl. The intra-assay variation for cortisol and insulin was 5.2% and 7.1%, respectively. Duplicate assay for glucose was performed photometrically in an automatic blood analyzer (Microlab 200, E-Merck; Vital Scientific, The Netherlands) and measurements with more than 7% intra-assay variation were reanalyzed.
Chromium in serum was detected in an atomic absorption spectrophotometer (Perkin Elmer A Analyst 100, Perkin Elmer Inc., Wellesley, MA, USA) by direct aspiration of undiluted samples into the instrument.
Hematological studies were performed from samples collected in Na-EDTA. Blood smears prepared within 24 h of collection on grease-free glass slides were stained with Leishman’s stain (containing eosin and methylene blue, 1 mg/ml methyl alcohol) and observed under oil immersion of a microscope at 100× magnification. At least 200 leukocytes were counted under each microscopic field and the mean of 10 such fields was considered as the final leukocyte count for an animal. The result was expressed as percentage for each type of leukocyte.
Immunization and measurement of primary antibody response
The goats were immunized against PPR on day 60 (0.5 ml freeze-dried reconstituted vaccine was administered subcutaneously). The vaccination was immediately preceded by collection of blood samples according to the methodology described earlier. Subsequent samples were collected on days 10, 20 and 30 post-immunization and the serum was stored at −20°C pending Ab quantification.
The Ab response of the goats to the PPR Ag was detected by a monoclonal Ab-based competitive ELISA (Singh et al., Reference Singh, Bandopadhyay, Sreenivasa and Dhar2004a and Reference Singh, Sreenivasa, Dhar, Shah and Bandopadhyay2004). The optical density was determined in the plate ELISA reader and the results were expressed in terms of inhibition (%) calculated as follows:

Estimation of chromium and trace elements in diet
Concentration of Cr, copper (Cu), iron (Fe), manganese (Mn) and zinc (Zn) in feed was estimated in the atomic absorption spectrophotometer. Samples were oven dried (at 80°C for 16 h) and ground to pass through a 1 mm sieve. However, for estimation of Cr a part of the oven-dried sample was first crushed manually in a ceramic pestle and mortar and then ground in the custom-made grinder described earlier. The ground samples (5 g) were placed in glazed ceramic crucibles and ignited in a muffle furnace at 400°C for 4 h. The ash was treated with concentrated nitric acid under mild heat to oxidize the Cr3+ to Cr6+ for more accurate detection. The acid-extracted cooled samples were filtered through ashless Whatman filter paper (No.1). The crucibles were washed several times with de-ionized water and the final volume was made up to 10 ml for the estimation of Cr. A solution of ammonium chloride (20 g/l) was added in the standard and the samples to reduce interferences due to the presence of Fe in the samples. For the estimation of Cu, Fe, Mn and Zn in the feed and fecal samples, these aliquots were diluted further to 40 ml with de-ionized water.
Statistical analysis
The data were analyzed in the GLM of the Statistical Package for Social Sciences (SPSS, version 10, 1999; SPSS Inc, Chicago, IL, USA). Individual goats in a treatment group were the experimental units and the results were expressed in terms of mean and pooled standard error of mean (s.e.). For the measurements that were made with respect to time (live weight, total and differential leukocyte count, glucose and insulin in serum during the IVGTT, serum concentration of insulin, cortisol, glucose and Cr and the percent inhibition following PPR vaccination), the repeated measure of the GLM was applied. The said measurements in a single animal at different time intervals were the within-subject variables and the diets (control and +Cr) were the between-subject factors. A diet × day interaction was also added to the model. For the rest of the data sets (ADG, feed intake and FCR, glucose and insulin kinetics during the IVGTT), multivariate ANOVA was performed. The glucose and insulin kinetics data were analyzed with the diet and time as the fixed factors and an interaction between them was added to the model. A probability value of P < 0.05 was described as statistically significant and that at P < 0.1 was described to be tending to significance.
Results
Dietary composition, live weight change and feed conversion efficiency
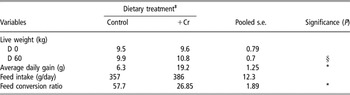
The diet was adequate in CP and total digestible nutrients (TDN) to support maintenance and moderate growth for dwarf goats (NRC, 1981). The basal diet contained 0.176 mg Cr/kg DM. The concentrations of Ca, P and trace elements were optimum or exceeded the requirements (NRC, 1981). The control and the +Cr dietary group of goats consumed 3.2 kg and 3.4 kg DM/100 kg of their respective BWs (P > 0.1). Mean daily intake (g/animal) of CP was 49.6 and 53.6 and that of TDN was 212 and 230, respectively, in the control and the +Cr dietary groups, and the difference between the groups was not significant in this regard (P > 0.1). The live weight on day 60 tended to be higher in the +Cr group of goats (P < 0.1). Consequently, ADG was also higher in the +Cr group (P < 0.05). Feed intake was not affected by dietary treatments (P > 0.1) although FCR was improved (P < 0.05) in the +Cr group of goats (Table 2).
Live weight, live weight gain and feed efficiency in goats supplemented with inorganic trivalent chromium (Cr) as chromic chloride hexahydrate (CrCl3, 6H2O)†

*Significant at P < 0.05.
†The experiment lasted for 60 days (n = 6 per treatment group).
‡The goats were fed with a basal diet devoid of supplemental Cr (control) and the basal diet supplemented with 0.5 mg Cr/kg diet (+Cr).
§Approaching significance (P < 0.1).
Differential leukocyte counts
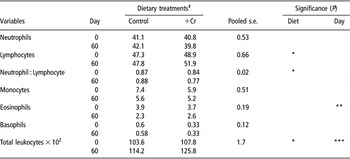
Supplemental Cr had subtle effect (P > 0.1) on the total and differential leukocyte counts (Table 3). Although the percentage of neutrophils was not affected (P > 0.1) but that of the lymphocytes increased in the +Cr group on day 60 (diet effect P < 0.05), leading to the narrowing of the neutrophil : lymphocyte ratio in the said group on day 60 (diet effect P < 0.05). Added dietary Cr did not affect the total number of monocytes, eosinophils and basophils in the +Cr group of goats (diet effect P > 0.1). However, eosinophils were reduced on day 60 compared to those counted on day 0 (day effect P < 0.01) irrespective of the dietary treatments. Compared to day 0, total leukocytes increased on day 60 in the control and the +Cr groups alike (day effect P < 0.001), and overall, the total leukocyte count was greater in the +Cr group vis-à-vis that in the control group (diet effect P < 0.05).
Differential leukocyte counts (expressed as percentage unless stated otherwise) in goats supplemented with inorganic trivalent chromium (Cr) as chromic chloride hexahydrate (CrCl3, 6H2O)†

†The experiment lasted for 60 days (n = 6 per treatment group).
‡The goats were fed with a basal diet devoid of supplemental Cr (control) and the basal diet supplemented with 0.5 mg Cr/kg diet (+Cr).
Level of significance indicated by *P < 0.05, **P < 0.01 and ***P < 0.0001.
Intravenous glucose tolerance test
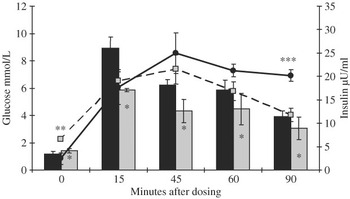
Serum glucose and insulin profiles (Figure 1) suggested that dietary supplementation of Cr elevated the basal concentrations of glucose (P < 0.05) and insulin (P < 0.01) in the +Cr group of goats compared to those in the control group. Serum glucose concentration in the control group of goats overshoot that in the +Cr group of goats following glucose infusion and remained elevated at a higher plane throughout the course of the IVGTT (P < 0.05). On the other hand, the peak circulatory concentration of insulin was similar in the control and the +Cr group (P > 0.1). At 90 min post-infusion, however, serum insulin concentration was lower (P < 0.001) in the +Cr dietary group compared to that in the control group.
Serum glucose (bars) and insulin (lines) concentrations (mean ± s.d.) after an intravenous glucose (bolus dose of 0.5 g/kg BW as 50% sterile solution) challenge in goats fed the control (solid bar and solid line) and +Cr (supplemented with 0.5 mg Cr as chromic chloride hexahydrate) diets (light bar and dashed line) for 60 days†. †The intravenous glucose tolerance test was performed on day 55 of Cr supplementation (n = 6 per treatment group). Significant difference is indicated by *P < 0.05, **P < 0.01 and ***P < 0.001.

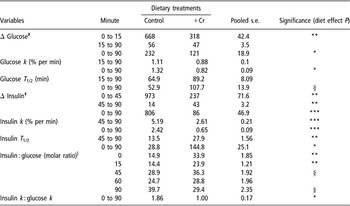
The change in serum glucose concentration (Δ glucose) between the basal and the peak levels was greater (P < 0.01) in the control group of goats although that between the peak and 90 min post-infusion was similar across the dietary treatments (P > 0.1). When calculated between 0 and 90 min post-infusion, the Δ glucose was again greater in the control group (P < 0.05) compared to that in the +Cr group of goats. Glucose k and T 1/2 between 15 and 90 min post-infusion did not vary due to dietary Cr supplementation (P > 0.1). However, when calculated between 0 and 90 min post-infusion the k was lower (P < 0.05) and the T 1/2 tended to be higher (P < 0.1) in the +Cr group of goats (Table 4).
Glucose and insulin kinetics in goats supplemented with trivalent chromium (Cr) as chromic chloride hexahydrate (CrCl3, 6H2O) during an intravenous glucose tolerance test (IVGTT)†

†The goats were fed with a basal diet devoid of supplemental Cr (control) and the basal diet supplemented with 0.5 mg Cr/kg diet (+Cr) for 60 days and the IVGTT was performed on d 55 of Cr supplementation (n = 6 per treatment group).
‡Change in circulatory concentrations following intravenous glucose infusion (expressed as a percentage of the basal concentration).
|Overall, diet effect P < 0.01, minute effect P < 0.001, diet × minute interaction P < 0.001 (pooled s.e. = 0.89).
Level of significance indicated by *P < 0.05, **P < 0.01 and ***P < 0.0001; § approaching significance (P < 0.1).
Change in serum insulin concentration (Δ insulin) between 0 and 45 min post-infusion was greater (P < 0.01) in the control group of goats while that between 45 and 90 min post-infusion was greater in the +Cr group of goats (P < 0.01). Overall, Δ insulin between 0 and 90 min post-infusion was greater (P < 0.001) in the control group of goats compared to that in the +Cr dietary group. The insulin k between 45 and 90 min, and 0 and 90 min post-infusion was lower in the +Cr group of goats (P < 0.001). Insulin T 1/2, on the other hand, was greater in the +Cr group between 45 and 90 min (P < 0.01), and 0 and 90 min (P < 0.05) post-infusion (Table 4).
The insulin : glucose molar ratio during the IVGTT widened in the control group as the time post-infusion elapsed although that in the +Cr group of goats was fairly constant throughout the IVGTT (diet effect P < 0.01, diet × minute interaction P < 0.001). The ratio between the insulin k and glucose k between 0 and 90 min post-infusion was narrower (P < 0.05) in the +Cr dietary group compared to that in the control group (Table 4).
Serum concentrations of hormones, glucose and chromium
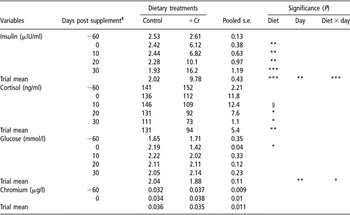
The pre-supplementation serum concentration of insulin, cortisol and glucose was similar (P > 0.05) across the dietary treatments (Table 5). Circulatory insulin at the end of the experimental period (day 60) was higher (diet effect P < 0.001) in the +Cr group of goats than that in the control group. Circulatory insulin concentration in the +Cr group was maintained at a higher level compared to that in the control group till the last measurement on day 30 post-supplementation. Moreover, during day 0 to day 30 post-supplementation, serum insulin increased in the +Cr group while that in the control group declined during the corresponding period (day effect P < 0.01, day × diet interaction P < 0.001).
Serum concentrations (61 to 90 days post-supplementation) of insulin, cortisol and glucose in goats supplemented with trivalent chromium (Cr) as chromic chloride hexahydrate (CrCl3.6H2O)†

†The goats were fed with a basal diet devoid of supplemental Cr (control) and the basal diet supplemented with 0.5 mg Cr/kg diet (+Cr) for 60 days (n = 6 per treatment group).
‡Indicates the days post Cr supplementation. Days −60 and 0 indicate the start and termination of supplementation.
Level of significance indicated by *P < 0.05, **P < 0.01 and ***P < 0.0001; § approaching significance (P < 0.1).
Supplementation of Cr for 60 days did not affect serum cortisol concentration as was evidenced from the terminal measurement at the end of Cr supplementation (day 60 or in other way, day 0 post-supplementation). However, compared to the control group, serum cortisol was lower in the +Cr dietary group on days 10 (P < 0.1), 20 (P < 0.05) and 30 (P < 0.01) of the post-supplementation period. Overall, circulatory cortisol decreased due to Cr supplementation (diet effect P < 0.001) although significant day and day × diet interaction effects are lacking (P > 0.1).
Supplemental Cr had subtle effect on serum glucose concentration when the data were pooled over the experimental and the post-supplementation periods together (diet effect P > 0.1). However, at the end of supplementation (day 0 post-supplementation) serum glucose was lower (P < 0.05) in the +Cr group compared to the control group. The difference subsequently disappeared and serum glucose was found to be similar across the dietary treatments when measured on days 10, 20 and 30, post-supplementation (P > 0.1). There were significant day (P < 0.01) and day × diet interaction (P < 0.05) effects as well.
Serum Cr concentration was similar (P > 0.1) across the dietary treatments at the start of the experiment and did not change due to supplementation (diet effect P > 0.1). Neither in the control group nor in the +Cr group had the serum Cr concentration changed over the duration of the experiment (day effect P > 0.1, diet × day P > 0.1).
Primary antibody responses
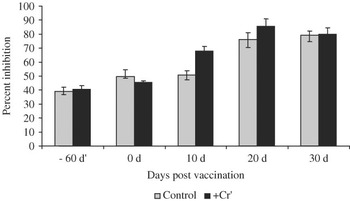
The primary Ab responses to the PPR Ag detected in terms of the percent inhibition (as described in the materials and methods) in the control and the +Cr dietary groups are presented in Figure 2. Prior to the administration of the vaccine, the inhibition in the control and the +Cr groups was similar (diet effect P > 0.5) on days −60 and 0 post-immunization. The percent inhibition increased with time (day effect P < 0.01) in both the control and the +Cr groups, being greater in the latter group on days 10 (P < 0.01) and 20 (P < 0.05) post-immunization (day × diet interaction P < 0.01). However, the difference between the control and the +Cr groups with regard to the measurement of inhibition disappeared on day 30 post-immunization (diet effect P > 0.1).
Effect of chromium (Cr) supplementation as CrCl3, 6H2O on primary antibody response (measured as percent inhibition) in goats vaccinated against peste des petits ruminants (PPR)†,‡. †The goats were fed with a basal diet devoid of supplemental Cr (control) and the basal diet supplemented with 0.5 mg Cr/kg diet (+Cr) for 60 days (n = 6 per treatment group). Days −60 and 0 indicate the start and the termination of the supplementation, respectively. The goats were vaccinated on day 0 and the percent inhibition was determined on days −60, 0, 10, 20 and 30 post-vaccination. ‡The bars indicate the inhibition (%, mean ± s.d.) of binding of the monoclonal antibody to the PPR antigen in the presence of the PPR antibody present in the test sera. The pooled mean inhibition (%) between days −60 and 30 post-vaccination was 63.9 and 69.7 (pooled s.e. 0.98) for the control and the +Cr-treated groups of goats, respectively (diet effect P < 0.001; day effect P < 0.01; day × diet P < 0.01). Significant variation between dietary treatments on days 10 (**P < 0.001) and 20 (*P < 0.05).

Discussion
Publications depicting multi-faceted benefits of supplemental Cr in human and animal nutrition are ample (Vincent, Reference Vincent2000; Pechova and Pavlata, Reference Pechova and Pavlata2007). However, trivalent Cr itself does not have the capacity to cross the cell membrane and hence has no biological or nutritional value (Borel et al., Reference Borel, Majeres, Polansky, Moser and Anderson1984). Organic ligands are required for Cr to be biologically available and active (Burton, Reference Burton1995) and this explains the responses of the lesser magnitude in broilers (Amatya et al., Reference Amatya, Haldar and Ghosh2004) and dairy heifers (Biswas et al., Reference Biswas, Haldar, Pakhira, Ghosh and Biswas2006) supplemented with inorganic Cr salts.
Supplemental Cr yields discernible effects in animals with depleted body Cr reserves (Kitchalong et al., Reference Kitchalong, Fernandez, Bunting, Southern and Bidner1995) and stressors exacerbate this depletion process (Borel et al., Reference Borel, Majeres, Polansky, Moser and Anderson1984). However, the +Cr group of goats had a higher growth rate and better FCR compared to the control group of goats despite the absence of any stress per se. This corroborated our earlier findings (Paul et al., Reference Paul, Haldar and Ghosh2005; Haldar et al., Reference Haldar, Ghosh, Pakhira and De2006) and reiterated the beneficial effects of Cr in non-stressed goats. Nevertheless, the performance data with the presently employed small experimental population should be cautiously interpreted considering the slower growth rate and the late stage of maturity.
The increment in the total leukocyte count and the percentage of lymphocytes contradicted the findings of Gentry et al. (Reference Gentry, Fernandez, Ward TL White, Southern, Bidner, Thompson, Horohov, Chapa and Sahlu1999), which reported the subtle effect of supplemental Cr-tripicolinate on differential leukocyte counts in lambs. The greater percentage of lymphocytes and the lower neutrophil : lymphocyte ratio in the Cr-supplemented goats are difficult to explain. A greater percentage of neutrophils and a wider neutrophil : lymphocyte ratio together indicate stress (Friend et al., Reference Friend, Dellmeier and Gbur1985). Supplemental Cr reportedly had no effect on these variables in steers (Kegley et al., Reference Kegley, Spears and Brown1997). However, in the present investigation the widening of neutrophil : lymphocyte ratio in the control group vis-à-vis the narrowing of the same in the +Cr group was not likely to be a sequel of stress, rather it might be due to an increased percentage of lymphocytes in the latter dietary group. Dietary Cr supplementation reportedly increased the proliferation of peripheral blood lymphocytes in vitro with or without mitogenic stimulation (Burton et al., Reference Burton, Mallard and Mowat1993; Chang et al., Reference Chang, Mallard and Mowat1994) and it is possible that supplemental Cr played the same role during the present investigation also.
The IVGTT is a practical and simple test to measure the efficiency of insulin-mediated glucose utilization in ruminants although the available publications in this regard are quite contradictory. During an IVGTT, the glucose peak indicates the tissue responsiveness to insulin and the k is suggestive of the insulin sensitivity of the tissues (Kahn, Reference Kahn1978; Sano et al., Reference Sano, Nakai, Kondo and Terashima1991). Supplementation of CrCl3 reportedly increased the k, decreased the T 1/2 (Haldar et al., Reference Haldar, Ghosh, Pakhira and De2006) and increased the area under the glucose curve (Paul et al., Reference Paul, Haldar and Ghosh2005) in goats. In contrast, a slower k with a longer T 1/2 in the +Cr dietary group in this experiment may be confused with the state of glucose intolerance although the high peak of serum glucose, which is typical of glucose intolerance, was lacking. Moreover, the basal glucose and insulin concentrations in the +Cr dietary group were higher than those in the control group of goats, ruling out the possibility of glucose intolerance (Haldar et al., Reference Haldar, Samanta, Banarjee, Sharma and Ghosh2007). Consequently, lower Δ glucose and Δ insulin across the duration of the IVGTT were observed in the +Cr dietary group. The insulin : glucose molar ratio was also suggestive of a fairly constant response in the +Cr group despite intravenous glucose infusion compared to that in the control group. Therefore, a lower k and a greater T 1/2 response in the +Cr dietary group were not unlikely. Insulin resistance occurs more due to diminished insulin responsiveness and not due to lower insulin sensitivity (Kahn, Reference Kahn1978). The serum concentrations of glucose and insulin during the IVGTT were suggestive of lower insulin responsiveness in the control group. On the other hand, the k and T 1/2 of glucose and insulin indicated towards lower insulin sensitivity in the +Cr group. The insulin : glucose molar ratio was wider at the basal and at the peak of serum glucose concentration post-infusion and indicated reduced insulin sensitivity. However, Subiyatno et al. (Reference Subiyatno, Mowat and Yang1996) reported that Cr supplementation may also increase the said ratio in post-calving cows. Bunting et al. (Reference Bunting, Tarifa, Crochet, Fernandez, DePew and Lovejoy2000) suggested that in dairy calves supplementation of Cr-picolinate may have a greater effect on increasing insulin secretion than on insulin sensitivity after a propionate loading. Striffler et al. (Reference Striffler, Polansky and Anderson1993), using perfused rat pancreas, observed that dietary Cr as CrCl3 increased insulin secretion from pancreas. The present observations, therefore, may be explained from the works cited above.
Supplemental Cr may have a direct effect on lymphocyte proliferation and the effects may be associated with insulin and cortisol interaction (Chang et al., Reference Chang, Mallard and Mowat1996). The effects of supplemental Cr on peripheral neutrophil phagocytic activity and other parameters related to innate immunity are yet to be confirmed, although the in vitro stimulation of blastogenic responses of peripheral blood lymphocytes due to Cr is encouraging (Borgs and Mallard, Reference Borgs and Mallard1998). Supplemental Cr reduced circulatory cortisol, corroborating earlier findings (Chang and Mowat, Reference Chang and Mowat1992; Moonsie-Shageer and Mowat, Reference Moonsie-Shageer and Mowat1993; Mowat et al., Reference Mowat, Chang and Yang1993; Haldar et al., Reference Haldar, Ghosh, Pakhira and De2006 and Reference Haldar, Samanta, Banarjee, Sharma and Ghosh2007), and this might have had an impact on the enhanced immune response, albeit transient, in the +Cr group of goats as reported earlier with other livestock species (Borgs and Mallard, Reference Borgs and Mallard1998). Chromium supplementation resulted in a sustainable elevation in circulatory insulin in the +Cr group of goats despite a blunted response to the insulinotropic effect of glucose during the IVGTT. The effects coupled together perhaps augmented the primary Ab response in the +Cr group following vaccination against PPR. The positive effect of supplemental Cr on the immune responses of stressed livestock is well documented (Chang and Mowat, Reference Chang and Mowat1992; Moonsie Shageer and Mowat, Reference Moonsie-Shageer and Mowat1993; Burton et al., Reference Burton, Mallard and Mowat1994; Chang et al., Reference Chang, Mallard and Mowat1996; Kegley et al., Reference Kegley, Spears and Brown1997) and the present findings, besides corroborating these observations, added further to the knowledge that immune modulation by supplemental Cr is possible in non-stressed ruminants as well.
Conclusion
The present investigation indicated that dietary supplementation of 0.5 mg Cr as CrCl3 may influence live weight gain in dwarf Bengal goats even in the absence of any stressor stimulus. The findings would have far-reaching implications while formulating supplementation strategies for meat-type goats fed to achieve a targeted growth response and are likely to be under metabolic stress throughout their productive life span. The lower glucose clearance rate during the IVGTT indicated the subtle effect of supplemental Cr on insulin sensitivity and glucose tolerance as a whole. The serum hormonal assay indicated that a Cr-mediated shift in metabolic balance more towards anabolism is possible, leading to an enhanced immune response. The study revealed further that the supplementation of Cr as CrCl3 in non-stressed goats may improve the Ab response against PPR and help confer immunity to the disease. However, the effects may be transient and hence further research with a more robust experimental design involving extended length of supplementation along with mortality and morbidity study in foci of infection is warranted.
Acknowledgment
The authors gratefully acknowledge the financial support from the Agricultural Produce Cess Fund of the Indian Council of Agricultural Research, New Delhi, India, for conducting the experiment.