I. INTRODUCTION
Laser-induced forward transfer (LIFT) is a high-resolution direct-write printing technique, which enables the deposition of a wide range of solid,Reference Bohandy, Kim and Adrian1 multiphase,Reference Piqué, Chrisey, Auyeung, Fitz-Gerald, Wu, McGill, Lakeou, Wu, Nguyen and Duignan2, Reference Piqué, Arnold, Kim, Ollinger and Sutto3 and organicReference Arnold, Serra and Piqué4–Reference Schultze and Wagner6 inks into two- or three-dimensional patterns. In conventional LIFT, the bottom of a laser-transparent substrate is coated with a donor ink film and placed above a receiver substrate.Reference Piqué, Chrisey, Auyeung, Fitz-Gerald, Wu, McGill, Lakeou, Wu, Nguyen and Duignan2, Reference Piqué, Arnold, Kim, Ollinger and Sutto3 A pulsed laser is absorbed within a confined region of the ink film, resulting in the localized transfer of material onto the receiver substrate.Reference Arnold, Serra and Piqué4 User-programmable patterns can be created by translating the donor and receiver substrates.
In instances where the active material is susceptible to photolytic damage or the ink does not strongly absorb the incident photons, a dynamic release layer (DRL) can be incorporated between the glass and the ink. For example, laser absorption within a thin metal (10–50 nm) DRL can be used to propel transfers by providing a localized heat source, which vaporizes the adjacent ink and/or the metal film itself.Reference Colina, Duocastella, Fernández-Pradas, Serra and Morenza7–Reference Brown, Kattamis and Arnold10 However, such thermally induced ejections can lead to pyrolytic damage in certain ink materials.Reference Kattamis, McDaniel, Bernhard and Arnold11 By utilizing DRL that undergo low-temperature vaporization, such as triazene polymer,Reference Fardel, Nagel, Nüesch, Lippert and Wokaun12, Reference Xu, Liu, Cui, Gerhold, Wang, Nagel and Lippert13 nanoparticle films,Reference Ko, Pan, Ryu, Misra, Grigoropoulos and Park14 or functional release layers,Reference Birnbaum, Heungsoo, Charipar and Piqué15 this thermal damage can be mitigated. However, the ink is still directly exposed to the gaseous decomposition products, which may lead to further contamination issues.
To enable the deposition of ink materials that are sensitive to photolytic and pyrolytic damage or to contamination from ablated DRL fragments, a thick (2–10 μm) polyimide layer can be incorporated between the glass and ink.Reference Brown, Kattamis and Arnold16 Upon pulsed laser irradiation, a rapidly expanding polymer blister forms and imparts momentum to the adjacent ink layer, inducing transfer. This blister-actuated LIFT (BA-LIFT) mechanism is fundamentally different from that which occurs in traditional DRLs in that the outer layer of the film remains sealed, protecting the ink from direct heating and contamination from the ablation species.Reference Brown, Kattamis and Arnold10 In addition, the large film thickness and small thermal diffusivity of the polymer minimize heat diffusion through the polymer/ink interface, further reducing the chance for damage. These qualities enable the deposition of material systems that are especially prone to damage during transfer, such as delicate embryonic stem cellsReference Kattamis, Purnick, Weiss and Arnold17 and organic light-emitting molecules.Reference Kattamis, McDaniel, Bernhard and Arnold11, Reference Kattamis, Purnick, Weiss and Arnold17, Reference Kattamis, McDaniel, Bernhard and Arnold18 At sufficiently high laser fluences (Fl), blister rupture can occur, permitting ablated species to interact with the ink.Reference Brown, Kattamis and Arnold10 The occurrence of blister rupture is still not well understood, nor is the dependence of polymer film material properties and the laser/material interaction on the observed blister dynamics. Therefore, a physically accurate numerical model of the blister dynamics during BA-LIFT would enable a fundamental understanding of the process and provides a useful platform to conduct future parametric studies helping to optimize the printing process.
In this work, we use finite element analysis (FEA) to model the dynamics of laser-induced blister formation on a thick polyimide film. Experiments are first carried out to measure blister size and shape as a function of laser fluence and time for a 7-μm polymer film. Based on these results, strain-rate-dependent material parameters are determined for the polyimide, providing insight to the polymer’s mechanical behavior at high strain rates. The conversion efficiency of laser energy into pressure–volume work done by the enclosed gas is then estimated by matching blister heights generated by the model to the experiments. These procedures establish all free parameters required to model the initial stages of blister growth for an arbitrary polyimide film thickness and laser beam shape. To verify the model accuracy and predictability, results are compared to 3-μm-thick polyimide film experiments and are shown to coincide with the simulated blister shape and size without the need for additional fitting parameters. Finally, the conditions for blister rupture are investigated, and the ability to capture this phenomenon in the model is demonstrated.
II. FINITE ELEMENT MODEL
The dynamic response of blister formation is modeled by means of structural FEA in ANSYS®. In this FEA, model geometry is converted into a discrete number of elements, each composed of four nodes (quadrilateral element). Initial conditions and boundary conditions are applied to relevant nodes in the form of nodal forces and nodal constraints. Both element stiffness and mass matrices are computed at each time step in terms of the elements local coordinate system, converted to global coordinates, and finally assembled into their global matrices. Finite element equilibrium equations relating the nodal forces to the model stiffness, mass, damping, and kinematics are then used to determine the time-dependent nodal displacements. These are derived from a momentum balance on a structural element, incorporating initial conditions and boundary conditions. Details can be found in the literature.Reference Moaveni19 Finally, element strain and stress in the polymer is determined through strain/displacement and constitutive equations. Velocities and accelerations are calculated through time derivatives of the nodal displacements.
A. Model preprocessing
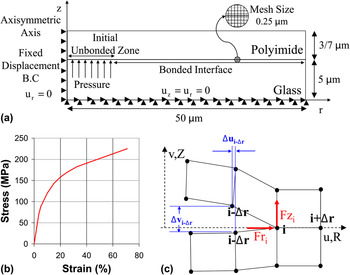
The spatial profile of the laser beam used in the BA-LIFT experiments is a top-hat (Table I). The uniformity and radial symmetry of the beam allows for the simplification of a three-dimensional finite element model to a two-dimensional axisymmetric analysis. Axisymmetry is chosen through element modification within ANSYS® and by enforcing zero displacement in the r-direction on the model’s axis of symmetry [Fig. 1(a)]. This simplification drastically reduces simulation run time while still capturing the appropriate physics.
(a) Axisymmetric finite element analysis (FEA) depicting a polyimide film bonded to a glass slide. The laser enters through the slide in the +z-direction, creating an enclosed volume of pressurized gas. Arrowheads denote the direction of the imposed boundary condition. (b) Stress–strain curve for Kapton® polyimide and (c) polyimide film delamination modeled as crack propagation via a fracture mechanics approach.

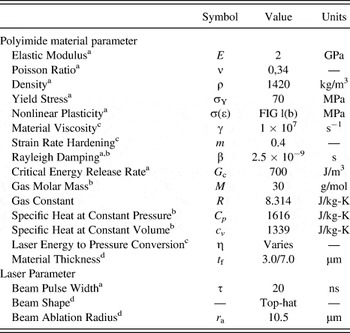
Material parameters for polyimide film and laser parameters.

a Published Data.
b Estimated Data.
c Fitting parameter.
d Measured Data.
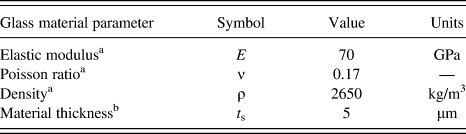
Initially, the model geometry is composed of a uniform 3- or 7-μm-thick film bonded to a rigid substrate [Fig. 1(a)]. Rate-independent material properties for the film are selected as Kapton® polyimide.20 Material damping is modeled through a Rayleigh damping stiffness matrix multiplier (β). In the absence of a published value for polyimide, β is estimated using a procedure described in literature.Reference Mostofi21–Reference Hall24 In short, this parameter is estimated by first conducting a modal analysis to determine the systems dominant natural frequencies, numbering them 1 – n. An assumption for rigid structures that the damping ratio for each mode is linearly proportional to the frequency of the system is then used. This enables calculation of the damping ratio for the nth mode based on a judicious selection of the damping ratio for the first mode. The calculation is repeated over a larger number of modes (1 – 2.5n) and averaged to yield β ∼ 2.5 × 10⁻⁹ s. All relevant rate-independent material properties for polyimide are shown in Table I. The substrate is subsequently selected as standard borosilicate glass (Table II) at a thickness of 5 μm. Based on the elastic modulus of glass relative to polyimide, glass deformation is negligible, and therefore the selected value is able to mimic the behavior of the actual 1-mm-thick microscope slide. This further reduces model size and simulation run time.
Material parameters for glass support.

a Published data.
b Measured data.
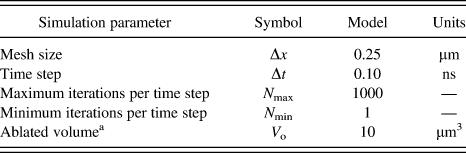
To prevent acceleration of the donor assembly, the nodes on the bottom of the glass substrate are set to zero displacement in the r- and z-directions. The mechanical bond between the polyimide film and glass slide [Fig. 1(a)] is simulated by initially coupling the overlapping polymer and glass nodes to constrain them to undergo identical rigid body motion. This sets the initial condition of the interface prior to laser interaction and subsequent polymer film debonding. We determine an optimal mesh size of 0.25 × 0.25 μm2 by recording equilibrium (t ∼ 500 ns) blister profile size and shape and finding that finer mesh sizes produce identical results. All relevant simulation parameters are in Table III.
Finite element analysis simulation parameters.

a Estimated data.
B. Laser/matter interaction
Upon pulsed laser irradiation of the donor substrate, a small volume of vapor at the glass/polymer interface is created, which breaks the bond at the interface. This behavior is incorporated in the model by removing the polymer/glass nodal coupling over a specified width which is defined here as the portion of the beam that exceeds the ablation threshold fluence of the material. For the top-hat beam profile and fluences used in the experiments, the ablation threshold of polyimide at our laser wavelength (λ = 355 nm) is approximately 120 mJ/cm,2,Reference Brannon, Lankard, Baise, Burns and Kaufman25 which is exceeded within the first few nanoseconds of the rising edge of the pulse. Therefore, the width of the initial vaporized volume is selected as the beam diameter (21 μm).
The mass of vaporized material continues to grow as the laser interacts with the polymer layer, reducing solid layer thickness and decreasing its resistance to mechanical bending and its ability to sustain membrane loads. This may change the dynamic response of the blister and final resting shape. However, the depth of material removal has not been characterized under such confined ablation configurations and may differ drastically from standard Beer–Lambert law ablation depths. Therefore, ablation depths cannot be accurately included in this analysis and are set to zero.
The driving force for blister expansion is provided by the high-pressure pocket of gas trapped within the film. Significant blister deformation occurs over the time scale of the laser pulse (40 ns). As the gas expands and does pressure–volume (PV) work in deforming the film, thermal energy is constantly being added to the gas over the course of the laser pulse. This heat addition is neither at constant volume nor constant pressure, as the pressure and volume are changing continuously because of the complex interaction with the deforming solid polymer film. Therefore, to deal with these nonuniform conditions, we break up the heat addition and volume expansion process into discrete steps. At the beginning of a time step, heat is added at constant volume, increasing the temperature and pressure. Then, over the course of the time step, the deformation of the solid film and the expansion of the enclosed gas are simulated subject to this constant pressure. At the end of the time step, the gas pressure and temperature are adjusted assuming that this volume expansion occurred adiabatically. In the limit of vanishingly small time steps, this treatment converges on the actual continuous laser heating and expansion process.
Within one time step, the amount of laser energy converted into thermal energy within the gas can be represented as

where I is the instantaneous laser power and the integral extends over the time step. The functional form of I(Fl,t) is such that it is Gaussian in time t and the integral of I over the entire laser pulse equals the total laser energy. The parameter k is the conversion efficiency of laser energy to thermal energy in the gas. In general, k is also a function of laser fluence, which accounts for the nonlinear absorption because of the formation of plasma.
At the beginning of a time step, the heat ΔQ is added to the gas at constant volume, resulting in an increase of temperature ΔT according to

where m is the mass of the gas and cv is its specific heat at constant volume. Equation (2) uses the constant-specific-heat assumption of an ideal gas. The resulting change in pressure ΔP at the beginning of the time step is captured through an ideal gas model

where R is the universal gas constant, V is the volume of the gas, and M its molar mass. By substituting Eq. (2) into Eq. (3), the increase in gas pressure is given by,

Likewise, the increase in gas pressure can be directly related to the laser power by substituting Eq. (1) into Eq. (4), which is given by

Equation (5) is valid for each time step over the entire laser pulse length, estimated as 40 ns. All relevant Kapton® polyimide thermal properties are given in Table I.
In the analysis, heat is added to the gas at constant volume at the beginning of each time step, increasing its pressure, and then the deformation of blister film is simulated over the time step subject to a constant internal gas pressure. At the end of the time step, the volume of the gas has increased to Vt from its initial value Vt− Δt. The pressure at the start of the next time step Pt is updated from the pressure used during the previous time step Pt −Δt assuming that the expansion occurred adiabatically, giving

Here, cp is the specific heat of the ablated species at constant pressure. As the time step size is decreased, this treatment with discrete isochoric, isobaric, and adiabatic steps converges to the actual process of continuous heat addition and expansion. The parameters cp, cv, and M are estimated by assuming that the blister gas is composed of an average of the primary polyimide ablation products at the nanosecond ablation temperature (850 °C)Reference Küper, Brannon and Brannon26; H2O, CO, and CO2.Reference Brannon, Lankard, Baise, Burns and Kaufman25 The final expression for the updated blister gas pressure is obtained by combining Eqs. (5) and (6), giving

where η = kR/Mcv. The prefactor η is a system parameter that incorporates the thermal and optical properties of the polyimide to relate the incremental change in gas pressure dP to the incremental laser energy addition dEL, such that  at a given volume Vt. Although η should vary in time as the laser-absorption and energy-conversion pathways evolve during the course of the laser pulse, for simplicity, we assume a static value that is only a function of the laser fluence. Once the laser pulse ends after 40 ns, the second term in Eq. (7) goes to zero, and we are left with the expression for adiabatic expansion.
To begin the analysis, an initial gas volume (V o) of finite value must be assumed because of the singularity present in Eq. (7) if V o=0. To test the sensitivity of the model to V o, we have obtained blister dynamics for initial volumes ranging from 1 to roughly 230 μm3, which is the volume defined by the beam area and the laser-absorption depth (∼0.67 μm).Reference Kattamis, Purnick, Weiss and Arnold17 In all cases, blister dynamics are observed to be insensitive to the initial volume. Therefore, a minimal value (1 μm3), indicative of surface absorption, is selected.
C. Strain-rate-dependent material properties
As gas pressure increases in the blister, a mechanical response in the polymer film occurs that is dependent on the polymer’s mechanical properties. Kapton® polyimide film mechanical properties are incorporated in the model, capturing the linear elastic regime as well as the nonlinear plastic regime, which is modeled using multilinear kinematic hardening.Reference Drucker and Prager27 This accommodates uniform plastic deformation once material yielding has occurred. The corresponding stress–strain diagram is seen in Fig. 1(b), and all relevant mechanical properties are in Table I. These properties are measured at very low strain rates ( < 1 s−1).20 However, because of the variation in strain rates (
 ) encountered during BA-LIFT, often in excess of 10Reference Colina, Duocastella, Fernández-Pradas, Serra and Morenza7 s−1, highly erroneous solutions may result from the use of mechanical properties from these typical “static” measurements. Therefore, to account for the strain-rate-dependent variation in material flow stress in ANSYS®, the following Peirce equationReference Peirce, Shih and Needleman28 is used,

This equation captures the change in the model’s response to a dynamically applied load and modifies the dynamics and shape of the resulting finite element blisters. Here σ y is the dynamic flow stress, which is larger than the static yield stress σ yo (Table I), γ is the material viscosity parameter, and m is the strain-rate-hardening parameter. The equivalent plastic strain rate ( ) is calculated directly within ANSYS®, followed by the dynamic flow stress pending knowledge of m and γ. The free parameters m and γ are determined through a parameter map analysis, the details of which are found in the experimental section.
D. Interface delamination
The mechanical deformation of the polymer film creates stress at the bonded glass/polymer interface (cohesive zone). This causes the compliant polymer film to delaminate from the rigid glass substrate. Interface delamination in the cohesive zone is accounted for using a fracture mechanics approach. Here, the energy available to propagate the crack, termed the strain energy release rate (G), is calculated and compared to the energy required to propagate the crack, termed the critical strain energy release rate (G C). Delamination is allowed to proceed once G exceeds G C. A number of techniques that can be implemented to calculate the strain energy release rate include the finite crack extension method,Reference Krüger, König and Schneider29 virtual crack extension method,Reference Hellen30, Reference Parks31 equivalent domain integral method,Reference Li, Shih and Needleman32, Reference Moran and Shih33 and the virtual crack closure technique (VCCT).Reference Rybicki and Kanninen34, Reference Shivakumar, Tan and Newman35 The VCCT has been widely implemented for crack propagation at laminate interfaces. However, two separate analyses are required to first propagate the crack and then calculate the energy required to close the crack. To circumvent this tedious analysis, the modified VCCT is chosen to calculate the energy release rates without the need for two separate analyses.Reference Krueger36 It accomplishes this by assuming the energy required to propagate the crack from an area A to an area A + dA is the same as it is to propagate it another increment from A + dA to A + 2dA. In its most general form, the energy release rate is given by,

where ΔE is the energy required to propagate the crack through an area ΔA, F is the applied load, and δ is the crack tip opening displacement. In discretized form, Eq. (9) becomes,


where G I and G II are the opening and in-plane shearing energy release rates, ΔA = π( –
 ) is the delaminated area created by propagating a crack from node i to the adjacent elemental node (i + Δr),
 and
 are the nodal forces at the crack tip in the Z- and R-directions, ui −1 and vi −1 are the displacements of the previous node upper crack face in the R- and Z-directions, and * denotes the lower crack face [Fig. 1(c)].
 and
 are input on a 2π basis because of the axisymmetry of the problem. The critical energy release rate of polyimide bonded to glass is measured to be between 600 and 800 J/m2.Reference Buchwalter and Lacombe37–Reference Mittal39 Here, we choose an intermediate value of 700 J/m2. By examining energy release rates and not stress intensity values, the contributions from mode I interlamellar tension and mode II interlamellar sliding shear can be summed together to obtain the total strain energy release rate G T. Crack propagation will occur when,

III. RESULTS AND DISCUSSION
The first step in the FEA of blister formation is to measure the strain-rate-dependent material properties. For this purpose, experiments are carried out to measure blister size and shape for a 7-μm-thick polyimide film as detailed in the literature.Reference Brown, Kattamis and Arnold16 A 4.75 J/cm2 laser fluence is selected, producing a 75-μm-diameter blister over which to compare with finite element blister profiles.
A. Strain-rate-dependent material properties
Initial simulations using strain-rate-independent material properties (Kapton®)20 measured at low strain rates ( ∼ 0.3 s−1) produce blisters that do not properly match the experimental profiles. This error is attributed to the dependence of the polymer’s molecular response on strain rate. In amorphous polymer deformation at low strain rates, polymer chain reorienting through rotation, alignment, and sliding accommodate more strain at a given stress.Reference Calister40, Reference Hertzberg41 However, at peak strain rates encountered during laser-induced blister formation (107–108 s−1), the extent of chain reorienting is limited, effectively strengthening the material by increasing the stress needed to strain the material.Reference Argon42, Reference Boyce, Parks and Argon43 These changes in mechanical properties affect the shape and dynamic response of the blisters and are important to include in the FEA. This is typically accomplished by fitting the two unknown material parameters (m and γ) in Eq. (8) to stress–strain curves acquired at a range of strain rates.
A variety of methods exist to obtain the necessary mechanical properties of materials at a range of strain rates.Reference Field, Walley, Proud, Goldrein and Siviour44 However, the complexity of the measurements increases with strain rate. For example, commercially available mechanical testing machines enable stress–strain material measurements at quasi-static strain rates ( < 10 s−1). These tests are simple to conduct and can capture elastic and any permanent plastic deformation effects that occur prior to material failure. For strain rates between 101–103 s−1, commercially available drop weight testing machines are used to acquire similar material measurements. Beyond these strain rates, however, commercially available techniques do not exist, and more complex methods such as the Split-Hopkinson pressure bar techniqueReference Harding and Campbell45, Reference Hopkinson46 or the flyer plate shock loaded techniqueReference Gray47 must be utilized. The major difficulty in employing these techniques stems from the unknown temperature distribution in the polymer and its effect on the material parameters.
We take a different approach to obtain the necessary strain-rate-dependent material parameters of Eq. (8) (m and γ) through the use of a parameter analysis. This procedure enables the determination of these parameters without the knowledge of the temperature distributions within the polymer film. In this analysis, the two parameters are independently varied, and corresponding finite element blister profiles are extracted. Care is taken to ensure that the numerical profile heights match the experimental profile heights by adjusting the parameter η in Eq. (7). Adjustments in η are permissible at this stage since the physical values of η and its dependence on fluence cannot be determined until all material properties are known. The accuracy of fit is then determined by calculating the average residual sum of squares (RSS) between the finite element and experimental blister profiles as follows,

Here, n is the number of surface nodes over which the residual between the finite element value yi and experimental value f(xi) is calculated. The values of m and γ that minimize this metric are selected as the polymers rate-sensitive parameters.
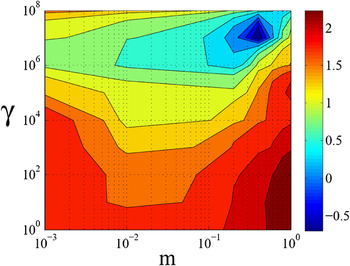
The parameter map in Fig. 2 depicts the dependence of m and γ on the accuracy of fit. Because of the large range of values present in the RSS, the data is scaled such that the scale bar denotes the logarithm of the RSS. In instances of material hardening, such as in laser-induced blister formation, the strain-rate-hardening parameter m can range from 0 < m ≤ 1.Reference Perzyna48 Here, we investigate the range 10−3 to 1, since values below 10−3 produce deformed blister strains larger than those that are physically possible in this polymer material and greatly misrepresent the actual blister profile. The material viscosity parameter γ takes on all positive values.Reference Perzyna48 To cover a large parameter space, a range from 1 to 1 × 10⁸ is investigated. As seen in Fig. 2, the values of m and γ that minimize the error between the model and experiment correspond to m = 0.4 and γ = 107 s−1.
Strain-rate-dependent material parameter map depicting the logarithm of the average residual sum of squares (RSS). The values that minimize the RSS are selected as our polymer material parameters (m = 0.4, γ = 107 s−1).

The strain-rate-hardening parameters provide a fundamental understanding of the polymers ability to harden at increased strain rates. For plastic strain rates in the range of 106–107 s−1, the dynamic yield stress varies between 1.0σ yo and 1.3σ yo. Therefore, a small amount of material strengthening occurs below 107 s−1. However, beyond a plastic strain rate of 107 s−1, the flow stress more drastically increases in value (e.g.,  = 4.5 × 10⁷ s−1, σ y = 2.0σ yo). This change in flow stress has interesting implications beyond the change in final resting blister shape. In particular, it increases the maximum amount of stored elastic energy in the blister by increasing the yield stress and yield strain of the polymer. This provides additional blister overshoot beyond its equilibrium height, which contributes to the experimentally observable oscillatory response. This dynamic behavior would be drastically limited if an increase in stored elastic energy is not present since the modulus of resilience of polyimide is virtually negligible at quasi-static strain rates.20
B. Conversion efficiency of laser energy to pressure–volume work
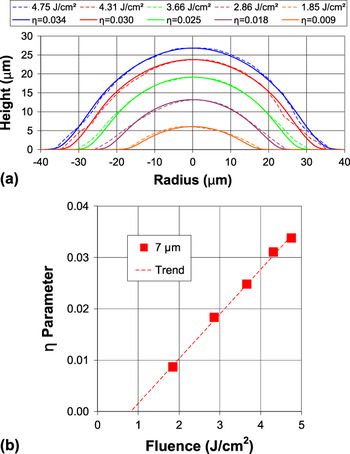
To elucidate the fluence dependence of the parameter η, experiments are first carried out on a 7-μm polyimide film at a range of fluences (1.85–4.75 J/cm2). η values are then selected in the FEA to ensure that numerical blister heights match experimental blister heights at each fluence. Figure 3(a) depicts exact matches between finite element blister heights and corresponding experimental blisters, verifying our correct selection of η. These values are depicted in the figure.
(a) Profile comparison between experiments conducted on a 7-μm polyimide film and corresponding FEA. Values for the parameter η are selected to ensure a match in blister height at each fluence. These values are plotted against fluence in (b).

Values of η versus laser fluence, as determined in Fig. 3(a), can now be plotted in Fig. 3(b). A trendline is added to guide the eye. The fluence axis intercept (∼0.8 J/cm2) corresponds to the minimum fluence needed to create an experimentally detectable blister height and is in agreement with previous work.Reference Brown, Kattamis and Arnold16 This implies that any blister deformation that may occur at or below this fluence is dominated by elastic effects, which are recovered by the time an image is captured at 500 ns. In addition, we observe an increase in η with fluence. This increase is justifiable since at higher fluence, a smaller percent of the deposited energy is consumed by latent heats. Therefore, a larger percentage of the energy is available to be coupled into the blister gas. In addition, it is also well established that during ablation confinement, an increase in the mean density of the gas occurs,Reference Fabbro, Fournier, Ballard, Devaux and Virmont49 which may contribute to the increase in η and thus the amplification in laser absorption by the gas.
A more rigorous explanation for the observed increase in η with fluence can be formulated from measurements on the ablation of polyimide. In the absence of optical measurements during confined ablation, measurements consisting of plume transmission and reflection during standard ablation of polyimide must be interpreted. Reflection measurements (λ = 248 nm) depict the leveling off of the reflected pulse intensity beyond the ablation threshold and up to 5 J/cm2, corresponding to a decrease in reflectivity at higher fluence.Reference Paraskevopoulos, Singleton, Irwin and Taylor50 In addition, similar measurements (λ = 248 nm) at fluences between 1 and 180 mJ/cm2 depict a truncation in reflected pulse width and a similar reduction in amplitude at and beyond the ablation fluence.Reference Ediger and Pettit51–Reference Pettit, Ediger, Hahn, Brinson and Sauerbrey53 Further measurements confirm that the scattering by the plume is not a predominant factor in the attenuation of the reflected radiation, pointing toward enhanced absorption by the ablated species as the probable attenuation mechanism.Reference Ediger and Pettit51 In a different approach, optical measurements have been used to demonstrate a decrease in transmission through the ablation plume with increase in fluence.Reference Schmidt, Ihlemann, Wolff-Rottke, Luther and Troe54, Reference Koren55 Therefore, since transmission through and reflection from the gas decreases, the absorption in the gas should increase with fluence. This suggests that the conversion efficiency of laser energy into thermal energy in the gas should also display a similar increase.
The observed relationship in Fig. 3(b) should depend solely on the laser/matter interaction, which includes laser wavelength, laser pulse length, and the optical, photochemical, and thermal properties of the material. Therefore, the conversion efficiency should be independent of BA-LIFT process parameters. These parameters can include film thickness, laser beam shape, and donor ink fluidic properties.
C. Model validation
1. η, γ, and m for thinner film thickness
Determination of the fluence dependence of the parameter η and strain-rate-dependent material parameters (m and γ) sets the model’s remaining parameters and will enable future optimization of BA-LIFT. It is, however, necessary to ensure that the finite element model is validated against another set of experiments. The first step in this process consists of ensuring that our calculation of the energy-conversion efficiency is accurate. This is accomplished by either varying polymer film thickness or laser beam shape and then by comparing model predictions to experimental data. Since polymer film thickness is the more common process parameter varied to experimentally probe BA-LIFT,Reference Brown, Kattamis and Arnold16 it is selected as a means for model validation.
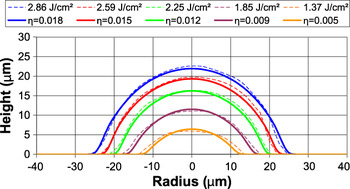
BA-LIFT experiments are conducted to generate blisters on a 3-μm film at a range of fluences (1.37–2.86 J/cm2), and their profiles are compared to numerical blister profiles (3 μm) generated by extrapolating η values from the trendline in Fig. 3(b). The numerical analysis is executed without any free parameters, since γ, m, and η have been determined through the analyses outlined in previous sections (Table I). The numerical calculations are in good agreement with the experiments (Fig. 4). As is apparent, only a slight deviation in height of a few percent exists between the model and experiment, confirming our calculation of the conversion efficiency (η). The largest deviation in height (7%) occurs at the lowest fluence (1.37 J/cm2). This may be attributed to the uncertainty present in extrapolating η values from the trendline [Fig. 3(b)] beyond the experimental data set.
Comparison between experiments conducted on a 3-μm polyimide film and corresponding FEA.

In addition to the model’s accurate prediction of height, the overall shapes of the numerical blister profiles are in good agreement with the experimental blister profiles. To quantify the accuracy in shape, the average RSS is calculated among profiles, yielding values between 0.49 and 0.77. The logarithm of the range of these values (−0.31, −0.11) is very close to the minimum RSS depicted in Fig. 2, reaffirming our determination of strain-rate-dependent material parameters (γ and m). The parameter-free fit of Fig. 4 confirms that the numerical steady-state (500 ns) blister profiles match the experiments.
2. Blister formation dynamics
Ink transfer in BA-LIFT is attributed to the dynamic response of blister formation and its interaction with the adjacent ink. To have a meaningful model from which predictions can be made, it is important that the finite element model duplicate the observed dynamic blister response. The initial blister rise to maximum height is especially important since momentum transfer to the ink occurs during this period. To ensure that the model properly captures the dynamic blister response, center surface node dynamics are acquired for comparison to experimental results at the same location on the deforming film.
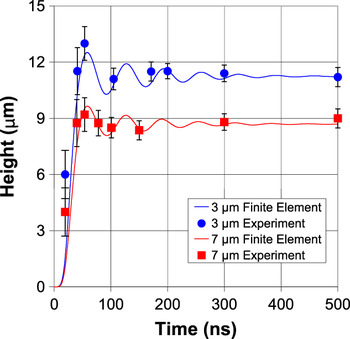
The dynamic response of blisters generated on the 7-μm film at a fluence of 2.25 J/cm2 and on the 3-μm film at a fluence of 1.85 J/cm2 is measured for comparison to model predictions at conversion efficiencies determined from Fig. 3(b). These correspond to η = 0.012 (Fl = 2.25 J/cm2) and η = 0.009 (Fl = 1.85 J/cm2). The experimental and numerical predictions of the dynamic response for both film thicknesses are depicted in Fig. 5. Blister rise to maximum height is accurately captured by the model in the thicker film (7 μm), and only a slight underestimate is present in the thinner film maximum blister height (∼7%) as compared to the experimental results. A slight delay in the predicted initial blister response is also apparent for both film thicknesses. This can be attributed to the idealized temporal Gaussian pulse width of the laser incorporated in the model. The actual temporal profile deviates from this approximation exhibiting a quicker rise time and slower decay.
Experimental and finite element model blister dynamics for a 3- and 7-μm polyimide film thickness. The initial overshoot and oscillation about the equilibrium height are properly captured in the FEA.

The maximum in blister height corresponds to an overshoot in the blisters equilibrium dimension and is followed by an oscillation about its steady-state equilibrium position (Fig. 5). Blister overshoot and oscillation are possible through a combination of interface delamination and an enhanced amount of stored elastic energy present at high strain rates. The stretching and sliding of polymer chains remove kinetic energy from the system through frictional heating, producing the observable damped blister response. Damped blister oscillations are properly captured by the model with a steady-state in blister response reached at approximately 500 ns.
3. Conditions for blister rupture
The deposition of delicate materials such as organic molecules and embryonic stem cells that are highly susceptible to optical, thermal, and mechanical damage has been demonstrated with BA-LIFT.Reference Kattamis, McDaniel, Bernhard and Arnold11, Reference Kattamis, Purnick, Weiss and Arnold17 This capability is attributed to the polymers large film thickness relative to the optical and thermal diffusion length and its capacity to deform to high strain without rupture, thereby maintaining a confined ablation process that eliminates the interaction of hot vapor with delicate ink material. However, at sufficiently high laser fluences, blister rupture occurs, changing the mechanism for transferReference Brown, Kattamis and Arnold16 and permitting hot ablated species to interact with and contaminate the ink material. Specifically, in previous work we have demonstrated the occurrence of damage to delicate embryonic stem cells printed from ruptured blisters.Reference Kattamis, Purnick, Weiss and Arnold17 To understand the conditions for safe transfer, it is necessary to gain a fundamental understanding of how blister rupture occurs and to be able to capture it within the model. This will then enable meaningful BA-LIFT process parameter optimization in the finite element model prior to experimentation.
To model blister rupture, a fundamental understanding of material failure is required. Rupture in highly ductile materials, such as polyimide, is best modeled via strain-based failure theories.Reference Bower56 Because of the inherently complex distributions of normal and shear strains present in the blisters generated during BA-LIFT, the von Mises strain is investigated. It is given in its reduced form as,

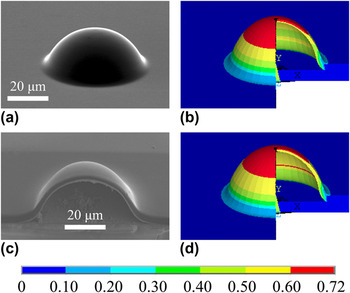
where ε e is the equivalent von Mises strain, ν′ is the material Poisson ratio for elastic strain and 0.5 for plastic strain, and ε 1, ε 2, and ε 3 are the principle strains. Failure is predicted to occur once the von Mises strain at regions of the model exceed the failure strain in uniaxial tension,Reference Bower56 given as 0.72 for this polymer.20
Blisters generated on a 3-μm film at fluences (2.59, 3.00, 3.20 J/cm2) below and above the rupture fluence are used for model validation. These blisters are subsequently sputter coated with 2 nm of iridium, and high-resolution images are captured by scanning electron microscopy (SEM) with an in-lens detector. FEA is first carried out at η = 0.015, corresponding to a subthreshold rupture fluence (2.59 J/cm2). Figure 6(b) shows the blister and its associated strain at 50 ns, while Fig. 6(d) shows the blister at 60 ns. Blister film thickness is observed to decrease in dimension in the top-center portion, indicative of a highly strained region. This effect is better shown in the SEM cross section of Fig. 6(c), where the thickness of the central delaminated region is thinner than the edge region. One may expect that a maximum in blister strain would coincide with the occurrence of maximum blister height and thus zero blister velocity, which occurs at 60 ns [Fig. 6(d)]. However, this is not the case. Instead, a maximum in blister strain is observed to occur at 50 ns [Fig. 6(b)], prior to maximum in blister height. This implies that the experimentally observed blister rupture at higher fluences must occur during the initial expansion process when the blister still has momentum.
Image comparison for experiment (Fl = 2.59 J/cm2) and model (η = 0.015). (a) Scanning electron microscopy (SEM) image of the resulting blister. (b) Maximum in predicted blister strain is observed at 50 ns, and (c) the blister reaches its peak dimensions by 60 ns. Thinning of the film is observable in (b) and in (c). (d) SEM cross section depicting blister thinning at the top.

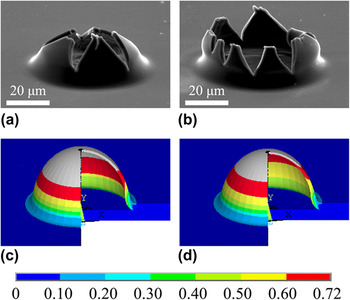
Issues of blister rupture are shown in Fig. 7. Upon an increase in laser fluence to 3.00 J/cm2, experimental blister rupture is observed to occur [Fig. 7(a)]. The effects of rapid propagation of a number of cracks originating from surface or internal microstructural defects are observed. To verify that the finite element model can predict when the material rupture strain in the blister is exceeded, the von Mises strain is again investigated. The analysis is conducted at η = 0.019, as determined from Fig. 3. Figure 7(c) depicts a maximum in strain occurring at 49 ns, prior to the maximum in blister height. This figure shows a small volume, beginning at the outer surface of the blister and propagating through the majority of the film thickness that has exceeded the failure strain (gray). An internal blister pressure of 40.5 MPa, as calculated from Eq. (7), would help drive the fracture process through the weakened film. A continued increase in fluence to 3.20 J/cm2 produces a larger fractured blister, characterized by a fully opened tulip-like shape [Fig. 7(b)], and a correspondingly larger finite element (η = 0.021) volume that has exceeded the material failure strain [Fig. 7(d)]. The larger internal pressure at rupture, calculated as 42.6 MPa, supplies more energy to the fracture process, creating larger fracture surfaces. In both cases, the release of hot pressurized gases can contaminate and cause damage to delicate ink systems and should be avoided when sensitive inks are to be printed.
Blister rupture occurring at higher laser fluences. SEM images of blister rupture at (a) 3.00 and (b) 3.20 J/cm2. Corresponding finite element predictions of blister strain at (c) 3.00 J/cm2 with η = 0.019 and (d) 3.00 J/cm2 with η = 0.021. Increasing laser fluence results in a larger volume that is in excess of the material failure strain (gray).

IV. CONCLUSIONS
In summary, this work presents an experimental and numerical investigation of the initial stages of laser-induced blister formation on a polyimide film. The polyimide film is modeled in bonded contact with a glass substrate. Upon pulsed laser irradiation, a fraction of the incoming energy is added to a gas enclosed at the bi-material interface. The expanding gas energizes the adjacent polymer film, leading to deformation and delamination from the glass substrate with a rapidly expanding blister. Strain-rate-dependent material parameters (m and γ) are determined by fitting numerical results to the experimental measurements for a 7-μm-thick polyimide absorbing film layer, providing insight into the mechanical behavior of this polymer at very high strain rates. In addition, we estimate the parameter η by matching equilibrium (500 ns) numerical blister heights to experimental results to provide a measure of the confined ablation process. These parameters (m, γ, and η), in conjunction with readily available material properties, encompass all quantities necessary to model the initial stages of blister formation for an arbitrary polyimide film thickness and laser beam shape.
To test the accuracy of our model, experiments are carried out on a 3-μm-thick polyimide film, and the numerical calculation exhibits proper blister size and shape using m, γ, and η value measurements from the previous 7-μm-thick film analysis. Blister dynamics are subsequently investigated to ensure that the transfer of momentum from the blister to the adjacent ink is properly captured, and model predictions are shown to be in agreement with the experiments. In the high-laser-fluence regime, blister rupture occurs and permits the escape of hot ablated species and their interaction with ink material. This phenomenon is characterized by significant material plasticity at the top portion of the blister, followed by rapid crack propagation away from the overstrained region, producing tulip-like fracture geometry. A strain-based failure analysis is used to capture this phenomenon, and strains in excess of the material failure strain are predicted for experimental blisters that have ruptured. A maximum in strain is also shown to occur prior to a maximum in predicted blister height, indicating that the experimentally observed blister rupture must occur while the blister is in motion. This validated finite element model will enable both BA-LIFT process parameter optimization prior to experimentation and the design of new LIFT configurations that include DRLs sandwiched between the glass donor and a highly elastic deformable polymer.
ACKNOWLEDGMENTS
This work was supported by the National Science Foundation (MRSEC Program) through the Princeton Center for Complex Materials (DMR 0819860), the National Science Foundation (DMR-0548147), and the Air Force Office of Scientific Research (AFOSR-FA9550-08-1-0094).