INTRODUCTION
In recent years, the tone system in Hong Kong Cantonese appears to be changing in that some speakers no longer distinguish all six lexical tones. However, only a few studies have reported evidence for this. The present study aims to address this gap by examining both the production and perception of the potential tone mergers, and also to investigate possible causes of such changes.
Cantonese tone system
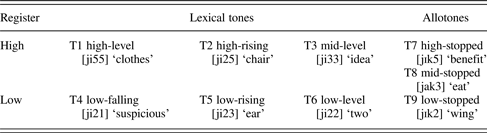
Hong Kong Cantonese, a variety of Cantonese, is a Chinese language well known for its complex tone system, which has attracted much research interest (e.g., Fok-Chan, Reference Fok-Chan1974; Gandour, Reference Gandour1981; Khouw & Ciocca, Reference Khouw and Ciocca2007). There are six lexical tones (T) and three allotones in Hong Kong Cantonese (Bauer & Benedict, Reference Bauer and Benedict1997). Each syllable (usually corresponding to a morpheme) carries a tone. The six lexical tones are: T1 (high-level [55]), T2 (high-rising [25]), T3 (mid-level [33]), T4 (low-falling [21]), T5 (low-rising [23]), and T6 (low-level [22]). The numbers in [ ] represent the relative starting and ending pitch levels of each tone, with 5 being the highest and 1 being the lowest pitch level of a speaker's normal pitch range (Chao, Reference Chao1930, Reference Chao1947). The six lexical tones appear in open syllables or syllables with nasal endings [-m, -n, -ŋ]. The three allotones are traditionally called the “entering tones” in Chinese phonology. They only appear in syllables ending with unreleased stops [-p, -t, -k]: T7 (high-stopped [5]), T8 (mid-stopped [3]), and T9 (low-stopped [2]). They are much shorter in duration and are considered allotones of the three corresponding unstopped level tones T1, T3, and T6, respectively (Bauer & Benedict, Reference Bauer and Benedict1997; Chao, Reference Chao1947). Table 1 shows all the tones with examples.
Cantonese tones with examples

Previous studies have shown that fundamental frequency (F0) is the primary and sufficient cue for tonal distinction in Cantonese (Fok-Chan, Reference Fok-Chan1974; Khouw & Ciocca, Reference Khouw and Ciocca2007; Vance, Reference Vance1977). Creakiness in T4 [21] can also contribute to the identification of that tone (Yu & Lam, Reference Yu and Lam2011), but it is an optional supplementary feature. Figure 1 shows for reference the F0 traces of the six lexical tones produced by the first author who distinguishes all six tones clearly in production. It can be seen that pitch height, pitch direction, and magnitude of change are important features for tonal distinction in Cantonese (Gandour, Reference Gandour1981; Khouw & Ciocca, Reference Khouw and Ciocca2007). The three level tones (T1, T3, T6) are distinguished by tone height. T1 [55] is well separated from all other tones by being at the top of the speaker's normal pitch range. There is a larger difference in F0 between T1 [55] and T3 [33] than between T3 [33] and T6 [22] (only around 30 Hz for the tokens in Figure 1; see also data in Khouw & Ciocca, Reference Khouw and Ciocca2007). T2 [25] and T5 [23] have a rising contour, but differ in the magnitude of change. T2 rises to the highest pitch level, whereas T5 only has a minimal rise. T4 [21] and T6 [22] differ slightly in contour with T4 having a small fall throughout the syllable. T5 [23] and T6 [22] differ in the opposite direction, with T5 having a small rise. It can be seen from Figure 1 that the Cantonese “tone space” is very crowded in the lower pitch range, with four tones sharing the same low starting point [2], and four tones ending in the low to mid pitch range.
F0 traces of the six lexical tones on the syllable [ji] spoken by a female speaker.
Given such subtle differences in a narrow pitch range, it is not surprising that some tone pairs are easily confusable, especially in isolation. Tone pairs with similar contours and/or little contrast in height—that is, T2 [25] vs. T5 [23], T3 [33] vs. T6 [22], T4 [21] vs. T6 [22]—can be confusable even for adult native speakers (Fok-Chan, Reference Fok-Chan1974; Varley & So, Reference Varley and So1995). Typically developing children acquiring Cantonese also find T2 [25] vs. T5 [23], T3 [33] vs. T6 [22] particularly hard to distinguish and acquire them last (e.g., Ciocca & Lui, Reference Ciocca and Lui2003; Wong, Ciocca, & Yung, Reference Wong, Ciocca and Yung2009). Wong et al. (Reference Wong, Ciocca and Yung2009) also found that tone pairs with large differences in F0 height or contour—such as, T1 [55] vs. T4 [21] and T1 [55] vs. T2 [25]—are the easiest for children to distinguish.
Tone merging in Hong Kong Cantonese
In the past decade, researchers in Hong Kong have noticed that some Cantonese speakers no longer distinguish all six tones in their production, most notably T2 [25] vs. T5 [23]. Kei, Smyth, So, Lau, and Capell (Reference Kei, Smyth, So, Lau and Capell2002) reported several cases. They compared the tone production of 15 participants against a control group of 56 speakers who were screened for accuracy of their tone production. They found that 6 of their 15 participants did not clearly distinguish the two rising tones (T2 [25] and T5 [23]) in their production. Kei et al. (Reference Kei, Smyth, So, Lau and Capell2002) considered that these speakers made “tone production errors,” as the purpose of their study was to establish a normative profile of Cantonese tones for speech therapists. Bauer, Cheung, and Cheung (Reference Bauer, Cheung and Cheung2003) followed up on Kei et al.'s (Reference Kei, Smyth, So, Lau and Capell2002) findings from a tone merging perspective. They investigated the tone production of eight male speakers and found that two of their speakers produced the rising tones unconventionally. They concluded that there are tonal subvarieties coexisting in the Hong Kong speech community.
These two studies only investigated the production of the T2/T5 merger. A more recent study investigated both the production and perception of this tone pair. Yiu (Reference Yiu2009) found that 5 of her 15 participants confused some of the T2/T5 pairs in perception. In production, three participants appeared to be merging the two rising tones. Yiu (Reference Yiu2009) found that the participants' production performance could not be used to predict their perception performance, and vice versa. Taken together, these three studies suggest that some Hong Kong Cantonese speakers are merging the two rising tones, with different possible patterns: low-rising merging into high-rising (T5 [23] → T2 [25]); high-rising merging into low-rising (T2 [25] → T5 [23]); and having a novel intermediate realization.
Impressionistically, some young speakers also confuse the mid-level (T3 [33]) and the low-level tones (T6 [22]), as well as the low-level (T6 [22]) and the low-falling tones (T4 [21]) in their production. However, thus far, very few studies have investigated the production or perception of other potential tone mergers in Hong Kong Cantonese (see Fung, Kung, Law, Su, & Wong, Reference Fung, Kung, Law, Su and Wong2012, for T4/T6; and Yu, Reference Yu2007, for a morphological tone merge). In addition, Killingley (Reference Killingley1985) argued that the mid-level T3 [33] and the low-rising T5 [23] have merged in Malayan Cantonese and proposed that the same is also true in Hong Kong Cantonese. However, there is no concrete evidence in that study to support this claim, and the data in Fok (Reference Fok-Chan1974) and Kei et al. (Reference Kei, Smyth, So, Lau and Capell2002) show that these two tones are clearly distinct. Therefore, more studies are needed to investigate the merging tone patterns in Cantonese and the factors contributing to such patterns.
Additionally, it is interesting to note that in Kei et al.'s (Reference Kei, Smyth, So, Lau and Capell2002), Bauer et al.'s (Reference Bauer, Cheung and Cheung2003), and Yiu's (Reference Yiu2009) studies, the speakers who confused the two rising tones did not merge all words with the two target tones. They were able to differentiate some T2/T5 words. Their results indicate that these speakers probably still have two separate rising tone categories, although one category is weaker. A logical question to ask is: What contributes to this pattern? However, these three studies gave no clear answer.
A possible factor affecting tone merging is word frequency. The effect of word frequency is an important factor in language change. Hooper (Reference Hooper and Christie1976) and Bybee (Reference Bybee2007) distinguished two types of word frequency effects on sound change. Reductive sound change (i.e., changes involving deletion/weakening of speech sounds) tends to affect high-frequency words first, whereas analogical sound change (i.e., changes happening based on an analogy taken from related patterns) usually starts from low-frequency words first. Bybee (Reference Bybee2007; cf. Hooper, Reference Hooper and Christie1976) argued that reductive sound change originates from the automation of speech production, whereas analogical sound change stems from imperfect learning. Similarly, Philips (Reference Philips1984) suggested that reductive sound change is motivated by physiological factors, whereas analogical sound change is motivated by conceptual factors. It is unclear to which type of sound change tone merging belongs, and what its effects on tone merging are.
High-frequency words are shown to be more susceptible to surface variations and are often more reduced in speech (Bybee, Reference Bybee2007; Jurafsky, Bell, Gregory, & Raymond, Reference Jurafsky, Bell, Gregory, Raymond, Bybee and Hopper2000; Wright, Reference Wright, Local, Ogden and Temple2004). Zhao and Jurafsky (Reference Zhao and Jurafsky2007, Reference Zhao and Jurafsky2009) showed that word frequency can affect tone production in Cantonese. They found that low-frequency words are hyperarticulated and are produced with a higher pitch. Low-frequency words also have a more expanded pitch range than that of high-frequency words, that is, the tones of low-frequency words are more dispersed in the tonal space. Although they did not investigate tone mergers, it is conceivable that more tone mergers may be found in high-frequency words because they are more susceptible to surface variations and sound change, and because they have a more compressed pitch range, which renders the tones less distinct. In addition, high-frequency words are often articulated more quickly and less distinctly. Nokes and Hay (Reference Nokes and Hay2012) showed that an increase in speech rate can decrease pitch variation. Their data support the preceding assumption about word frequency (high) and tone production (reduced) quite well.
Yiu's (Reference Yiu2009) data also show some support for the effects of word frequency. In Cantonese, there are more T2 [25] words than T5 [23] words (Fok-Chan, Reference Fok-Chan1974; Leung, Law, & Fung, Reference Leung, Law and Fung2004). She found that her participants appeared to confuse T2 words more often than T5 words. However, the results only suggest that type frequency (i.e., how many distinct items are represented by a particular pattern) may affect tone merging, but it is unclear whether and how token frequency (i.e., the number of times a unit appears in a defined discourse) can affect the merging of tones in Cantonese, as none of the previous studies on Cantonese tone merging has manipulated token frequency systematically.
In fact, very few studies have investigated the effects of word frequency on tone merging. Myers and Li (Reference Myers and Li2009) investigated the effects of lexical (token) frequency on syllable contraction in Southern Min. The tonal contours of two syllables are merged into one if the syllables are contracted. They found that the degree of this tone merge correlated positively with word frequency. Although the reductive tone merge in Southern Min syllable contraction is qualitatively different from the phonological tone merge in Cantonese being considered here, their results do indicate that token frequency can indeed affect tone production. In addition, Hildebrandt (Reference Hildebrandt2003) found that word frequency could affect the retention/merging of tones in Manange (a Tibeto-Burman language of Nepal), but the effects were also dependent on the degree of access to Manange and Nepali. Therefore, in view of Yiu's (Reference Yiu2009), Myers and Li's (Reference Myers and Li2009), and Hildebrandt's (Reference Hildebrandt2003) results, it would be interesting to see whether and how tone merging in Cantonese is affected by word frequency.
The present study
Our study investigated both the production and perception of the potential tone mergers in Hong Kong Cantonese. In addition to the T2/T5 pairs that previous studies focused on, we included other potentially merging pairs as well. Previous studies compared fundamental frequency data for tone production, but they had very limited data from only a few merging speakers (e.g., only two merging speakers in Bauer et al., Reference Bauer, Cheung and Cheung2003). We systematically screened a large number of speakers and collected production data from 17 merging speakers (see details in the participants section), in order to reveal a more comprehensive picture of the tone merging phenomenon.
As tone contour is a time-varying feature, it can be characterized using multiple point measurements of fundamental frequency, each of which can be treated as a variable for modeling purposes. The present study made use of predictive discriminant analysis to examine whether the merging tones were distinct from each other. Predictive discriminant analysis is a multivariate test that shows how different cases group themselves based on a set of variables. Some of the previous studies on tone production have also used this statistical test to quantify how distinctive two tone categories are. For example, Kratochvil (Reference Kratochvil1986) used predictive discriminant analysis to predict whether the sandhi-ed T3 in Mandarin (when two T3s are put side by side, the first T3 becomes a T2; see Lin, Reference Lin2007:97, for examples) was distinct from the canonical T2. One of the main goals of the current study is to see whether the merging participants distinguish the merging tone pairs in their production. We believe that multivariate predictive discriminant analysis is a proper test for this purpose.
In addition to comparing acoustic data, we also include data that were auditorily transcribed by native speakers who clearly distinguish all six tones in their production and perception. This is designed to ensure that both intermediate and merged tokens can be accounted for, which can also show us perceptual judgment of the participants' production by native listeners, in addition to the results by machine recognition (discriminant analysis).
Moreover, we investigate the effects of word frequency on tone merger by manipulating token frequency systematically in the production experiment. We would like to see whether high-frequency and low-frequency words show different patterns in the ongoing tone merger.
Although Yiu (Reference Yiu2009) included perception data in her study of the T2/T5 merge, using both accuracy and reaction time data of many more nonmerging and potentially merging participants in the present study can give us a more comprehensive picture of tone perception. Finally, previous studies recruited the participants randomly, so they only had a small number of participants who appeared to be merging tones. In order to target the merging speakers, we screened a large number of young participants for our study.
METHODS
Participants
Previous studies suggest that the merging process is a relatively recent phenomenon. We therefore targeted young speakers for our study. To recruit merging speakers, a simple screening test for production was conducted. Each potential participant was recorded reading a list of 18 words (3 different syllables × 6 tones) embedded in a short carrier phrase. Their recordings were auditorily checked by the first and the third authors (both native speakers of Cantonese who clearly distinguish all six tones) to determine which speakers were likely to merge the tones. The screening was based on impressionistic judgments. Only those who were judged to have noncanonical tone production (of any tone) by both judges were selected as merging participants. In total, 169 people were screened, and 28 potentially merging participants were identified by the first and the third authors based on their tone production. Due to time limitations and various logistic constraints, 17 of the 28 identified merging participants participated in both the production and perception experiments, and the other 11 merging participants participated in the perception experiment only. An additional 30 participants who clearly distinguish all six tones in their production were used as a control group for the perception experiment. Thus, 58 participants participated in the perception experiment, of which 28 were merging (21 female, 7 male) and 30 were control (23 female, 7 male), and 17 merging participants (14 female, 3 male) participated in the production experiment. They were all local undergraduate students at the Chinese University of Hong Kong between 18 and 22 years of age. There was no age difference between the two groups. The participants reported having no history of hearing problems or language disorders. They were paid to participate in the experiments.
Materials
Word frequency was included as a factor in the production experiment. Because no corpus of spoken Cantonese with information of word frequency was available to us when we conducted our study, we used a corpus that is based on written text in order to manipulate word (token) frequency systematically. High- and low-frequency monosyllabic and disyllabic words were selected from an electronic database of around 33,000 Cantonese words extracted from a 1.7 million character corpus of Hong Kong newspapers (see details in Chan & Tang, Reference Chan and Tang1990). Only the monosyllabic data are presented in this paper. Six high-frequency and six low-frequency monosyllabic words were chosen for each of the six tones. Word frequency was based on the log frequency (base 10) of the token frequency in the corpus. The chosen words were selected from the highest (logged frequency ranging from 3.14 to 4.10) and lowest frequency (logged frequency ranging from 0 to 1.59) brackets in the corpus in order to maximize their difference in word frequency. This resulted in 72 target monosyllabic words (6 tones × 6 words × 2 frequencies). Monosyllables ending with a stop coda (i.e., the allotones mentioned in the Cantonese tone system section) were not selected. All the monosyllabic words were randomized and embedded in a short carrier phrase: [ŋɔ23 tʊk2 ___ tsi22] ‘I read the word ___’ when presented to the speakers in the production experiment. All materials were presented in Chinese characters, which show no information about tones.
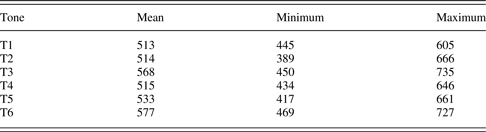
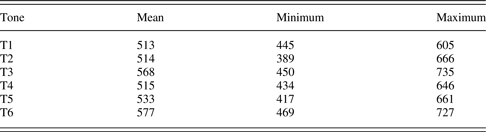
The perception experiment using Cantonese monosyllables was an AX discrimination task with two types of materials: 120 AA pairs and 120 AB pairs. The AA pairs had the same stimuli (e.g., T1/T1 of the same syllable [ji 55]), and the AB pairs had different stimuli that differed only in tones (e.g., T2/T5 of the same segmental syllable [ji 25] and [ji 23]). Two criteria were used in selecting the stimuli: (i) 10 different syllables of each tone were included; (ii) 5 of the 10 syllables had all six tones attested in Cantonese, for example, a full set such as [ji] shown in Table 1, while the other five syllables do not appear in all six tones, for example, a deficient set such as [wan] with T3 [33] being unattested. Altogether, 60 target monosyllables were chosen; 56 of the target monosyllables were also used in the production experiment. Word frequency was not manipulated systematically in the perception experiment, but the numbers of high- and low-frequency items for each tone were balanced. The 60 target monosyllables all appeared in the AA pairs (same stimuli). An additional 60 dummy AA pairs with completely different materials were used to balance the number (120) of the AB pairs (different stimuli). The dummy items were excluded from analysis. Two syllables were used to construct the AB pairs (2 syllables × 6 tones = 12 tokens). Each token was paired up with other tokens having the same segments, but with different tones (e.g., T1 vs. T2, T1 vs. T3). The order of the AB pairs was counterbalanced, that is, both A/B and B/A sequences were included. This resulted in 120 AB pairs (2 syllables × 6 tones × 5 matching tones × 2 orders). A female researcher who is also a qualified speech therapist in Hong Kong produced all the monosyllables in isolation for the perception experiment. The average duration of these monosyllables can be found in Table 2. Unattested matching tones for the AB pairs were presented to her in transcription. She had no difficulty in producing these tokens. The 120 AA and 120 AB pairs were randomized in the perception experiment.
Mean durations (ms) of the perception monosyllables produced by a female speaker in isolation
Procedures
The 17 potentially merging participants participated in the production experiment first, lest they should become aware of the purpose of the experiments at the outset and thus be extra careful in their performance. Informal inquiry after the production experiment confirmed that the participants were oblivious to the aim of the experiment. The participants were recorded reading the monosyllabic materials in Chinese characters. Two randomized lists of the same materials were used for counterbalancing. Nine participants read the first list and eight participants read the second list. Before the actual recording, the participants practiced by reading the materials for as long as they liked to ensure natural production. Short breaks were given during the recording. The recording took place in a sound-treated booth at the Chinese University of Hong Kong. Their speech was recorded directly onto hard disk with a sampling rate of 22,050 Hz using Praat (Boersma, Reference Boersma2001) via a condenser microphone placed approximately 20 cm away from the participants. They were recorded reading the materials with a normal speech rate. Three repetitions of the materials were taken, so altogether there were 216 tokens per speaker (72 target monosyllables × 3 repetitions).
The 17 merging participants were invited back for the perception experiment at least two weeks after the production experiment. An additional 11 merging participants and 30 control participants were also included. The perception experiment was an AX discrimination task using the 120 AA and 120 AB pairs previously mentioned. The participants were asked to judge whether the two syllables they heard were of the “same” or “different” tones. There was a short practice session to familiarize the participants. The experiment was divided into four blocks. The stimuli within each block were randomized for each subject. Short breaks were scheduled between blocks.
The participants participated in the perception experiment individually in a quiet room at the Chinese University of Hong Kong. The stimuli were presented to them at a comfortable level via a Logitech Clearchat Premium PC Headset through a sound card using E-Prime 2.0 Professional (Psychology Software Tools, Pittsburgh, PA) with a desktop computer. Both accuracy and reaction time data were collected using the PST Serial Response Box. No feedback, either visual or auditory, was given. The interstimulus interval was 500 ms. Reaction time was calculated from the onset of the second monosyllable. All reaction time values longer than 3000 ms were counted as missing responses and were excluded from analysis. This resulted in the loss of 0.6% of the data.
Acoustic measurements
The beginning and end of periodicity of the target syllable (if the whole syllable consisted of sonorants) or the vowel (if the syllable had a nonsonorous initial consonant) in the production data were marked manually based on the spectrogram (using the start of F1 as the beginning and the end of F2 as the end of periodicity). Ten equidistant measurement points were taken between these two marks, so the data were time-normalized for each tone. The fundamental frequency (F0) values of each point were tracked automatically using the autocorrection algorithm and then checked manually using Praat (Boersma, Reference Boersma2001). Due to the perturbation from initial consonants or creakiness, data from the first (i.e., the beginning of periodicity) and the tenth (i.e., the end of periodicity) measurement points were excluded from analysis (Rose, Reference Rose1987). Only data from the second to the ninth measurement points were used for comparison. Very creaky tokens (e.g., T4 [21]) were excluded from acoustic analysis because F0 values could not be measured, which resulted in the loss of 9% of the total dataset (about 60% of which were T4 [21] tokens).
In addition to acoustic measurements, all tokens of tone production by the 17 merging speakers were identified by two independent native Cantonese transcribers with phonetic training. The transcribers did not participate in either the production or the perception experiments. They were prescreened using a tone identification task to ensure that they were not merging any of the tones. The transcribers heard all the monosyllables in carrier phrases so they could determine the tones with reference to the context.
RESULTS
Production
The main questions in the production experiment were whether the 17 merging participants distinguished the merging tone pairs in their production, and whether word frequency had any effect on their tone production. Because previous studies showed that there would be much variation in the participants' merging patterns, it is important to consider their production data individually. To this end, we analyzed the acoustic data using predictive discriminant analysis for three reasons. First, discriminant analysis is a multivariate test that can evaluate between-group differences on the basis of a combination of several variables (Tabachnick & Fidell, Reference Tabachnick and Fidell2007:375), e.g., F0 measured at several time points along the tone contour. Second, discriminant analysis makes use of functions that maximize between-group differences relative to within-group differences. As F0 data always involve some within-speaker differences, discriminant analysis is an ideal method to deal with this issue. Third, predictive discriminant analysis generates classification accuracy rates (“classification rate” hereafter) for the data, which is a straightforward way to quantify the distinctiveness of different groups.
Predictive discriminant analysis predicts group membership from a set of predictors. In the current study, the dependent variable Tone was taken as the grouping variable, and four independent variables were used as the predictors: the F0 values at the second, fifth, sixth, and ninth measurement points of the pitch contour, representing the onset, middle, and offset pitch values of the tone. Because T1 [55] is well separated from the other tones and is not involved in any merging tone pair, we did not include T1 in the statistical test. We subsequently conducted discriminant analysis again including T1 to check for the robustness of the classification rates, and there was no significant difference between the results based on only five tones and those including T1. Therefore, we only reported the results based on five tones here for a more focused investigation of the merging tone pairs.
We first conducted discriminant analysis using SPSS (SPSS Inc., Chicago, IL) for high- and low-frequency words separately for each subject, but there was no significant difference between the high- and low-frequency words in their classification rates within each subject: high-frequency words (mean = 87.206, SD = 7.866) vs. low-frequency words (mean = 87.694, SD = 9.990) [t(16) = –.291, p = .775]. To have an overall picture of the merging tone pairs with more data points, high-frequency tokens and low-frequency tokens were then analyzed together. Therefore, for each speaker, the dataset contained five groups (T2, T3, T4, T5, T6) with 36 members each (6 syllables × 2 word frequencies × 3 repetitions), which adds up to at most 180 tokens per speaker, as creaky tokens and outliers were not included in the analysis. Both univariate and multivariate outliers were excluded before classification. Cases with a z-score greater than 3.29 were regarded as univariate outliers, and cases with a Mahalanobis distance greater than the critical chi-square value were regarded as multivariate outliers (Tabachnick & Fidell, Reference Tabachnick and Fidell2007:73–75).
A high classification rate in discriminant analysis indicates clear group membership, that is, clear separation of tones. If the tone pairs produced by the participants were merging, these pairs would have similar distributions so that some tokens were likely to be misclassified into a wrong category (e.g., T2 tokens misclassified as T5). This would result in a low classification rate.
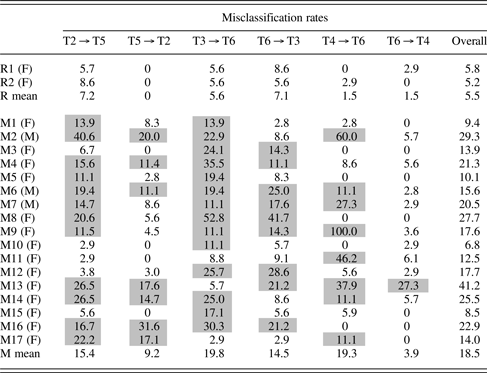
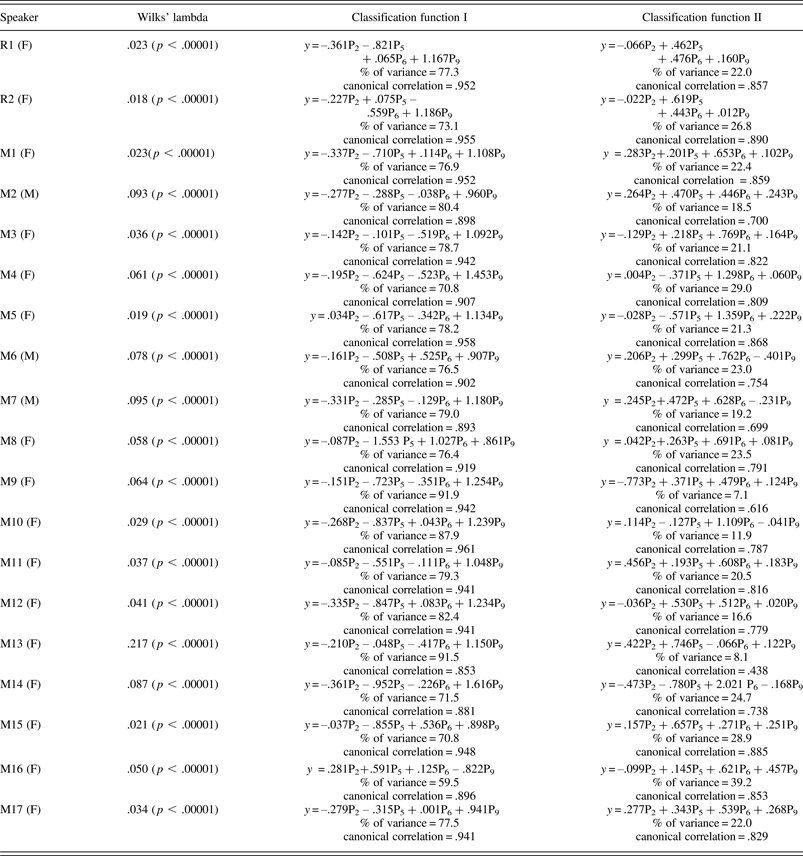
We obtained reference data from two native speakers—the female researcher who produced the perception materials and the first author—who clearly distinguished all six tones using the same experimental materials for comparison. Both speakers had a very high overall classification rate (94.2% and 94.4%), whereas the 17 merging participants had a much lower overall classification rate (mean = 80.5%, SD = 9%). Among the 17 merging participants, the highest classification rate was 93.2% and the lowest classification rate was 58.5%. Table 3 shows the misclassification rates of the merging tone pairs of the two reference speakers and the 17 merging participants. A larger number indicates more misclassification, that is, more overlap between the tones. We only report the misclassification rates for the merging tone pairs here for two reasons. First, this is the focus of the present study. Second, there are 25 tone pairs total, and the misclassification rates of the nonmerging pairs were very low (most of them were 0%). Other details about the results of the predictive discriminant analysis can be found in Appendix A.
Misclassification rates (%) of the merging tone pairs and the overall misclassification rates (%) of two reference speakers (R) and 17 merging subjects (M)
Note: Misclassification rates higher than 10% are shaded for reference. (M) = male; (F) = female.
We can see from Table 3 that even for the two reference speakers, there was slight overlap in the merging tone pairs given their acoustic similarity. Nevertheless, the merging participants had at least one tone pair being misclassified for more than 10% of time, and some pairs were misclassified for a substantial degree (over 30%). Some participants also had very substantial overlap for more than one merging tone pairs (e.g., M2 and M16).
In addition to the T2/T5 pair identified by previous studies, there is clear evidence in the misclassification rates that the T3/T6 and T4/T6 pairs are also merging at different paces. The data also suggest that the merging of tones is not complete, as most speakers show only partial overlap (albeit to a substantial degree for some) in the merging tone pairs, in other words, the tones were classified above chance level (50%). Only one speaker, M8, seemed to merge T3 and T6 completely; 52.8% of her T3 tokens were misclassified as T6 (binomial test, p = .868) and 41.7% of her T6 tokens were misclassified as T3 (binomial test, p = .608), indicating that her T3/T6 discrimination was approaching chance level. Moreover, the individual misidentification rates reveal that the merging of tones is not symmetrical. For most speakers, T2 tokens were more often misidentified as T5 by discriminant analysis than T5 tokens were misidentified as T2, and T4 tokens were more often misclassified as T6 than T6 tokens as T4.
Figure 2 shows the distribution of the production data in the space of the first two canonical discriminant functionsFootnote 1 of four female speakers for visual illustration: R2 (overall classification rate of 94.4%), M10 (highest overall classification rate of 93.2%), M13 (lowest overall classification rate of 58.5%), and M8 (near-complete merge between T3/T6). The tone groups of R2 are well separated, whereas those of M13 are clustered together. Although the overall classification rate of M10 is very similar to R2, her T3 and T6 groups are much closer together and overlap more than those of R2. The T3 and T6 tokens of M8 largely overlap and the group centroids are also very close, suggesting a near-complete merge between T3 and T6 for this speaker.
Scatterplots of the first two canonical discriminant functions of four female speakers.
Discriminant analysis only predicts group membership based on the acoustic data at four static points. Although the results show that the speakers still have distinct tone categories (i.e., tone merging is still in progress), it is unclear whether these categories are canonical or not, and whether these tone categories differ between merging and nonmerging participants. To further explore these issues, we compared the F0 values at the ninth measurement point (i.e., the tone offset) of the three merging tone pairs between merging and nonmerging participants. We divided the participants based on the predictive discriminant analysis results in Table 3. Those with misclassification rates below 10% for a particular tone pair were considered nonmerging participants for that tone pair. Therefore, for T2/T5, R1, R2, M3, M10, M11, M12, and M15 are nonmerging participants; for T3/T6, R1, R2, M11, and M17 are nonmerging participants; and for T4/T6, R1, R2, M1, M3, M4, M5, M8, M10, M12, M15, and M16 are nonmerging participants.
We calculated a quotient for each merging tone pair for each speaker in order to normalize the data for comparison as we had both male and female speakers. The offset of T2 [25] should be higher than that of T5 [23], T3 [33] higher than T6 [22], and T6 [22] higher than T4 [21]. We took the F0 values at the ninth measurement points of the lower tones in these three merging tone pairs as the reference (denominator) and divided the F0 values at the same measurement points of the higher tones (numerator) by this reference. The resultant quotients can represent the distance between the tone pairs. A larger quotient indicates that the tones are more separated and farther apart in the “tone space.” We used a very simple concept of tone space: the pitch range defined by the highest pitch [5] and lowest pitch [1] values of the lexical tones produced by individual speakers. Independent t-tests confirm that the nonmerging participants had significantly larger quotients than the merging participants for all three tone pairs, respectively: T2/T5 (1.19 vs. 1.01 [t(17) = 5.845, p < .0001]), T3/T6 (1.10 vs. 1.07 [t(17) = 2.388, p = .029]), T4/T6 (1.14 vs. 1.08 [t(17) = 2.398, p = .028]). These results clearly show that although the merging participants still had these tone categories, their tones were acoustically more similar than those of the nonmerging participants.
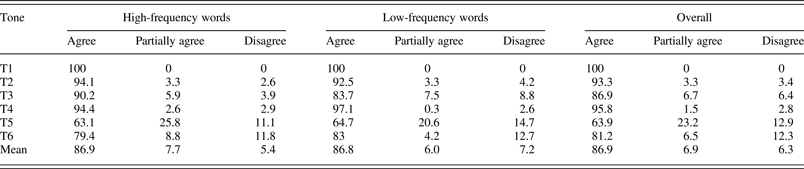
Furthermore, although discriminant analysis illustrates the grouping of the tokens produced by the merging participants based on their fundamental frequencies at four static time points, human perception of the tones may be different from machine recognition. It is unclear whether listeners can identify the target tones accurately given the fact that the distances between tone categories of the merging participants were smaller than those of the control participants. Therefore, we included a qualitative auditory analysis of the data. The produced tones were transcribed by two independent transcribers (see details in the acoustic measurements discussion). Table 4 shows the inter-rater reliability between the two transcribers. When the two transcribers gave the same judgment on a particular token (e.g., T2), it was counted as “agree.” When one transcriber gave an answer that was different from but was still related to the judgment of the other transcriber (e.g., one is T2, the other is between T2 and T5), it was counted as “partially agree.” When the answers of the two transcribers were not related (e.g., one is T2, the other is T5), it was counted as “disagree.” It can be seen that the inter-rater reliability is quite high, except for T5, which means that the qualitative data based on their judgment are reliable, and that T5 was heard to be produced with much variation.
Inter-rater reliability (%) between the two native transcribers
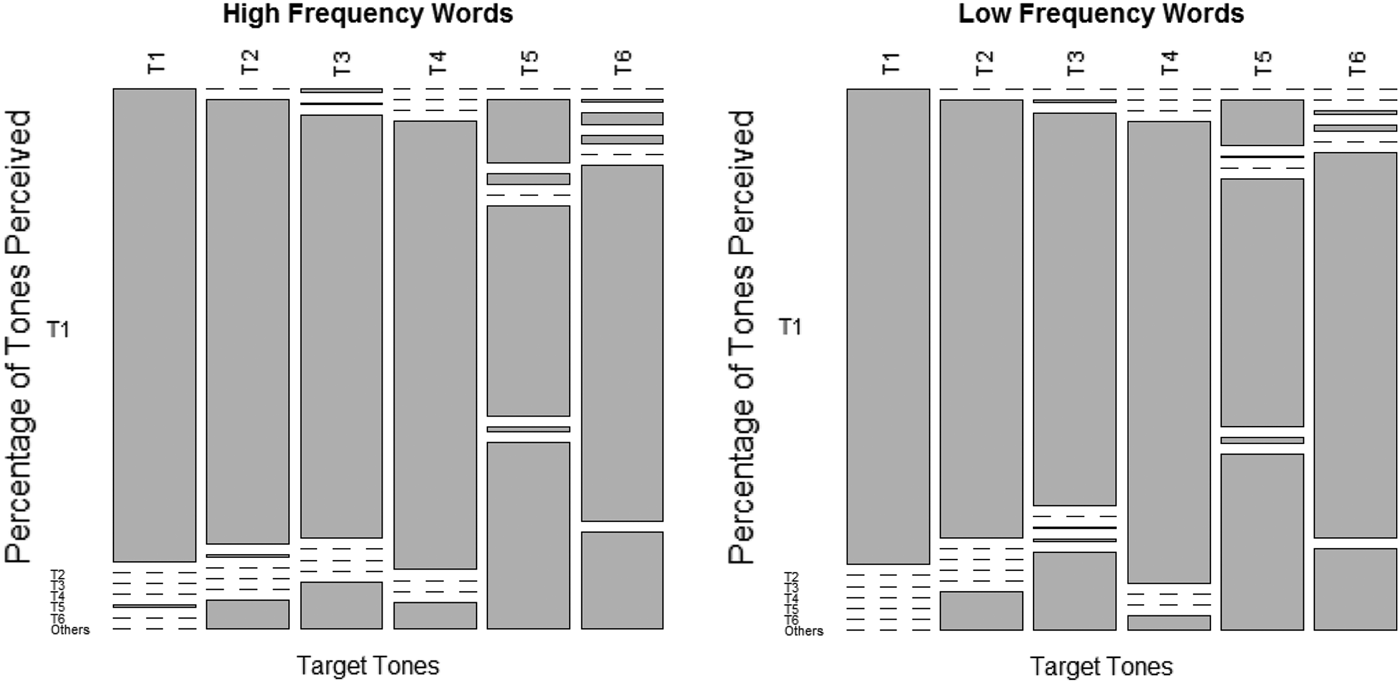
Figure 3 shows the breakdown of tone judgments by the transcribers. The x-axis shows the target tones, and the y-axis shows the actual tones perceived by the transcribers (the six perceived tones and the “others” category being arranged from top to bottom). The blocks in each column represent the percentages of that particular target tone being perceived as each of the six tones or as others (i.e., between two tones or could not be clearly specified). Dotted lines indicate 0%. A token is considered to be produced as a particular tone in Figure 3 when both transcribers heard it as that tone (agree). Partially agree or disagree judgments were all grouped under others in Figure 3. We can see that T1 [55] is the most stable tone as all tokens were heard as T1 by both transcribers (except one high-frequency token mispronounced by a speaker as T5). T5 [23] is the most variable tone because many more tokens were heard as the other tones and as others by the transcribers. If we compare the merging tone pairs, we can see that T2 appears to be more stable than T5, T4 more stable than T6, and T3 and T6 appear to be of comparable variability.
Tone judgment by the native transcribers.
Word (token) frequency does not seem to have any consistent effect on these merging tone pairs, as the perception patterns by the native judges were very similar in Figure 3. Separate t-tests for each tone comparing the high- and low-frequency words in terms of their percentages of change confirm that there is no significant difference between the high- and low-frequency words (T2: t(10) = –.199, p = .864; T3: t(10) = –1.690, p = .122; T4: t(10) = 1.503, p = .164; T5: t(10) = .961, p = .359; T6: t(10) = .863, p = .408).
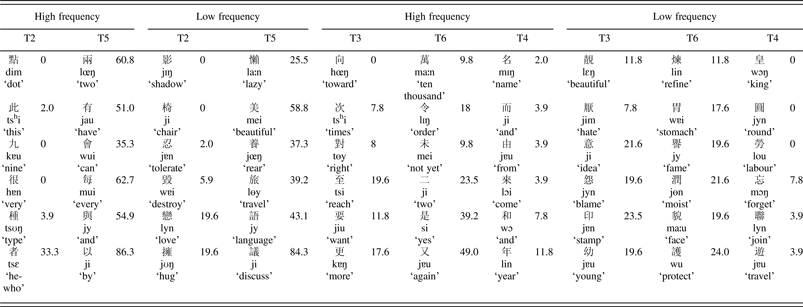
Finally, an interesting pattern can be observed when we consider the likelihood of having noncanonical tone productions for individual words, as Figure 3 shows that the tones differ in the transcribers' perception of their variability. One may expect that words with the same tone and the same word frequency may have similar susceptibility to change. However, this is not always the case. Six monosyllables were used for each tone in each word frequency group in the production experiment. Some words were much more susceptible to change than others were, even when they shared the same tone and word frequency. Table 5 shows the percentage of change for each monosyllable in different tone pairs. There were 51 tokens for each monosyllabic word (3 repetitions × 17 participants). The percentage shows how many of these 51 tokens were judged to be produced noncanonically. It is obvious that some words were correctly produced by all participants, but others were much more likely to have different pronunciation. High-frequency T2 words represent the most extreme case. Most of the variant pronunciation belongs to the word 者 [tsε] (‘he who’) (33.3%), whereas other words in this tone category remain very stable. Taken together, we can see that T5 is more variable than T2, and T6 more variable than T4, not only in terms of the frequency of change (Figure 3), but also in terms of the scope of change (Table 5). It is interesting to note that although T3 and T6 appear to have similar variability in Figure 3, they do not differ much in terms of the number of words affected.
Percentage of change for each monosyllabic word
Note: Phonemic transcription in IPA symbols and the gloss can be found under each monosyllabic word. Many of these are polysemous words. Only the most common meaning is given here.
Perception
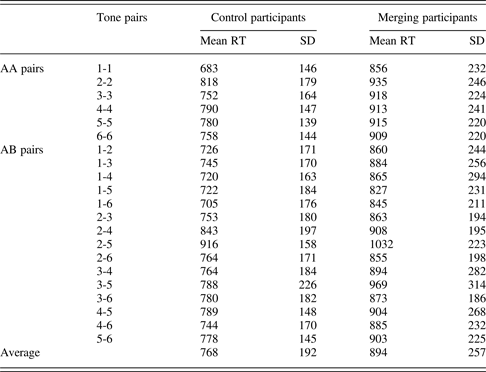
Both accuracy and reaction time data were collected in the perception experiment (AX discrimination of Cantonese monosyllables). The production results show that the merging participants still have six distinct tone categories of the merging tone pairs, although with a reduced tone space compared with that of the nonmerging participants. This pattern can also be found in their perception data. Mixed analyses of variance were conducted to see whether merging and control participants show any difference in tone discrimination accuracy and log-transformed reaction time. Tone pair (21 levels: T1 vs. T1, T1 vs. T2, T1 vs. T3, and so on) was treated as a within-subject factor, and merging status (two levels: control, merging) was treated as a between-subject factor. The result showed that these two groups of participants did not differ in accuracy (F(1, 56) = 7.33, p = .396, η p2 = .013). Both groups performed at ceiling (average overall accuracy over 97%). Nevertheless, the reaction time data reveal a very different picture. The merging participants were significantly slower than the control participants (F(1, 56) = 8.003, p = .006, η p2 = .125). Figure 4 shows their log-transformed reaction time data (LogRT) for both AA and AB pairs. The data were collapsed across presentation order in the experiment. Post hoc independent t-tests confirm that the merging participants were significantly slower than the control participants in all AA and AB pairs (p < .05), except the 2-4 tone pair (with the same pattern, just not significant p = .127). The consistent difference in reaction time was not confined to confusing merging tone pairs alone. It is worth pointing out that the AA pairs were very easy for native speakers to respond to, and yet, the merging participants still performed significantly slower than the control participants did. Their mean actual reaction time data in milliseconds can be found in Appendix B. It can be seen that the merging participants were on average about 150 ms slower than the control participants were, and they had more individual variation as reflected by larger standard deviations. In summary, although the merging participants could still distinguish the six tone categories in perception, they were slower in perceiving the tonal distinction than the control participants were in general, not only for the identified merging tone pairs.
Log-transformed reaction time (LogRT) data for the (A) AA tone pairs and (B) AB tone pairs collapsed across presentation order. The error bars show one standard error. Except the 2-4 pair in (B), all comparisons between the merging and control participants are significant (p < .05).
DISCUSSION
Our results illustrate the patterns of the ongoing tone mergers in Hong Kong Cantonese at the beginning stage. Some young speakers are merging T2 with T5, T3 with T6, and T4 with T6 in production, although they still had six tone categories. Lexical (token) frequency did not have any consistent pattern in the rates of tone change. In terms of perception, although the merging participants could still distinguish the six lexical tones in perception under experimental settings, they were much slower in tone perception than the control participants were in general, which is not confined to the identified merging tone pairs. It is best illustrated by the significant difference in log-transformed reaction time for the T1/T1 pairs between the two subject groups (see Figure 4). The T1/T1 pairs are the easiest for both groups of participants, and T1 is also the most stable and accurate tone for the merging participants. Still, the merging participants performed significantly slower than the control participants in their reaction time. One logical possibility of such a pattern is that the merging participants may be slower doing everything compared with the control participants. However, given our limited reaction time data on only one perceptual task, we cannot simply conclude that the merging participants were systematically slower overall in other activities as well. An alternative explanation is that the merging participants were very cautious in the perception experiment. They had to finish listening to the second syllable and needed a longer processing time in order to make the correct decisions, resulting in ceiling accuracy rates but very long reaction times. Informal enquiry after the perception experiment confirmed this possibility, as some merging participants did report that they were very careful in doing the perception experiment. Some side support for this explanation can be obtained from the control participants as well. They also found the T2/T5 pairs difficult to distinguish, resulting in the longest reaction time among all tone pairs (about 100 to 200 ms longer than other tone pairs, see Appendix B), probably because they were also very careful in distinguishing this tone pair. The extra time needed is consistent with the average difference in reaction time between the control and merging groups (about 150 ms). Thus, we believe that it is safe to say that the merging participants were slower than the control participants in making tonal distinctions in general.
As mentioned, although the merging participants were slower than the control group, their accuracy rate is still quite high (well above 90%), and they did not differ significantly from the control group. In addition to the possibility that they were performing at the ceiling because they still had six tone categories, it is also probable that because the perception data was based on a forced-choice AX discrimination task carried out under time pressure in an experimental setting, the merging participants were focusing their attention to the subtle acoustic cues that they normally would not notice in a naturalistic and noisy environment. Their long reaction time data is good evidence for this behavior. Moreover, the perception task was based on speech materials produced carefully by one trained expert speaker. Distinguishing tones by one careful speaker is much easier for the merging participants than distinguishing tones by multiple speakers, as in normal daily conversation. If we had used a more natural task, the merging participants might not be able to distinguish the tone pairs so well (which may result in an interesting situation similar to the “Bill Peter effect” showing discrepancy between production and perception of near-merger; see Labov, Reference Labov1994:363–364, for more detail). At any rate, these merging participants should be regarded as incomplete “mergers.” Therefore, the tone pairs are just beginning to merge in the language as a whole, and there is much individual variation.
The high degree of individual variation observed in our tone merging data echoes that of segmental sound changes. Production differences both across and within speakers were reported by Gordon and Maclagan (Reference Gordon and Maclagan2001) in their 15-year longitudinal study of the NEAR/SQUARE diphthong merger in New Zealand English. They suggested that initial variability is a general characteristic of the process of sound changes. Such individuals provide an informative indication of the amount of variability during the progress of the merger.
The perception results correspond quite well with the idea that perceptual difficulty/confusion and listeners can contribute to sound change (Ohala, Reference Ohala, Masek, Hendrick and Miller1981, Reference Ohala and Jones1983). The merging participants found the acoustically similar tone pairs difficult in perception, which caused confusion in their own production (comparable to “hypo-correction” in Ohala's term). Whereas the merging participants performed the worst for the T2/T5 pairs in perception in terms of reaction time, they also confused more words in these two tones than other tone pairs in their production (Figure 3 and Table 5). Their relatively better perception performance for the T3/T6 pairs also corresponds with relatively better production of these two tones. Both the control and merging groups found the T1/T1 pair easiest to distinguish. This is not surprising given that T1 [55] is well separated from the other five tones by being at the top of the speakers' normal pitch range (Figure 1). It is perceptually more salient than other tones. T1 is also the most stable tone in the production of the merging participants. Our data clearly show that there is a link between perceptual difficulty and production accuracy. A number of reasons can explain why Yiu (Reference Yiu2009) found no such link between production and perception in her data: (i) she had very few merging participants (five for production, three for perception); (ii) she only examined the T2/T5 pair in detail, whereas we included other merging tone pairs as well; and (iii) her data (accuracy data for perception and F0 contours for production) and analyses may not be sensitive enough to reveal the link between production and perception. At any rate, the actual mechanisms between production and perception in tone merging need to be further explored.
In addition, the adult data concur well with the acquisition patterns of Cantonese-speaking children. Both monolingual and bilingual Cantonese children easily confuse T2 [25] and T5 [23], and T3 [33] and T6 [22]. They also acquire them last (e.g., Ciocca & Lui, Reference Ciocca and Lui2003; Wong et al., Reference Wong, Ciocca and Yung2009), and they find T1 [55] the easiest and acquire it well before other tones (So & Dodd, Reference So and Dodd1995). The parallels between child and adult phonologies (in terms of child acquisition order/difficulty and adult merging pairs) strongly suggest that their patterns stem from the same underlying phonetic cause (Greenlee & Ohala, Reference Greenlee and Ohala1980): subtle differences in a narrow pitch range. The acoustic similarity between the merging tone pairs (see Figure 1) renders them difficult to acquire and particularly susceptible to confusion and sound change. These data suggest that language acquisition, particularly by children, is a likely factor of tone merge.
This study systematically manipulated word frequency in the production experiment. However, the results do not seem to support an effect of word frequency, contrary to the tonal merger data that resulted from syllable contraction in Southern Min (Myers & Li, Reference Myers and Li2009). The F0 patterns of both high- and low-frequency words in the present study are similar, and the transcription data also do not show any consistent difference between high- and low-frequency words. Nevertheless, before we can conclude that word frequency does not have a role in Cantonese tone merging, we should carefully re-examine the effects of word frequency first.
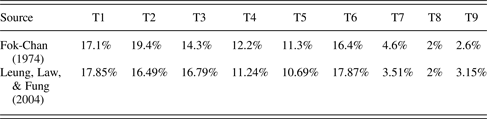
As mentioned in the tone merging in Hong Kong Cantonese section, there are two types of frequency effects on sound change. Reductive sound change tends to affect high-frequency words first, whereas analogical sound change usually starts from low-frequency words first (Bybee, Reference Bybee2007; Hooper, Reference Hooper and Christie1976). Bybee (Reference Bybee2007) argued that reductive sound change originated from the automation of speech production, whereas analogical sound change stems from imperfect learning. In addition, we also need to distinguish token and type frequency. The frequency manipulated in the present study is token frequency as it is based on how frequent a monosyllable appeared in a corpus of Hong Kong newspapers. However, the six lexical tones themselves also differ in type frequency. Table 6 shows the type frequency of all Cantonese tones according to Fok-Chan (Reference Fok-Chan1974) and Leung, Law, and Fung (Reference Leung, Law and Fung2004). The type frequency patterns are very similar in both studies. It is obvious that T2 [25] is more frequent than T5 [23] and T6 [22] is more frequent than T4 [21], whereas T3 [33] and T6 [22] are similar in type frequency.
Type frequency of Cantonese tones
If we consider the differences between reductive and analogical sound change, and between token and type frequency, frequency does seem to play a role in Cantonese tone merging. Tonal merger in Southern Min reported in Myers and Li (Reference Myers and Li2009) is reductive in nature because it is the result of syllable contraction. However, tone merging in Cantonese should not be regarded as reductive sound change, because producing T2 [25] instead of T5 [23] or T3 [33] instead of T6 [22] are not “phonetic shortcuts” due to the automation of speech production. Rather, tone merging in Cantonese should be regarded as analogical sound change resulting from perceptual difficulty and imperfect learning, as we have discussed. If that is the case, we would expect low type frequency words to be affected more than high type frequency words as they are under more pressure to conform. This is indeed what we found. Information given in Figure 3 and Tables 4 and 5 all show that T5 [23] (with the lowest type frequency) is more variable than T2 [25] (with a high type frequency) for words with both high- and low-token frequency. T3 [33] and T6 [22] have comparable type frequency, and they also have comparable variability in tone production. T1 [55] has a high type frequency and it is also very stable. Nevertheless, given the small number of tones in the inventory and the uncertainties about tone stability, it is possible that this observed pattern could be a coincidence. Despite this possibility, we believe that our data do lend some support for the effects of type frequency on tone merging.
Another possible factor contributing to the low type frequency of T5 is the phonetic difficulties in producing tones. Tone type frequency tends to negatively correlate with the phonetic difficulty of producing different tones (e.g., Zhang, Reference Zhang2001). It is possible that the relative difficulty in the finer control of the gentle slope of F0 change may lead to the low type frequency of T5 and thus makes T5 most susceptible to tone merging. If that is the case, articulatory processes might also be involved in the T5 to T2 merge, which could possibly be characterized as an ongoing reductive process. Clearly, more empirical data are needed to substantiate this possibility.
One intriguing question remains, however. T6 [22] has a higher type frequency than T4 [21], but T4 is much more stable than T6. This seems to contradict the patterns of type frequency and analogical sound change that we have discussed. Nevertheless, whereas T2/T5 and T3/T6 differ mainly in F0 patterns, T4 [21] and T6 [22] differ in voice quality as well. T4 [21] ends in the lowest pitch level, which often results in creaky voice. Given that creaky voice is an additional cue to T4 (Yu & Lam, Reference Yu and Lam2011), it is understandable why T4 remains much more stable than T6 despite the difference in type frequency. In fact, Figure 3 and Tables 4 and 5 show that T4 is the second most stable tone after T1. The salient concomitant feature of creaky voice may override the effect of word frequency. Thus, we can conclude that the effects of word frequency (type) and sound change (analogical) can be found in Cantonese tone merging, but language-specific situations must also be taken into consideration.
If we compare the acoustic data with the transcription data, one discrepant pattern can be observed. In the acoustic data, more T2 tokens were misidentified as T5 than T5 tokens were misidentified as T2 by discriminant analysis (Table 3), whereas the transcribers perceived more T5 tokens as T2 than T2 tokens as T5 (Table 5). One possible reason may be because the auditory analysis was based only on the judgments of two independent transcribers; their transcriptions may not be as representative as the objective analyses of the acoustic data of the 17 speakers. Nevertheless, given the high inter-rater reliability between the two transcribers (Table 4), this should not be a major reason for the discrepant pattern. A more probable reason may be that human and machine recognition were based on different sets of data. Machine recognition (discriminant analysis) only relied on the F0 data of four static points, whereas human perception had the benefit of listening to the whole pitch contours in context. In addition, human perception may be more sensitive to differences in the slope of pitch change, which were not represented in the discriminant analysis data, particularly given that the major difference between T2 and T5 lies on the slope toward the end of the tone (see Figure 1). Machine recognition may also suffer from the fact that the endpoint of the pitch contour (the tenth measurement point), which represents the maximal difference between T2 and T5, is omitted from analysis. A further possibility is that statistical distributions may not have direct mappings in the perceptual space. This is best illustrated by the slight misclassification of T2 into T5 (but zero misclassification of T5 into T2) of the two reference speakers who clearly distinguish all six tones (see Table 3). In any case, this discrepant pattern is intriguing and is worthy of further exploration.
Our data can also shed light on how sound change spreads through the lexicon. Wang (Reference Wang1969; see also Wang & Chen, Reference Wang, Chen and Wang1977) documented sound changes that occurred gradually over a long period of time and found that not all words were equally affected. He proposed the idea of lexical diffusion to account for such observations and concluded that most types of phonological sound change are phonetically abrupt but lexically gradual. Labov (Reference Labov1981) and Philips (Reference Philips1984, Reference Philips, Bybee and Hopper2001) linked lexical diffusion with different types of frequency effects.
Our synchronic data of sound change in progress support the idea of lexical diffusion as words with the same tone and the same token frequency were affected differently (see Table 5). The extreme case of high-frequency T2 words illustrates lexically gradual change very well. However, our data also show that sound change can be phonetically gradual too. Figure 3 shows that while some tone production was changed categorically (e.g., T5 changed to T2), a significant portion of tone change was classified as others by the transcribers; in other words, they were heard to be intermediate between two tones or could not be clearly specified. These tokens represent small gradual phonetic changes. Therefore, our data not only provide evidence to support the idea of lexical diffusion synchronically at the suprasegmental level, they also demonstrate that sound change by lexical diffusion can be gradual both phonetically and lexically (Bybee, Reference Bybee2007).
A related issue is why some words are more prone to sound change than others are. If we consider high-frequency T2 words, it is possible that the morphological status of a word may be at work as 者 [tsɛ] (‘he-who’) is a suffix. Moreover, polysemy may also be involved, as the high-frequency T5 word 以 [ji] has many meanings. These two words were much more likely to change than other words in the same tone and frequency categories. Although such suggestions are interesting and worthy of further exploration, caution should be taken as many monosyllabic Chinese (Cantonese) words are polysemous, including many of those in Table 5. Moreover, the morphological status of Chinese (Cantonese) words, such as, part of speech, can sometimes be difficult to determine as Chinese lacks morphological marking in association with categorical alternations (Chao, Reference Chao1968; Li & Thompson, Reference Li and Thompson1981). Despite these limitations, the relationship between word properties (besides word frequency) and sound change is worth pursuing in future studies.
Our synchronic data on Cantonese tone merging conform well to many important factors in sound change discussed in the literature: phonetic similarity, perceptual difficulty, imperfect acquisition, frequency effects, and lexical diffusion. However, one interesting question remains: Why are the tone pairs merging in recent years? Our phonetic study cannot give any concrete answers to this interesting question, but we can provide some sociolinguistic speculations for future investigations. The dynamic demographic composition and language contact in Hong Kong over the past 60 years may be one of the reasons triggering the merging of tones. Waves of refugees from different parts of China came to Hong Kong in the late 1940s to the early 1970s, bringing with them many different Chinese dialects. Even after 1980 when strict immigration laws were implemented in Hong Kong, different Chinese dialects continue to interact with Hong Kong Cantonese through cross-border marriage (e.g., children of such families may be influenced by the nonstandard Cantonese tones of their mainland mothers). Moreover, the influence of Mandarin is increasing in Hong Kong after the 1997 handover. All this resulted in increased language contact and interaction. Such external forces may provide an explanation for the merging of tones in recent years.
Our study investigated the initial stages of tone merging in progress in Cantonese. Future studies on the same topic are needed to track the merger development longitudinally. Gordon and Maclagan's (Reference Gordon and Maclagan2001) study clearly shows how systematic longitudinal investigation of the same sound change can provide a much more comprehensive understanding of the change involved, because unexpected development can occur. In addition, future studies can investigate the effects of gender differences on tone merger more systematically as prior work has shown that women often lead certain types of language change (Labov, Reference Labov2001), although our data did not show any significant difference between male and female participants. Given the small number of male participants in our study, our results may not reveal the whole picture of gender effects. More detailed background information of the merging participants should also be collected in order to confirm our speculations about the effects of the demographic composition and language contact in Hong Kong, which may have contributed to the merging of tones. Interesting patterns are likely to emerge.
Modern Hong Kong Cantonese is undergoing many changes at both the segmental and suprasegmental levels, but most previous studies only dealt with segmental sound changes. The results of the present study contribute to the overall picture of sound changes happening in Cantonese phonology. In addition to illustrating the patterns of the early ongoing tone merging process in Cantonese, this study also provides synchronic suprasegmental data to elucidate the various important factors in sound change and a better understanding of the forces of sound change in general.
APPENDIX A
Detailed results of the predictive discriminant analysis of two reference speakers (R) and 17 merging subjects (M)
APPENDIX B
Mean reaction time data (ms) of all participants