




Introduction
In 1707, when Cornelia Wijns died in Rijkevorsel, she had an outstanding debt of ten and a half stuivers to Mr Willem De Bie, the schoolteacher of one of her children. This brief reference in her probate inventory provides a wealth of information about literacy levels in the Campine area in the eighteenth century. She was the wife of a Campine farmer who probably owned between three and five hectares of land.Footnote 1 Still, she was able and willing to send her children to school, and she and her daughters were among the forty-four per cent of women who became literate. This reference becomes even more interesting in light of the fact that in Kallo, a village only forty kilometres to the southwest of Rijkevorsel, no such school fees were found, and our data show that only twenty-five per cent of the women were literate. Why is there such a huge discrepancy between the female literacy rates in the Antwerp Campine area and the Scheldt Polder region, two neighbouring rural areas, in the eighteenth century?
This article argues that rural literacy has to be understood as a functional skill embedded in local economic and labour systems. In the Campine area, women’s participation in dairy- and household-based commercial activities generated strong incentives to acquire literacy, whereas in the Scheldt Polder region, a highly unequal market economy, such incentives were far weaker. Based on these conclusions, we show that neighbouring rural regions, embedded in highly similar legal and institutional frameworks, developed sharply diverging gendered literacy patterns. By foregrounding these economic incentives, we challenge explanations that attribute literacy differences to institutional factors such as schooling systems or the “girl power” thesis. The girl power thesis posits that the European Marriage Pattern, characterized by consensual and late marriage, empowered women by increasing their participation in labour markets and fostering human capital formation.Footnote 2 Neither the schooling system nor women’s marriage and inheritance practices diverged significantly, however.
With this question, we position ourselves in various historiographical debates. Socioeconomic historians have a long track record of seeking to explain divergent literacy rates in premodern Europe, often by making national comparisons. Some of the highest literacy rates have been found in Scandinavia, Germany, the Netherlands, and Northern France. In these regions, more than seventy per cent of all males and forty per cent of all females could sign their names around 1800. These were closely followed by England and Scotland. Other regions, more to the south and east, however, showed remarkably low literacy rates.Footnote 3
The Southern Low Countries present something of a conundrum, as they appear to be both the most and the least literate regions in Europe. According to Jaime Reis, the literacy rate in the Southern Low Countries was similar to that in England.Footnote 4 Nevertheless, Gerrit Verhoeven labelled the Austrian Netherlands “the country that could not read”. By the middle of the eighteenth century, on average, only forty-eight per cent of the population could sign their name when asked to do so in court. Verhoeven nuances the picture by showing that numeracy levels were much higher and almost on par with those of the most advanced economies, but the bleak picture of literacy remains.Footnote 5 Buringh and van Zanden were even more pessimistic, listing the Southern Low Countries among the most illiterate regions. They used book consumption as a proxy. According to them, Belgium reached a literacy rate of twenty-five per cent in the seventeenth century but plummeted to a meagre thirteen per cent in the eighteenth century.Footnote 6 These stark differences result from the chosen methodologies. None of these studies can effectively measure literacy rates, and each has to resort to proxies. Because they rely on different kinds of proxies, whether book production, signatures on certificates, or court testimonies, a fundamentally different picture arises.
Several arguments have been made to explain these macro-level, national discrepancies. Scholars have looked at religion, economic growth, and institutional factors. Protestant regions and countries that experienced economic growth between the sixteenth and eighteenth centuries seem to have advanced rapidly, while others remained stable or even lost ground. There is consensus that both supply and demand factors played a role.Footnote 7 Nevertheless, some fundamental problems arise when taking such a macro-level approach. Huge divergences in literacy rates occur within countries, despite similar broad economic and cultural patterns. At the national level, based on modern-day nation-states, it makes little sense to study literacy rates in the premodern period.
The proxies used to reconstruct country-wide literacy rates, such as school enrolment or book production, are highly flawed. As we will show in this article, book production does not say anything about book consumption, nor about the reading of other kinds of documents and paperwork. Similarly, the presence or absence of a school cannot prove local school attendance. Scholars have shown that students can learn to read outside the formal school system.Footnote 8 In addition, we will show that schools could attract students from a wide area, rather than just recruit locally.
When discussing macro-level explanations for women’s literacy rates, one explanation stands out and deserves more attention.Footnote 9 Alexandra de Pleijt, Tine De Moor, Jan Luiten van Zanden, and Sarah Carmichael have all added proof that “girl power” was essential.Footnote 10 They showed that in northwestern Europe, where women married later in life, earned a living before marriage, and enjoyed favourable legal institutions (regarding inheritance, marriage, and agency), women were more literate and numerate, and therefore average literacy and numeracy rates were higher. Both the European Marriage Pattern itself and its effect on literacy have been strongly contested, however. There is no proof that women in Southern Europe, especially in Portugal, faced greater discrimination, and the age at marriage or the proportion of women who never married does not show a clear distinction between northwestern Europe and the rest of Europe.Footnote 11 Moreover, several authors have noted that the type of work women performed mattered more than marriage patterns in explaining their human capital formation.Footnote 12
In this article, we join the ranks of scholars who have taken a meso-level approach and examined literacy rates at the regional level. This meso-level approach avoids the problems of both macro- and micro-level analyses. We want to identify regional patterns rather than possible micro-level exceptions, while still retaining the ability to dig deep and explore the socioeconomic, cultural, and institutional explanations. We are particularly intrigued by the preliminary findings that it is not the most economically advanced rural market economies that stand out regarding literacy – on the contrary. Dairy-producing and mountainous districts with lower GDP figures but more independent peasants tended to have higher literacy rates than regions where landless labourers, market-oriented agriculture, large land inequality, and child labour were more common.Footnote 13 Similar patterns have been observed in small English towns. Centres where independent craftsmen or commodity producers dominated tended to have higher levels of education.Footnote 14
Unfortunately, though, it is still unclear whether this pattern can be generalized or what the main drivers of these regional differences are. One interesting explanation is what Nilsson and others call a more powerful “transactional technology” among farmers. Farmers, especially those in mixed farming regions, needed to understand and participate in ever more commercially developing markets for goods, credit, and land, which made functional literacy an essential tool for independent peasants. We start from this hypothesis and make it our research question. Did farmers or peasants, indeed, invest in literacy skills because their economic activities benefited from men and women in the household with basic reading and writing skills? To answer these types of questions, some scholars have examined the role of women in the household, proto-industrial activities, and rural specializations, while others have examined regional educational and cultural practices. In this article, we want to include all of these possible variables. We will therefore reconstruct levels of inequality, occupational structures and roles, material culture, and education systems.Footnote 15
Research Design and Approach
This article adopts a meso-level comparative approach, focusing on regional socioeconomic systems rather than national aggregates or isolated village microhistories. By meso-level, we refer to the scale at which agrarian organization, labour opportunities, household structures, and market integration form coherent economic regimes. This level of analysis is necessary to understand why literacy incentives diverged so sharply within the Southern Low Countries, even under shared institutional, religious, and legal frameworks. This approach fits within a broader research tradition that examines rural regions or social agrosystems.Footnote 16
We opted for two distinct rural regions within the Austrian Low Countries: first, because the debate over literacy rates in this broader region remains unresolved; second, because the Southern Low Countries provide a wealth of different socioeconomic regions within the same overarching political entity. Our comparison between the Antwerp Campine area and the Scheldt Polder region follows a controlled-comparison logic. Both regions belonged to the Catholic Austrian Netherlands, shared the same legal and inheritance systems, and, after the 1778 imperial edict, followed the same procedures for signing marriage certificates. They therefore provide an ideal setting to isolate the effect of economic structure on literacy, since the two regions differed fundamentally in their agrarian organization and labour markets.
The Antwerp Campine area was characterized by smallholders, mixed farming, and widespread female participation in dairy and cottage-industry production. While rural households were integrated into local and regional commodity markets, this was not a market economy in which land, labour, and capital were allocated primarily through the market. Specialized, fully commercialized agricultural production did not emerge in the premodern period, and agricultural producers remained peasants. The Scheldt Polder region was the best example of agrarian capitalism in the Southern Low Countries. This was a true market economy, where land, labour, and capital were commodified. Large tenant farmers were the dominant social group; there was high inequality, and wage-dependent labourers produced agricultural products in a specialized arable economy. Cottage industries were much more limited, and dairy production was reserved for specialized cattle holders.Footnote 17 The nature of “commercialization” therefore differed profoundly between the two regions: in the Antwerp Campine, it grew out of peasant household enterprise, while in the polders it was controlled by large-scale tenants and absentee landlords. These contrasts allow us to investigate how gendered labour opportunities shaped the willingness and ability to invest in literacy.
For each region, we selected a cluster of villages representative of their local agrarian structures and for which the most complete sets of eighteenth-century sources survive. The Antwerp Campine sample (Balen, Beerse, Brecht, Herenthout, Loenhout, Rijkevorsel, and Zammel) reflects the smallholding, mixed-farming economy typical of the region, while the Polder sample (Doel, Kallo, Kieldrecht, and Verrebroek) captures the core of the polder agrarian structure on the left bank of the River Scheldt. The villages are spread throughout their respective regions (Figure 1). We opted for the left bank of the Scheldt because the arable villages on this side show the typical structure of large farms with abundant agricultural labourers, which is less common on the right bank of the river. This way, the two selected regions are on opposite sides of the economic spectrum. Source availability guided the selection of the individual villages: these villages preserve sufficiently large and continuous series of marriage certificates, probate inventories, and parish materials to allow a systematic comparison.
Map of the Scheldt Polder region and Antwerp Campine area, including all selected case studies.

Figure 1 Long description
The Antwerp Scheldt Polders and Antwerp Campine regions. The Antwerp Scheldt Polders area includes villages such as Doel, Kieldrecht, Verrebroek and Kallo, located on the left bank of the Scheldt River. The Antwerp Campine region features villages like Loenhout, Brecht, Rijkevorsel, Beerse, Turnhout, Arendonk, Retie, Dessel, Mol, Balen, Herentals, Herenthout, Zammel and Lier. The map highlights the geographical distribution of these villages within their respective regions, with the Scheldt River running between them. An inset map shows the location of these regions within a larger geographical context.
Unfortunately, the overlap is not perfect. For some villages, we had a large dataset of probate inventories but no signatures, and vice versa. Since we want to paint a picture of regional patterns, we have opted to include these additional sources to expand the total source material. The Scheldt Polder region is underrepresented in both the number of case studies and the selected probate inventories because it harboured fewer villages, was less densely populated, and had fewer people who left probate inventories. Many landless labourers were too poor to register any assets in a probate inventory. We acknowledge that survival patterns differ between regions, but the analytical framework relies on aligned source types, not identical archival completeness.
Our core quantitative evidence of literacy rates derives from marriage certificates between 1779 and 1788, the decade in which Maria Theresa’s edict required all contracting parties and witnesses to sign their names. Older marriage certificates cannot be used, because there was no formal requirement to sign them. Only a few sources are available for studying education and literacy in the premodern period. All of them are flawed and cannot fully compensate for the lack of schooling data. The most important indicator is the ability to sign one’s name. Scholars have analysed marriage certificates and other legal documents to assess the writing and reading proficiency of historical societies. Before the introduction of modern schooling, reading was learned first, and only afterwards did students get basic training in writing.Footnote 18 Therefore, the ability to sign a certificate is evidence of at least a basic ability to read and write. We are aware that paying attention to the fluency of handwriting and the difference between providing initials and a full name could be highly relevant to literacy research.Footnote 19 Nevertheless, we opted for a dichotomous approach, in which an X mark is interpreted as evidence of illiteracy and all other signatures are taken as signs of literacy. These records provide directly comparable literacy indicators across regions and genders.
To reconstruct occupational structures, book ownership, educational objects, and school fees, we used a dataset of probate inventories. Probate inventories span a broader period (the mid-seventeenth to the late eighteenth century). If we had selected only probate inventories from the period 1778 to 1788, the selection would have been too small to provide significant results. Moreover, not all municipal archives have left a good series of probate inventories. We selected those villages that had a well-preserved archival series from the orphans’ chambers. Otherwise, we would have had to deal with a huge survival bias or probate inventories from only the wealthiest members of society, which would have skewed our analysis. The inventories are used not to measure long-term trends but to reconstruct the material culture of literacy, household economic practices, and the existence of school fees in the long eighteenth century. Their demographic bias towards households with minors makes them particularly suited for studying literacy investment. Additional materials, such as schooling records, Latin school registers, parish archives, and land/cattle registers, provide contextual information on the supply of education and the economic environment in which literacy was demanded.
By combining these source types, we deliberately bridge quantitative and qualitative methods. Marriage certificates identify literacy outcomes; probate inventories reveal the material and economic motivations underlying literacy; and schooling data allow us to assess the supply-side context without assuming a linear relationship between schooling and literacy. Each type of evidence has limitations. School presence does not equal attendance, probate inventories underrepresent book ownership, and marriage signatures reflect minimal writing ability rather than reading proficiency. However, together they allow us to triangulate the socioeconomic mechanisms that shaped literacy in two neighbouring rural societies.
In this article, we proceed in five steps. We begin by outlining the existing findings on literacy in the Southern Low Countries. We then present our new evidence from the 1778–1788 marriage certificates in two case studies, which reveals striking regional and gendered differences between the Antwerp Campine area and the Scheldt polders. This is followed by analysis of the supply side of literacy, examining the availability and organization of schooling in both regions. Next, we turn to the demand side, showing how rural labour markets, household economies, and commercial opportunities shaped the incentives to acquire reading and writing skills. In the last section, we bring these elements together to explain the contrasting literacy patterns observed.
Witnessing Literacy: The Marriage Records
Very few quantitative studies have been conducted for the Southern Low Countries. Recent studies suggest rather low literacy rates. We have already mentioned the studies by Verhoeven and Buringh and van Zanden, which painted a rather dire picture for literacy rates in the Southern Low Countries.Footnote 20
These recent studies, based on book production and court testimonies, contrast starkly with some prior studies that used marriage records. Many of these studies are in Dutch and published in older publications, which is why they are often ignored in the historiographical debate (see Table 1). We added the marriage certificates from nine villages in our two selected regions, allowing a systematic comparison (see Table 2). There were, however, important differences between the two regions regarding witnesses. While in the Campine area witnesses were always male, in the Polder region, a man and a woman most often served as witnesses for the married couple. On occasion, two women signed as witnesses. This is not a matter of different legal structures. The imperial edict for the entire Habsburg Low Countries required the presence of two witnesses, without stipulating their gender. The discrepancy is the result of local customs and preferences. It is difficult to pinpoint the reason for these differences. We constructed a sample of 500 marriage certificates for the period 1779 to 1788, 250 from the Antwerp Campine area and 250 from the Scheldt Polder region.Footnote 21
Literacy rates in various provinces and localities in the Southern Low Countries in the final decades of the eighteenth century

Table 1 Long description
Literacy percentages are listed by region and period, with columns for overall literacy, male literacy, and female literacy. Brabant in 1778 to 1792 reports 50 per cent overall, 62 per cent male, and 39 per cent female. West Flanders in 1785 reports 37 per cent overall, and East Flanders in 1785 reports 36 per cent overall. Sint Niklaas in 1785 lists 63.50 per cent male and 34.40 per cent female, with no overall value. Kalmthout in 1780 to 1789 reports 62 per cent overall, Wuustwezel in 1780 to 1789 reports 64 per cent overall, and Loenhout in 1780 to 1789 reports 47 per cent overall. Turnhout in 1780 to 1789 lists 50 per cent male and 45 per cent female, with no overall value. Several rows have blank cells where male, female, or overall literacy is not provided.
Sources: Joseph Ruwet and Yves Wellemans, L’analphabétisme en Belgique (XVIIIème-XIXème siècles) (Leuven, 1978); G. Algoet and Chris Vandenbroeke, “Alfabetisme in Vlaanderen en inzonderheid in Zuidelijk-Vlaanderen (einde 18de eeuw tot 1870)”, Jaarboek van de geschied- en heemkundige kring “De Gaverstreke” (1977), pp. 142–178, 149; Erik Vanhaute, De invloed van de groei van het industrieel kapitalisme en van de centrale staat op een agrarisch Grensgebied: De Noorderkempen in de 19de Eeuw (1750–1910) (Brussels, 1990); Christine Keuppens, “Bijdrage tot de studie van het analfabetisme en lager onderwijs te Turnhout (1795–1854)”, Taxandria, 28 (1966), pp. 3–96; P. De Zuttere, “Loenhout en Wuustwezel. Analfabetisme op het einde van de 18de eeuw”, Oudheid en Kunst, 38 (1955), pp. 164–172.
Literacy rates among brides and grooms in the Antwerp Campine and Polder villages, 1779–1788: regional variation (in %)

Table 2 Long description
Literacy rates are listed as percentages for grooms, brides, and couples combined across villages and two regional totals. Campine villages: Balen has 45 per cent groom, 53 per cent bride, 49 per cent combined; Beerse 72, 55, 64; Brecht 66, 39, 53; Loenhout 56, 34, 45; Zammel 73, 37, 55; Total Campine area 63, 44, 54. Polder villages: Doel has 59 per cent groom, 44 per cent bride, 52 per cent combined; Kallo 67, 25, 46; Kieldrecht 53, 23, 38; Verrebroek 66, 20, 43; Total Polder region 61, 28, 45. Across all listed rows, groom literacy is higher than bride literacy in every case except Balen, where the bride rate exceeds the groom rate.
Table 2 shows the literacy rates for grooms and brides in the two regions and contradicts the previous gloomy picture sketched for the Southern Low Countries. Brabant and the Scheldt Polder region are on par with England, where, according to De Pleijt, fifty-six per cent of men and thirty-six per cent of women were literate around 1750, and sixty-four per cent of men and forty-two per cent of women had become literate by 1800.Footnote 22 Brabant’s literacy rate was significantly higher than that of France and several regions in Italy. Nevertheless, it was much lower than some of the most literate areas of Germany and the Netherlands.Footnote 23
However, while the overall averages are higher than expected, there are some crucial discrepancies. Firstly, the Antwerp Campine area was more literate than the Polder region, primarily because of gender differences between the regions. Table 3 looks more closely at the gender literacy patterns by including grooms, brides, and the male and female witnesses. The Campine–Polder difference for grooms and for men in general is not statistically significant. For women, however, both brides and women in general show a statistically significant Campine–Polder difference.
Signing rates, marriage certificates in the Antwerp Campine and Polder regions

Table 3 Long description
Literacy rates are listed as percentages with sample sizes for Campine and Polder, by role on marriage certificates, plus a chi squared significance test for some rows. For grooms, Campine has N 250 and 63 per cent, and Polder has N 250 and 61 per cent, with the test marked not significant. For brides, Campine has N 250 and 44 per cent, and Polder has N 250 and 28 per cent, with the test marked significant and p less than 0.001. For male witnesses, Campine has N 500 and 69 per cent, and Polder has N 267 and 66 per cent, with no significance entry shown. For female witnesses, Campine is listed as none, while Polder has N 235 and 46 per cent, with no significance entry shown. For all men combined, Campine has N 750 and 67 per cent, and Polder has N 517 and 63 per cent, with the test marked not significant. For all women combined, Campine has N 250 and 44 per cent, and Polder has N 485 and 37 per cent, with the test marked significant at the 90 per cent probability level and p equals 0.078.
A χ2 test is a statistical hypothesis test used to determine whether there is a significant difference between expected and observed results. In this table, = means not significant;
* means significant at the 90 per cent probability level;
*** means significant at the 99 per cent probability level.
Literacy among polder brides was very low. The picture changes when we take the female witnesses into account. Unfortunately, we do not have female witnesses for the Campine area, but in the Polder region forty-six per cent of all female witnesses could sign their names. It does appear that the selection of witnesses, both male and female, was not random. Brides and grooms tended to select literate family members, friends, or neighbours as their witnesses. Since signing the marriage register was the main duty of a witness, this biased choice is logical. The same pattern was seen in Italy. There, witnesses were often not even friends or relatives, but esteemed members of the community, like clerks, who were disproportionately literate.Footnote 24 In the 1780s, literacy rates for men in the Antwerp Campine and the polder villages were very similar; Campine women, however, were significantly more literate than their polder counterparts, raising Campine literacy to a relatively high level.
Finally, we want to look at the social profiles of the brides, grooms, and witnesses. Several marriage certificates contain information on the profession or social status of the signatories. This was especially the case in the Antwerp Campine villages.Footnote 25 In the polder villages, registration of social position or professional activity was much rarer.Footnote 26 Each parish priest used his own classification system. In this article we used the HISCLASS codes to categorize the brides, grooms, and witnesses in the marriage registers (Table 4).Footnote 27
HISCLASS codes used and clustered for the social analysis

Table 4 Long description
Columns list HISCLASS, Class, HISCLASS codes, and Professions. Row 1 pairs HISCLASS 1 with Class, Elite, codes 1 to 2, and professions bailiff, alderman, imperial commissioner, and priest. Row 2 pairs HISCLASS 2 with Class, Lower middle class, codes 3 to 4 to 5, and professions teacher, merchant, shopkeeper, student, and vicar. Row 3 pairs HISCLASS 3 with Class, Skilled workers, codes 6 to 7, and profession craftsman. Row 4 pairs HISCLASS 4 with Class, Farmers, code 8, and professions farmer and tenant farmer. Row 5 pairs HISCLASS 5 with Class, Unskilled workers, codes 9 to 10 to 11 to 12, and professions labourer, maid, servant, weaver, and carder.
Table 5 shows both expected and surprising results. First, the higher the social class, the more literate the brides, grooms, and witnesses were. The elite class 1 required formal schooling; therefore, all individuals in this class could sign their names. However, even among the male lower middle classes, average literacy rates stood at sixty-seven per cent. Skilled craftsmen may not always have needed to be literate to practise their profession, as such, but they were generally more literate than the average village dweller. This corresponds with the findings of Hoyler and Schofield for England, where literacy rates in Melton Mowbray were much higher because the number of shopkeepers, innkeepers, and craftsmen was higher than in the surrounding areas.Footnote 28 The farmers’ category scored remarkably well in our two selected regions, and, as the largest group in these rural regions, they defined the average literacy rate. For the male farmers, there is no significant difference between the Antwerp Campine area and the polders.Footnote 29
Literacy rates of grooms, brides, and male witnesses, divided into five broad social categories, based on HISCLASS

Table 5 Long description
Literacy rates in per cent are listed with counts, N, for grooms and brides in two regions, Antwerp Campine region and Scheldt Polder region, and for male witnesses in Antwerp Campine region only, grouped by HISCLASS from 1 Elite to 5 Unskilled workers. For grooms in Antwerp Campine region, N is 3 with 100 per cent for 1 Elite, N is 23 with 83 per cent for 3 Skilled workers, N is 101 with 61 per cent for 4 Farmers, and N is 60 with 53 per cent for 5 Unskilled workers; 2 Lower middle class has N of 1 with no literacy rate shown. For grooms in Scheldt Polder region, 1 Elite has N of 0 with no literacy rate shown, 2 Lower middle class has N of 1 with 100 per cent, 3 Skilled workers has N of 10 with 50 per cent, 4 Farmers has N of 22 with 64 per cent, and 5 Unskilled workers has N of 34 with 44 per cent. For brides in Antwerp Campine region, 1 Elite and 2 Lower middle class each have N of 0 with no literacy rate shown, 3 Skilled workers has N of 2 with 50 per cent, 4 Farmers has N of 111 with 49 per cent, and 5 Unskilled workers has N of 43 with 37 per cent. For brides in Scheldt Polder region, 1 Elite and 2 Lower middle class each have N of 0 with no literacy rate shown, 3 Skilled workers has N of 3 with 33 per cent, 4 Farmers has N of 14 with 7 per cent, and 5 Unskilled workers has N of 13 with 8 per cent. For male witnesses in Antwerp Campine region, literacy rates are 100 per cent for 1 Elite with N of 3, 75 per cent for 2 Lower middle class with N of 4, 91 per cent for 3 Skilled workers with N of 21, 65 per cent for 4 Farmers with N of 134, and 62 per cent for 5 Unskilled workers with N of 34; the Scheldt Polder region columns for male witnesses are blank.
This is where the obvious results and similarities stop, however. Firstly, in the Antwerp Campine area craftsmen scored remarkably higher than their polder counterparts. We must be cautious given the small number of craftsmen in the Polder sample, but the difference is large and significant, at least for men.Footnote 30 The majority of the craftsmen in the Campine area (eighty-three to ninety-one per cent) could sign their names. In the Polder region, which was known for its craftsmen, who were firmly integrated into Antwerp’s trade networks and were among the most prosperous in the region according to Wout Vande Sompele, only fifty per cent of male artisans signed their marriage certificate without an X.Footnote 31 For female artisans, the number of cases was too limited to perform a reliable significance test.
Secondly, more than half of the unskilled male grooms and sixty-two per cent of unskilled witnesses in the Antwerp Campine area were literate. This is remarkable, even in an international context. Schofield showed that forty-one per cent of English labourers and servants were literate between 1754 and 1784. Algoet and Vandenbroeke had already noted that the higher the share of day labourers and textile workers, the lower the literacy rate.Footnote 32 The contrast with the Polder region is even greater, where only forty-four per cent of unskilled male labourers could sign their certificates. However, this regional discrepancy is not statistically significant.
Thirdly, women’s reading and writing proficiency was lower than men’s in both our case studies. Still, while one might expect a similar gender gap in both regions, female farmers and labourers were significantly more literate in the Campine area than in the Scheldt Polder.Footnote 33 The literacy rate of thirty-seven per cent among all female Campine unskilled labourers is particularly striking (Table 5). Inequality between social classes and genders was much smaller in the Campine area than in the Polder region. In historiography, the schooling rate among women is often attributed to their relative autonomy. Women who were not forced to live with their in-laws, who could marry later in life, and who were relatively free to inherit and manage their careers and life choices were especially literate. Nevertheless, with regard to marriage and inheritance customs, the Antwerp Campine and the Scheldt Polder region were almost identical.
So, we need to explain three critical findings. How did rural dwellers attain these relatively high levels of education in the eighteenth century? Why was there a regional difference between the Antwerp Campine and Scheldt Polder region? And why would Campine women in particular invest so much in schooling?
An Abundance of Schools
There are broadly two ways to explain the literacy trends observed here. We have to look at the supply and demand sides of education, and in this section we start with the supply side. Some of the lowest literacy levels in premodern Europe have been attributed to a lack of educational opportunities.Footnote 34 Information about rural schools is relatively scarce, however. Good enrolment data are available only from the nineteenth century onwards. Most scholars have therefore focused on urban schools and higher education in the premodern period.Footnote 35
The school system in the Southern Low Countries has often been assessed negatively. Verhoeven, for instance, argued that only upper- and middle-class families would invest in thorough schooling and individual lessons from a schoolmaster. In Antwerp, the large urban masses were supposedly left at the mercy of the poor-quality Sunday schools.Footnote 36
However, both locations in our case studies were well provided with elementary and even secondary schooling during the eighteenth century. While not all rural villages had a school during the seventeenth century, Eddy Put has shown that a vast network of cleijne scholen, or parish schools that taught basic reading, writing, and religious practices, had existed at least since the beginning of the eighteenth century (Figure 2). Unfortunately, Put studied only the Duchy of Brabant, which makes it challenging to provide the same level of detail about schooling in the County of Flanders, to which the Scheldt Polder region belonged. We know for certain that in the eighteenth century, Doel, Kieldrecht, and Verrebroek had a school.Footnote 37 In Verrebroek, the sexton served as the schoolteacher until 1708, after which a formal schoolteacher was appointed by the village authorities.Footnote 38 The Antwerp Campine area, however, stood out. During the eighteenth century, nearly all parishes, even in the small hamlets, had schools, and the demand for schooling was so high that some parish schools were even split into separate girls’ and boys’ schools.
Map of the distribution of schools in the Antwerp Campine area in the eighteenth century.

Figure 2 Long description
The distribution of schools in the Antwerp Campine area during the eighteenth century. It includes symbols for Latin schools, other types of schools and primary schools. Latin schools are marked with a triangle, other types with a yellow circle and primary schools with blue circles of varying sizes. The legend indicates primary school sizes: 0 to 0.9, 0.9 to 2, 2 to 3, 3 to 4, 4 to 5, 5 to 6 and 6 to 7. The research area is highlighted. Locations such as Turnhout, Hoogstraten and Zandhoven are labelled, showing a concentration of schools in these areas. The map provides a visual representation of educational infrastructure in the region during this period.
Given the significant difference in female literacy rates between the two regions, the remarkable rise in the number of girls’ schools in the Antwerp Campine area is worth mentioning. In Dessel, Herenthout, and Mol, private benefactors founded girls’ schools during the eighteenth century, while in other town centres beguinages took in girls for education.Footnote 39 While beguinages and dedicated girls’ schools devoted most of their attention to spinning or lacework, the remarkably high literacy rates in the Campine area may suggest that they also devoted time to reading and writing.
So, primary schooling was abundantly available. Nevertheless, the availability of formal education was not necessarily perfectly correlated with actual school attendance by local boys and girls. The cost of investment could be too high. That said, school fees were actually low enough to be inclusive for a wide range of rural households. The fees ranged from four to fifteen stuivers per quarter. Four or five stuivers was for the most basic reading and spelling skills. The fees became more expensive if someone wanted to develop writing, numeracy, and language skills, such as French or Latin. Given that a skilled craftsman in Antwerp earned 24 stuivers a day, these fees were not high, even for an average rural household.Footnote 40
Why, then, were not all children literate if schools were so abundant and relatively cheap? First of all, most children learned first to spell, then to read, and only much later to write. Since students would have started learning to write only after a couple of years of spelling and reading, poorer households may not have had the opportunity to keep their children in school long enough.Footnote 41 Numeracy was barely taught in rural schools and was most likely acquired on the job or through apprenticeships rather than in school.Footnote 42 Even though in Tongerlo, the school regulations stated that the teacher had to give the basics of arithmetic and the “rule of three”, only those students who paid extra could be schooled in this advanced skill.Footnote 43
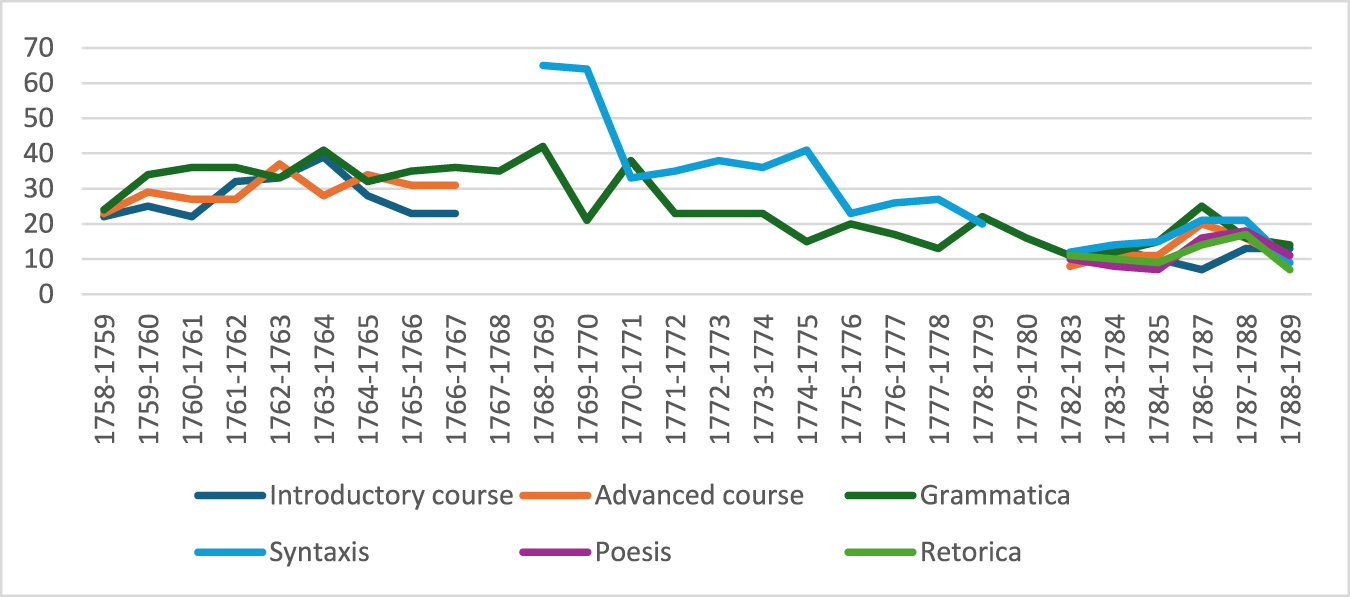
Second, looking at the presence of schools alone is not enough. The Antwerp Campine area was exceptionally well provided with schools. The region had a high density of primary schools, but not necessarily many more than in the Scheldt Polder region. It differed most clearly from other regions in its provision of secondary and advanced schools (Figure 2). But the presence of secondary schooling in a locality or region does not necessarily improve the education of the local community. Thanks to detailed enrolment lists of the Latin school in Geel, we know that between 1758 and 1789 at least 2,049 students attended classes. We lack information about the poesis and rhetoric classes for most years and have gaps in information about other courses. Still, the records provide a good overview of enrolment trends (Figure 3). The students’ backgrounds are particularly interesting, however. Of the 2,049 students, only 280, or 13.7 per cent, had a Campine background.Footnote 44 The rest came from other parts of the Southern Low Countries, and even from abroad. Some headmasters and teachers, including Joannes Albertus Coorens in Geel, attracted students from far and wide.Footnote 45
Enrolment figures for the Latin School in Geel in the second half of the eighteenth century.

Figure 3 Long description
The multi-line graph displays enrolment figures for the Latin School of Geel in the second half of the 18th century. The horizontal axis represents academic years from 1758 to 1789 and the vertical axis shows enrolment numbers ranging from 0 to 70. The graph includes six lines: Introductory course, Advanced course, Grammatica, Syntaxis, Poesis and Retorica. Each line is visually distinguished by different styles. Introductory course: Starts at 22 in 1758 dash 1759, peaks at 35 in 1763 dash 1764 and ends at 10 in 1788 dash 1789. Advanced course: Begins at 23 in 1758 dash 1759, peaks at 35 in 1762 dash 1763 and concludes at 12 in 1788 dash 1789. Grammatica: Starts at 24 in 1758 dash 1759, peaks at 41 in 1768 dash 1769 and ends at 8 in 1788 dash 1789. Syntaxis: Begins at 65 in 1768 dash 1769, peaks at 65 in 1768 dash 1769 and ends at 12 in 1788 dash 1789. Poesis and Retorica: Both start at 10 in 1782 dash 1783 and end at 10 and 12 respectively in 1788 dash 1789. Overall, enrolment fluctuates with notable peaks in the 1760s and a general decline towards the late 1780s. The Syntaxis course shows the highest peak, while Grammatica and Introductory courses have significant enrolment drops over time.
Following the approach of scholars such as Corbellini, Kemps, and Spliet, we want to complement the certificate and schooling data with additional information from probate inventories.Footnote 46 We used probate inventories to track book ownership and the diffusion of scientific equipment and school supplies. These inventories record books, accounts, writing materials, desks, and outstanding school fees. For this article, we studied the probate inventories of the Campine villages of Loenhout, Herenthout, Rijkevorsel, and Brecht, and those of the polder villages of Kallo and Verrebroek. In total, we analysed 297 probate inventories.Footnote 47 Unfortunately, the Scheldt Polder region has left us with fewer series of probate inventories. Kallo and Verrebroek are the only villages in our case study that allowed for a systematic analysis of the material culture. We did track school fees and supplies in a pre-existing dataset of probate inventories for Doel, but unfortunately the datasets are not entirely comparable due to different selection criteria.Footnote 48 While this situation creates an imbalance, Kallo and Verrebroek are representative of the entire Scheldt Polder region and provide us with useful information for the surrounding villages in the Land of Beveren.
The eagerness among Campine inhabitants to send their children to school is immediately reflected in the probate inventories. While none of the Scheldt Polder inventories included any reference to school materials or fees, we find a range of references for the Campine villages. School fees and materials occur regularly, even though many households no longer included school-age children. Eleven probate inventories list outstanding debts to the local schoolmaster. We have already introduced Cornelia Wijns from Rijkevorsel. She was not alone. Four other households from Rijkevorsel, four from Brecht, one from Loenhout and one from Herenthout recorded school fees. We therefore have concrete evidence that villagers were willing to invest in their children’s education.
In addition to fees, we find references to school equipment. Six probate inventories included school boxes (Figure 4). One mentioned a children’s textbook, and three mentioned writing tablets. This is likely to underrepresent the total number of items – for two reasons: first, because the value of these schoolbooks, writing tablets, and boxes must have been low; and second, because of the demographic profile of the people who created probate inventories. Probate inventories in both case studies were drawn up to record movable assets on behalf of minors. Unlike samples from countries with other traditions, our sample is not dominated by elderly people and offers an ideal glimpse into the material culture of younger parents and children. In the premodern period, however, people remained minors until the age of twenty-five, so a significant number would have already left school.
Two wooden school boxes, c.1800.

To sum up, the Antwerp Campine area had a remarkably good elementary education system, especially for girls. Nevertheless, the supply of education was not so skewed as to fully explain the significant difference in literacy between the Scheldt Polder region and the Antwerp Campine area. Yet, in the probate inventories, we find evidence only of Campine schoolchildren going to school, packing their bags, and paying a schoolteacher. The fact that Campine labourers and modest peasants educated their boys and girls cannot be explained simply by the availability of schools. We therefore turn to the demand factors.
Demand for Reading and Writing Skills
The demand for education is important. Erika Kuijpers has already shown clearly that, in early modern cities, an individual’s job profile was a strong causal factor in literacy levels.Footnote 49 Robin Philips, Péter Földvári, and Bas van Leeuwen have shown that in nineteenth-century Belgium and the Netherlands there was a serious decline in education and schooling during the first phase of the Industrial Revolution.Footnote 50 According to them, children preferred to go to work rather than spend time in school. While Henderson has shown that the rise of Sunday schools countered some of these trends in England, it is difficult to identify a clear pattern.Footnote 51 So, the discussion of schooling’s influence remains unresolved. Not only are industrial workers perceived as illiterate; they are also perceived as being unskilled. Proto-industrial families have received the same assessment in both England and the Southern Low Countries. Proto-industry and proletarianization often go hand in hand and lead to higher levels of child labour, thereby reducing both the opportunity for schooling and the incentive to pursue schooling.Footnote 52
So why did a remarkably large share of the Antwerp Campine households want to invest in reading and writing skills? And why did they educate even their daughters? What occupational and socioeconomic background could explain their willingness to educate themselves? In our view, literacy was a transactional skill worth investing in when a farm holding required a wide range of commercial and financial transactions. In the Campine area, even modest peasants and servants knew they would need basic reading, writing, and accounting skills to thrive in expanding commodity and credit markets. Since women undertook a large share of these commercial activities, it paid off to educate them.
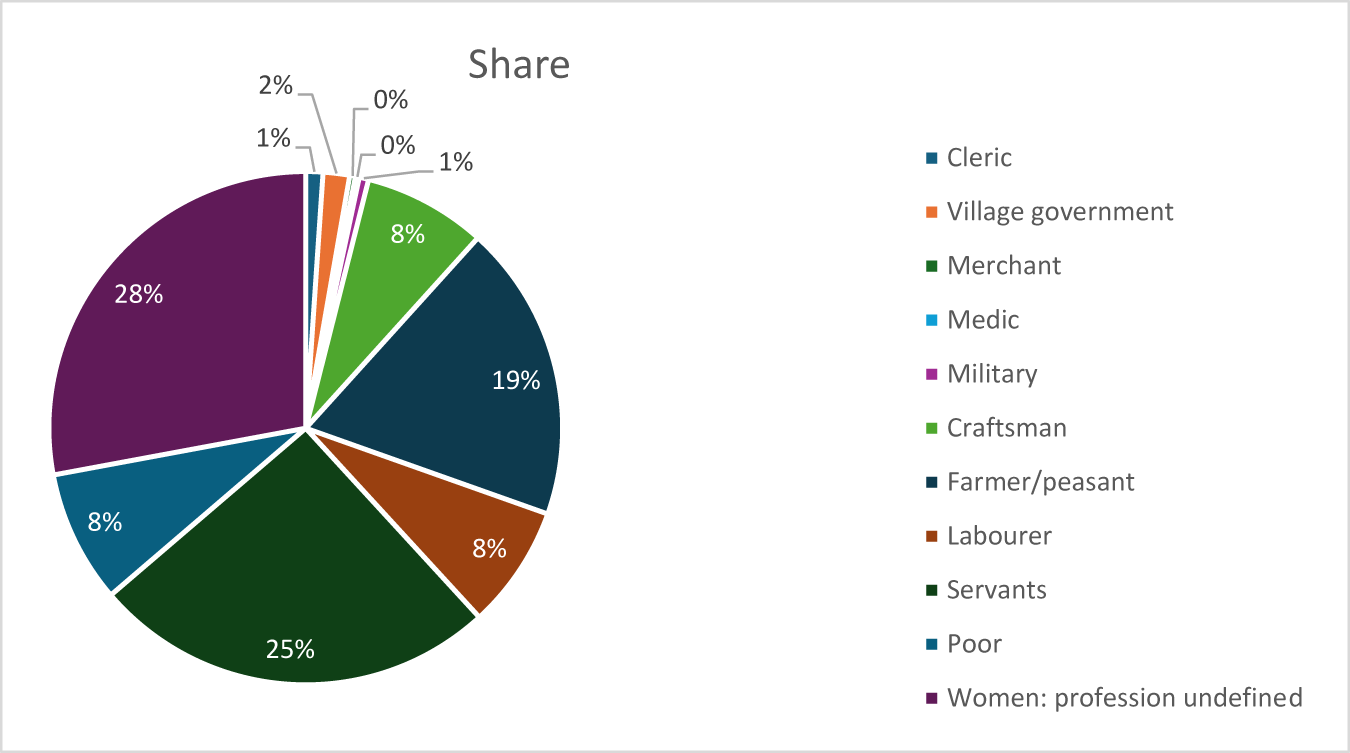
The first reason Antwerp Campine women, especially, needed a basic education was their involvement in a growing, commercial dairy economy. Most households were small, independent economic units with highly diversified and relatively complex activities. The Antwerp Campine area was a region dominated by peasants and rural servants with very few landless labourers (Figure 5). Unfortunately, a large group of women was categorized as having no occupational status. Since dairymaids, spinsters, and female servants were categorized separately and are classified as labourers and servants in this chart, the majority were most likely the wives or widows of farmers and peasants. The servants were mostly young adolescents training to become independent peasants themselves. Only a very small proportion of the villagers was categorized as (agricultural) labourers or poor.
Pie chart of all occupations in Brecht in 1754.

Almost all Campine farms were small and characterized by highly diversified mixed farming. As early as the later Middle Ages and the early modern period, sheep and cattle breeding were common. However, cattle and milch cow numbers increased significantly from the late seventeenth century onwards, indicating a shift towards more commercial activities.Footnote 53 An eighteenth-century traveller in Brabant noted the booming butter production, stating:
Les habitants de ces villages […] ont des troupeaux nombreux de bêtes à laine & beaucoup de bêtes à cornes, qui, leur donnant du lait en abondance, les mettent en état de faire aussi le commerce de beurre; c’est une denrée précieuse dans ce pays-ci: elle est même de première nécessité pour les Brabançons qui mangent tout au beurre.Footnote 54
Our administrative documents suggest that this was no exaggeration. In Brecht, 75.2 per cent of households owned at least one cow, and even in Rijkevorsel, where different cattle counts show diverging estimates, between 60 and 69 per cent of the population had at least one cow (Table 6). Most surprisingly, more than 40 per cent owned more than four cattle units, and we found butter-churning devices in a wide range of households. Each milch cow produced approximately 1,300 litres of milk per year, enough for 43 litres of butter. Given that an average family of four required approximately 21 litres of butter annually, Table 7 shows that the majority of Loenhout households produced more than they needed, making it improbable that these cows were kept solely for subsistence.Footnote 55
Cattle ownership among Antwerp Campine and Polder households according to cattle counts (in %)

Table 6 Long description
Percentages of households are listed by village and year across cattle ownership bands: no cattle, 1 cattle unit, 2 to 3 cattle units, 4 to 5 cattle units, 6 to 8 cattle units, and more than 8 cattle units. Antwerp Campine entries include Rijkevorsel 1755 with only no cattle reported at 31%, Rijkevorsel 1761 with 37.7% no cattle, 4.1% with 1 cattle unit, 16.4% with 2 to 3, 32.3% with 4 to 5, 9.1% with 6 to 8, and 0.5% with more than 8. Rijkevorsel 1765 lists 41.8% no cattle, 5.3% with 1, 7.1% with 2 to 3, 10.0% with 4 to 5, 25.3% with 6 to 8, and 10.6% with more than 8. Brecht 1675 lists 30.0% no cattle, 10.0% with 1, 35.3% with 2 to 3, 17.0% with 4 to 5, 7.3% with 6 to 8, and 0.3% with more than 8; Brecht 1748 lists 24.8% no cattle, 15.2% with 1, 41.3% with 2 to 3, 13.6% with 4 to 5, 5.0% with 6 to 8, and 0.0% with more than 8. Dessel 1755 reports only no cattle at 28.0%. Scheldt Polder entries for 1736 are Kallo with 43.4% no cattle, 13.0% with 1, 26.0% with 2 to 3, 4.4% with 4 to 5, 13.0% with 6 to 8, and 0.0% with more than 8; Melsele with 44.6% no cattle, 20.1% with 1, 20.1% with 2 to 3, 12.9% with 4 to 5, 2.2% with 6 to 8, and 0.0% with more than 8; and Beveren with 65.1% no cattle, 13.9% with 1, 16.3% with 2 to 3, 4.7% with 4 to 5, 0.0% with 6 to 8, and 0.0% with more than 8. Some rows provide only the no cattle percentage, leaving other cattle unit columns blank for those village years.
Sources: SAA, OMA Brecht D 027, nos 2575 and 2602, List of people and cattle tax, 1675 and 1748; SAA, OMA Rijkevorsel D 117, nos 3185 and 3189, List of people and cattle, 1761 and 1765; SAG, OMA Kallo AR79, no. 8, List of people, livestock, alcohol, and salt, 1736. Melsele and Beveren fell within the wider jurisdiction of Kallo. Figures for Rijkevorsel and Dessel in 1755 from Erik Vanhaute, Heiboeren. Bevolking, arbeid en inkomen in de 19de-eeuwse Kempen (Brussels, 1992), p. 211.
Reconstruction of butter production in Loenhout in 1740, based on cattle counts

Table 7 Long description
Litres of butter produced are grouped into ranges, with counts and shares of households shown as number and share in per cent. For 0 litres, 11 households are listed, 10.78 per cent. For 0.1 to 21 litres, 0 households are listed, 0.00 per cent. For more than 21 to 50 litres, 13 households are listed, 12.75 per cent; for more than 50 to 100 litres, 22 households, 21.57 per cent; for more than 100 to 150 litres, 26 households, 25.49 per cent. For more than 150 to 200 litres, 16 households are listed, 15.69 per cent; for more than 200 to 300 litres, 10 households, 9.80 per cent; and for more than 300 litres, 4 households, 3.92 per cent. The total row lists 102 households and 100.00 per cent.
Producing milk, butter, and cheese and selling them on the market required more skill than is often presumed. While nineteenth-century dairy specialists dismissed this as “the art of butter making”, as opposed to scientifically and commercially sound practices, women had been managing dairy production for centuries.Footnote 56 The milk had to be monitored constantly. Dairy producers needed a sound understanding of the impact of temperature and ingredient quantities on the production process. Bas van Bavel and Oscar Gelderblom showed that dairy production required a strong focus on cleanliness and an excellent understanding of the various production stages. Milk had to be stored, transferred, filtered, and churned. Each stage required a different temperature or type of vessel.Footnote 57
In addition, women were responsible for selling their produce. Like the women in Holland, girls and women in the Antwerp Campine sold butter, milk, and zaan (a type of cream) at the local and regional markets. Dairy production was one of the most gendered activities in rural households.Footnote 58 Deborah Valenze convincingly showed that even small-scale producers monitored consumer preferences for butter colour or cheese shape, so they could raise prices.Footnote 59 The flourishing milk and butter trade was therefore carried out by women, and they were the household members who saw their commercial opportunities increase the most.
The second reason, in our view, was women’s involvement in the textile industry. Multiple authors have claimed that proto-industrial activities and the accompanying proletarianization led to deskilling and high illiteracy.Footnote 60 This conclusion appears to be confirmed by evidence from Flanders. Some of the lowest literacy rates were found in East and West Flanders, the core region of proto-industrial textile production (see Table 1). Reinoud Vermoesen studied the textile industry in the Aalst area. In Erembodegem, 66 per cent of probate inventories mentioned at least one spinning wheel in the middle of the eighteenth century. The industrial count of 1738 put the share of spinners in the total female population at 79 per cent. In some other regions, this level reached 90 per cent.Footnote 61
Nevertheless, we identified a different pattern of textile production among Campine rural households. The cattle counts and land registers show that most Campine households were not proletarianized peasants who had lost access to land and worked as a kind of labourer in the putting-out system. Still, we see a steady rise in the number of spinning wheels between the seventeenth and eighteenth centuries. Sixty-nine per cent of late-eighteenth-century Campine households owned at least one spinning wheel (Table 8).Footnote 62 This was a considerable increase from the mid-seventeenth century, when only thirty-one per cent of probate inventories mentioned a spinning wheel. The average number of spinning wheels recorded in the probate inventories shows a similar trend. Multiple households owned more than one spinning wheel, leading to an average of 1.8 by the second half of the eighteenth century. Compared with spinning-wheel ownership in inland Flanders, this is surprisingly high. Even though the Antwerp Campine households were not as proletarianized as their inland Flanders neighbours, they were as active in spinning as households in this textile-production hub. Reels were less prominent, probably due to their low value, but appeared in twenty-eight per cent of Campine households.
Spinning-wheel ownership in Antwerp Campine and Scheldt Polder probate inventories

Table 8 Long description
Probate inventories are grouped by period and area, reporting spinning wheels and reels for the Campine area and the Polder region in the second half 17th century, first half 18th century, and second half 18th century. For spinning wheels, absolute numbers are 26 and 11 in the second half 17th century, 51 and 14 in the first half 18th century, and 42 and 13 in the second half 18th century, for Campine area then Polder region. Spinning wheels percentages are 31 and 52, then 60 and 58, then 69 and 62. Average number of wheels is 1.3 and 1.6, then 1.4 and 1.5, then 1.8 and 2.2. For reels, absolute numbers are 17 and 7, then 29 and 5, then 17 and 3, for Campine area then Polder region. Reels percentages are 20 and 33, then 34 and 21, then 28 and 14.
Source: Database of probate inventories.
While there was a rise in the number of poor, often single spinners in the population censuses of towns such as Turnhout and Herentals, and even in rural villages, who fitted the profile of unskilled labourers working for a piece wage, the probate inventories with spinning wheels show a different demographic group. The inventories with spinning wheels, by contrast, show middle-class families combining farming, cottage industries, and textile production. They engaged in textile production because new commercial opportunities arose in the vicinity, not out of destitution. In and around the Antwerp Campine area, important textile hubs emerged. Turnhout became the most important linen centre in Brabant, and demand for yarn was high. Previous research into the linen, lace, and wool industries in Brabant shows that several entrepreneurs in and around the Antwerp Campine area recognized the region’s untapped labour potential.Footnote 63 Similarly, in Lier, on the southern border of the Campine area, a new company targeting the flannel market was founded in 1757. According to the correspondence between De Heyder & Co. and the finance council, the company required thousands of additional spinners from the Campine area. In their communication, they had already mentioned 240 spinners working for the company in Dessel, Retie, and Arendonk.Footnote 64 The women in our case studies therefore witnessed rising demand for spun yarn in their area. The fact that they had spinning wheels but no looms, and that we see many outstanding debts for buying textiles and clothing, indicates that they most probably spun for the vibrant linen and wool textile industries rather than for subsistence.
Many spinners worked without reading or writing skills. Winding the thread on the reels required complete focus and arithmetic skills, however. Keeping track of the total length of the thread on reels and monitoring their sales to regional companies or middlemen purchasing yarn created pressure for women in the household to maintain some form of accounts. Therefore, we do not believe that proto-industrial activities always led to deskilling and high illiteracy rates.
This brings us to the third and final reason. The women and men in the eighteenth-century Antwerp Campine area managed their households, obtained credit to buy cattle, spun and sold yarn, and produced and sold butter in local markets. Keeping track of all these types of income definitely required numeracy skills, but keeping some kind of accounts or being able to read and sign contracts would have been valuable assets in their professional life.
It has already been shown that the eighteenth century was a period in which administrative and financial documents became increasingly important.Footnote 65 The research by Randolph Head, Eric Ketelaar, and Markus Friedrich demonstrates that archival practices were not exclusive to governments and elites. Instead, ordinary people actively engaged with documents for various purposes, including asserting rights, preserving family histories, and managing daily life.Footnote 66 These authors highlight the growing social awareness of record-keeping, with families and individuals developing their own archival practices that reflect an understanding of the power and significance of documents. This involvement in record-keeping shows that literacy was not only about reading and writing, but also about participating in an economy where written records of debts and transactions had become the norm.
In addition, there was a tradition of women keeping track of their household’s transactions. A good example is Maria van Nesse, an affluent, unmarried woman in Alkmaar. Although she was wealthy and therefore not representative of an average premodern woman, her unique account book illustrates one of the central responsibilities of women: running a household. For wealthy households, this was akin to running a medium-sized company. The women had to supervise and direct the servants, oversee food stocks and prices, monitor food preservation, and follow market prices for all types of goods.Footnote 67 Van Nesse kept track of all these responsibilities in her account book. Even though poor and middle-class women did not have such elaborate estates to run and did not leave beautiful account books, the tasks were similar and may have led to some forms of written household accounts that have not survived.
This is confirmed for our Campine case study. Several households employed servants.Footnote 68 Commodity and land markets relied heavily on credit. Keeping track of outstanding debts was vital for the household budget. In the probate inventories, we see long lists of outstanding consumer credit, credit for investments in cattle, grain, and tools, and financial products such as annuities (renten) and bonds (obligaties). Some were oral agreements, but a large share were registered with the aldermen’s bench and have left paper trails.
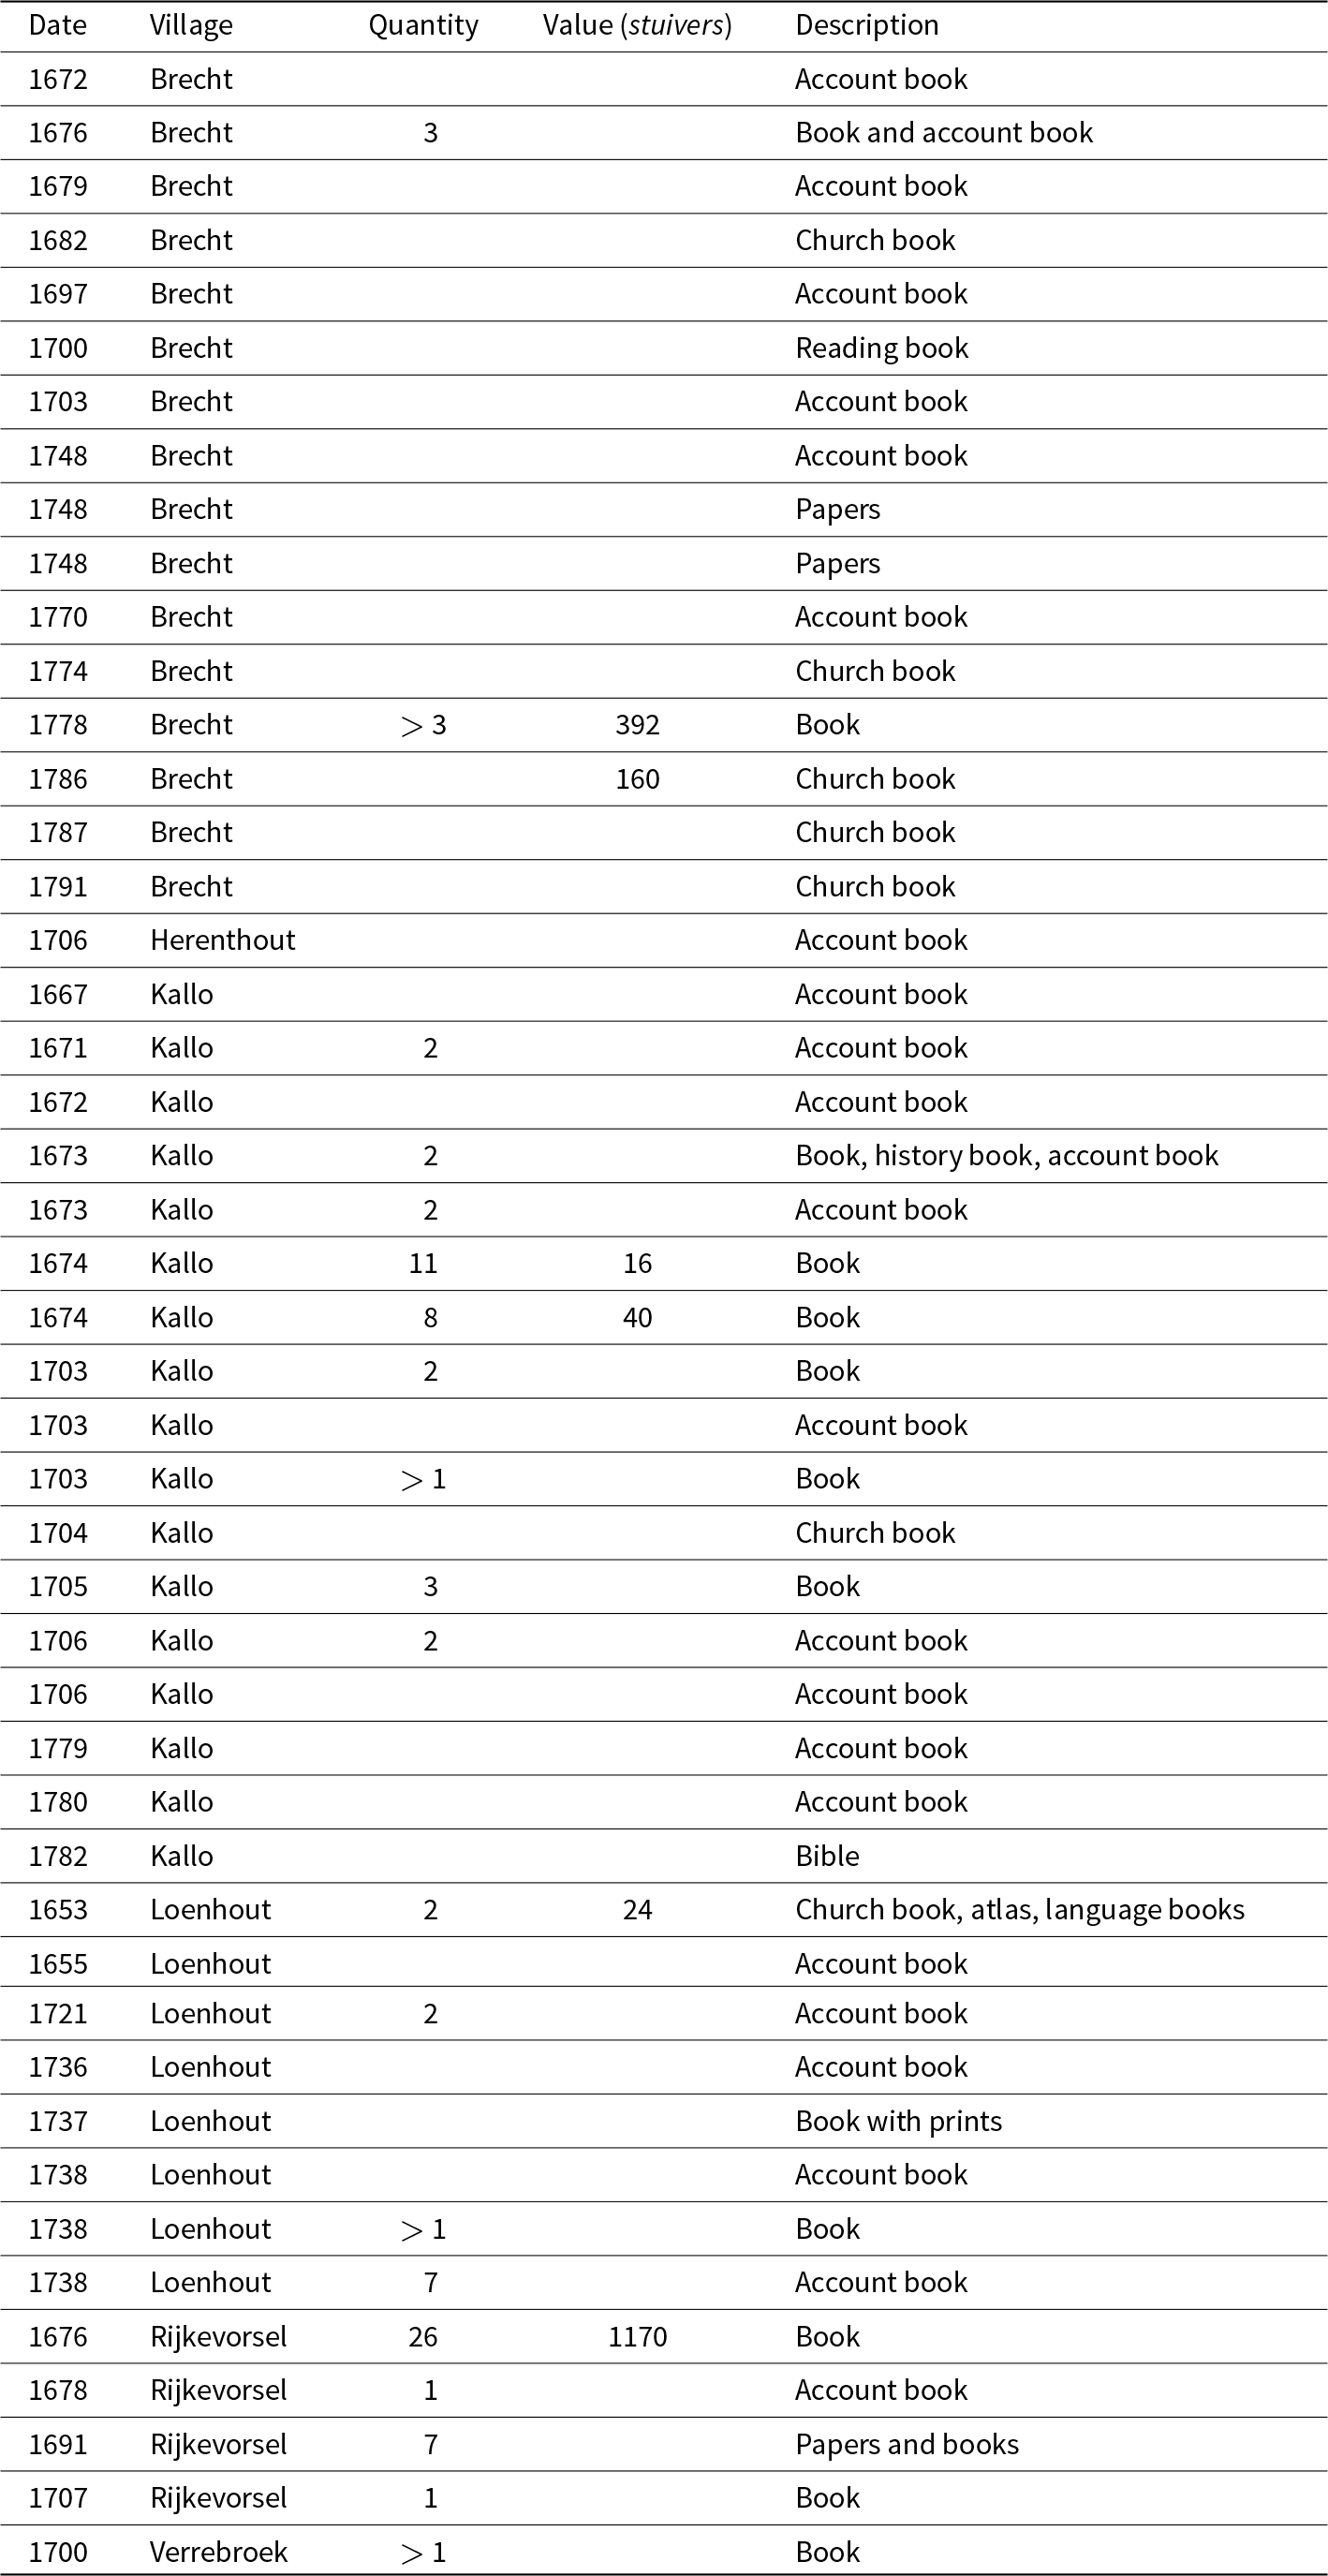
That rural households were learning to read and write for administrative and economic reasons seems confirmed by the possessions listed in the probate inventories. As stated before, female household account books like that of van Nesse could not be found. However, the majority of books mentioned in the probate inventories in the Antwerp Campine area are account books and manuals for tracking debts and financial assets (Table 9). Aldermen and mayors appear regularly in the probate inventories. Books kept by mayors to record village tax receipts are routinely mentioned. For example, Mayor Adriaen van Renth from the village of Rijkevorsel had twenty-six books full of these types of debts and earnings.Footnote 69
Books and other written materials recorded in probate inventories

Table 9 Long description
Entries list dated probate inventory records by village, with columns for Date, Village, Quantity, Value in stuivers, and Description of written material. Brecht records items from 1672 to 1791, mostly account books and church books, plus reading book and papers; values appear for a book in 1778 with quantity noted as greater than 3 and value 392, and a church book in 1786 valued at 160. Herenthout has one entry in 1706 for an account book with no quantity or value. Kallo records items from 1667 to 1782, including account books, books, a church book, and a Bible; quantities include 11 books valued at 16 in 1674 and 8 books valued at 40 in 1674, with several other rows listing quantities such as 2 or 3 without values. Loenhout records items from 1653 to 1738, including account books, a book with prints, and a church book, atlas, and language books; the 1653 entry lists quantity 2 with value 24, and later entries include quantities noted as greater than 1 and 7 with no values. Rijkevorsel records items from 1676 to 1707, including books, an account book, and papers and books; the 1676 entry lists 26 books valued at 1170, and 1691 lists quantity 7 for papers and books with no value. Verrebroek has one entry in 1700 for a book with quantity noted as greater than 1 and no value.
While scholars have pointed out the importance of lay reading and religiosity, the number of religious texts and books is remarkably low. Only eighteen probate inventories mention more than one book. In 1691, Dominicus Blijens of Rijkevorsel had five books; in 1778, Maria Theresia Josepha Gansacker of Brecht owned a collection of books.Footnote 70 Few of these probate inventories specify the nature of the books listed. One probate inventory explicitly described a reading book, another listed an atlas, and yet another mentioned a historien. Neither the Antwerp Campine area nor the Scheldt Polder region, for that matter, was a hub of private libraries and fervent readers. While Corbellini has shown that collective reading and borrowing of books were important, we find no evidence that households provided such reading material for their neighbours.Footnote 71
In the Scheldt Polder region, we see a different picture. This was not a society in which a majority of independent peasants engaged in diverse agricultural, industrial, and commercial activities. We do not have a similar occupational pie chart for this region, but we can deduce the type of households from other sources and secondary literature. Tim Soens and Wout Vande Sompele have shown that the villages in the Land of Beveren were dominated by large, often absentee, landowners, employing many landless labourers, alongside traders, artisans, and craftsmen who benefited from strong commercial connections with Antwerp. Inequality was much higher than in the Campine area, with a small upper stratum of wealthy farmers and a large group of rural labourers, whose numbers swelled in summer due to seasonal migration.Footnote 72 In the Arenberg Polder, for example, there were two landowners for 852 hectares of land. All farmers were leaseholders, and the land was farmed by landless labourers.Footnote 73 The polder economy on the left bank of the Scheldt was highly commercialized and specialized. Most farms were extensive arable holdings that produced barley for the market. Small-scale and mixed farming, with a highly diversified set of rural activities, had disappeared by the sixteenth century in this capitalist society.
This had repercussions, especially for women. There were fewer options to develop independent, diverse, and commercial activities in the Scheldt Polder region. Most women would work on other people’s estates as servants or labourers. In Table 6, we see that between forty-three and sixty-five per cent of the population had no cows. The farms in the Polder region were much more specialized. Milk, butter, and cheese production, especially on a small scale for the local and regional markets, was limited. Dairy products came mainly from the large cattle breeders on the right bank of the river and in the coastal plains.
Textile production, on the other hand, was on the rise. By the eighteenth century, spinning wheels were more common than in earlier periods, though they lagged somewhat behind the Antwerp Campine area (Table 8). Both landless labourers and servants in wealthier households probably took up spinning. It is therefore clear that spinning as an economic activity was not a driving factor in human capital investments. What mattered was how spinning was incorporated into the household’s occupational and social profile. Here, proto-industrial activities were not embedded in the cottage industries of independent peasant households. This type of household did not exist in the Scheldt Polder region. Spinning was not something independent peasants chose to complement their other rural activities. The textile industry resembled the proto-industrial model of inland Flanders. Spinners were either instructed to spin as servants in their employers’ households or forced into spinning within what Erik Thoen called a commercial survival economy.Footnote 74 The labourers probably supplemented their monetary wages by spinning when demand for labour was low.
Large tenant farmers and craftsmen would have benefited from keeping accounts, but the landless labourers, especially women from farming, servant, and labouring households, had fewer reasons to keep their children in school for long. The average rural household in the Scheldt Polder region was less independent and engaged in fewer commercial activities. They produced goods for wealthier tenant farmers, rather than for themselves. As a result, the need for record-keeping was less significant. Although this is difficult to assess, lower demand may also have been accompanied by external disincentives. The labourers may even have been discouraged from educating their children. Clint Bryan turned to Tobias Smollett’s novel Humphry Clinker to unveil eighteenth-century attitudes towards the education of the lower classes in English society.Footnote 75 According to Bryan, large landowners and the nobility opposed educating the masses, especially their servants, because it could lead to revolts and demands for greater rights. Although we cannot prove it, such social or cultural pressure may also have existed in the Southern Low Countries.
Conclusion
This article contributes to long-standing debates on early modern literacy by demonstrating that regional and gendered literacy patterns cannot be understood through macro-level explanations alone. Existing scholarship has emphasized Protestantism, national schooling systems, long-term economic growth, or women’s agency as determinants of literacy. Our findings challenge these frameworks on two fronts. First, they show that similarly Catholic regions under the same legal and institutional regime could nevertheless diverge sharply in literacy – especially female literacy – making institutional or confessional explanations insufficient. Second, they nuance the “girl power” thesis by demonstrating that women’s literacy did not simply follow from marriage patterns or legal autonomy. As far as we can tell, neither marriage patterns, inheritance practices, nor legal restrictions on women’s agency differed significantly between the Antwerp Campine area and the Scheldt Polder region. The main differences were the commercial opportunities, landownership patterns, and the agricultural system, leading to divergent levels of economic usefulness for literacy within specific rural labour markets.
By adopting a meso-level, regionally grounded comparison, this study reveals that literacy in rural societies functioned as a transactional technology: a practical, economically embedded skill rather than an abstract cultural asset. In the Antwerp Campine area, mixed farming, dairy production, spinning, and participation in local credit markets created powerful incentives for women to learn to read and write. In the Scheldt Polder region, dominated by large-scale arable farming, high inequality, and wage-dependent labour, such incentives were largely absent. These results complicate narratives that link proto-industrialization or market integration directly to human capital formation. They also highlight the limits of using book production, national averages, or school presence as proxies for literacy.
More broadly, this article argues for a shift in how rural literacy is conceptualized. Rather than treating literacy as a linear index of modernization, we demonstrate that it was contingent, gendered, and deeply embedded in households’ everyday economic practices. Recognizing literacy as a context-specific economic strategy allows us to reinterpret regional disparities in human capital and to understand why neighbouring rural regions developed along divergent educational and social trajectories.






 Open access

