


1. Introduction
Ice-core studies are one of the most promising methods of reconstructing the past climate and environment (e.g. Reference Shoji, Langway, Oeschger and LangwayShoji and Langway, 1989). In particular, isotope concentrations in polar ice cores have been used as indicators of past temperatures (e.g. Reference RobinRobin, 1983). More recently, studies have been made not only with polar ice cores but also with ice cores from glaciers at low and middle latitudes (Reference Thompson, Wu, Mosley-Thompson and XieThompson and others, 1988; Reference Aizen, Aizen, Melack and MartmaAizen and others, 1996). Reference Krouse, West, Hislop, Brown and SmithKrouse and others (1977), however, reported that isotope profiles were homogenized in wet snowpacks, although there was no significant change over time in snowpacks in the dry-snow zone nor in the superimposed-ice zone. It is therefore necessary to examine the temporal change of the isotope concentration, which could occur during melting or freezing in wet snow layers, for the ice-core analysis obtained from these areas.
Reference Raymond and TusimaRaymond and Tusima (1979) reported that in a wet snowpack at 0˚C relatively small particles shrink by melting and large particles grow by freezing, due to the grain curvature effect, and that these processes take place simultaneously. They also found that the amount of small particles melting is identical to the amount of water freezing to large particles. This amount is henceforth called the ‘exchange mass’. The isotope fractionation during melting can be ignored because the self-diffusion coefficient is very small in ice matrices (e.g. Reference Jouzel and SouchezJouzel and Souchez, 1982; Reference Nakawo, Chiba, Satake and KinouchiNakawo and others, 1993). Thus, the freezing process is considered to be solely responsible for the change in isotope concentration in wet snow.
Within the internal layers of a snowpack under isothermal conditions at 0˚C, the isotope concentration in snow particles depends on the exchange mass that is expressed as a function of snow-particle growth rate and time (Reference Nakawo, Chiba, Satake and KinouchiNakawo and others, 1993). Although the growth rate of snow particles is considered to be a function of the water content
the relation between them has not been clarified. This research investigates the relationship between snow-particle growth rate and water content, based on which temporal isotope change of snow particles is calculated, and compared with the observed result given in Reference HashimotoHashimoto and others (2002) in order to analyze the isotope change processes occurring during the snowmelt season.
2. Observation
Field observations were carried out at Nagaoka facing the Sea of Japan, central Japan, from 1000 h (local time) on 22 February to 1600 h on 23 February 2001. During the observation period, the snow temperature was 0˚C throughout the snowpack. Snow depth at 1000 h was 109 cm on 22 February and 105.5 cm on 23 February. On both days, the water content at four heights in the snow cover, 95, 88, 50 and 10cm above the ground, was measured at intervals of 1–2 hours from 1000 to 1600 h using a Toikka snow fork. Snow liquid-water content was measured about 10 times per day at each of the above-mentioned heights above the soil surface. The measurement accuracy was 0.5%. Snow liquid-water content was assumed to be nearly constant for all layers, because no water channels were observed in the snow cover as suggested by Reference Wakahama, Nakamura and EndoWakahama and others (1968). Snow particles were sampled at the same heights as for water content measurement, and particle sizes were measured by photographing the samples. Photography of snow particles was performed in the field. The photographs were later scanned and computer analyzed to determine the projected area of each particle. The snow particle size was defined as the sphere whose radius is the same as that of a circle whose area had been obtained by computer analysis. The measurement accuracy was 0.02 mm3.
Figure 1 shows the variation of air temperature and precipitation over the course of the observation period. There were no precipitation events during the observation period. The air temperature was about 0°C on the morning of 23 February. Reference Wakahama, Nakamura and EndoWakahama and others (1968) observed that the water content in snow cover was nearly constant except near the snow surface layer even when air temperature fell below the freezing point.
Precipitation and air temperature during the observation period at Nagaoka, 22–23 February.

3. Results
3.1. Diurnal variation of water content
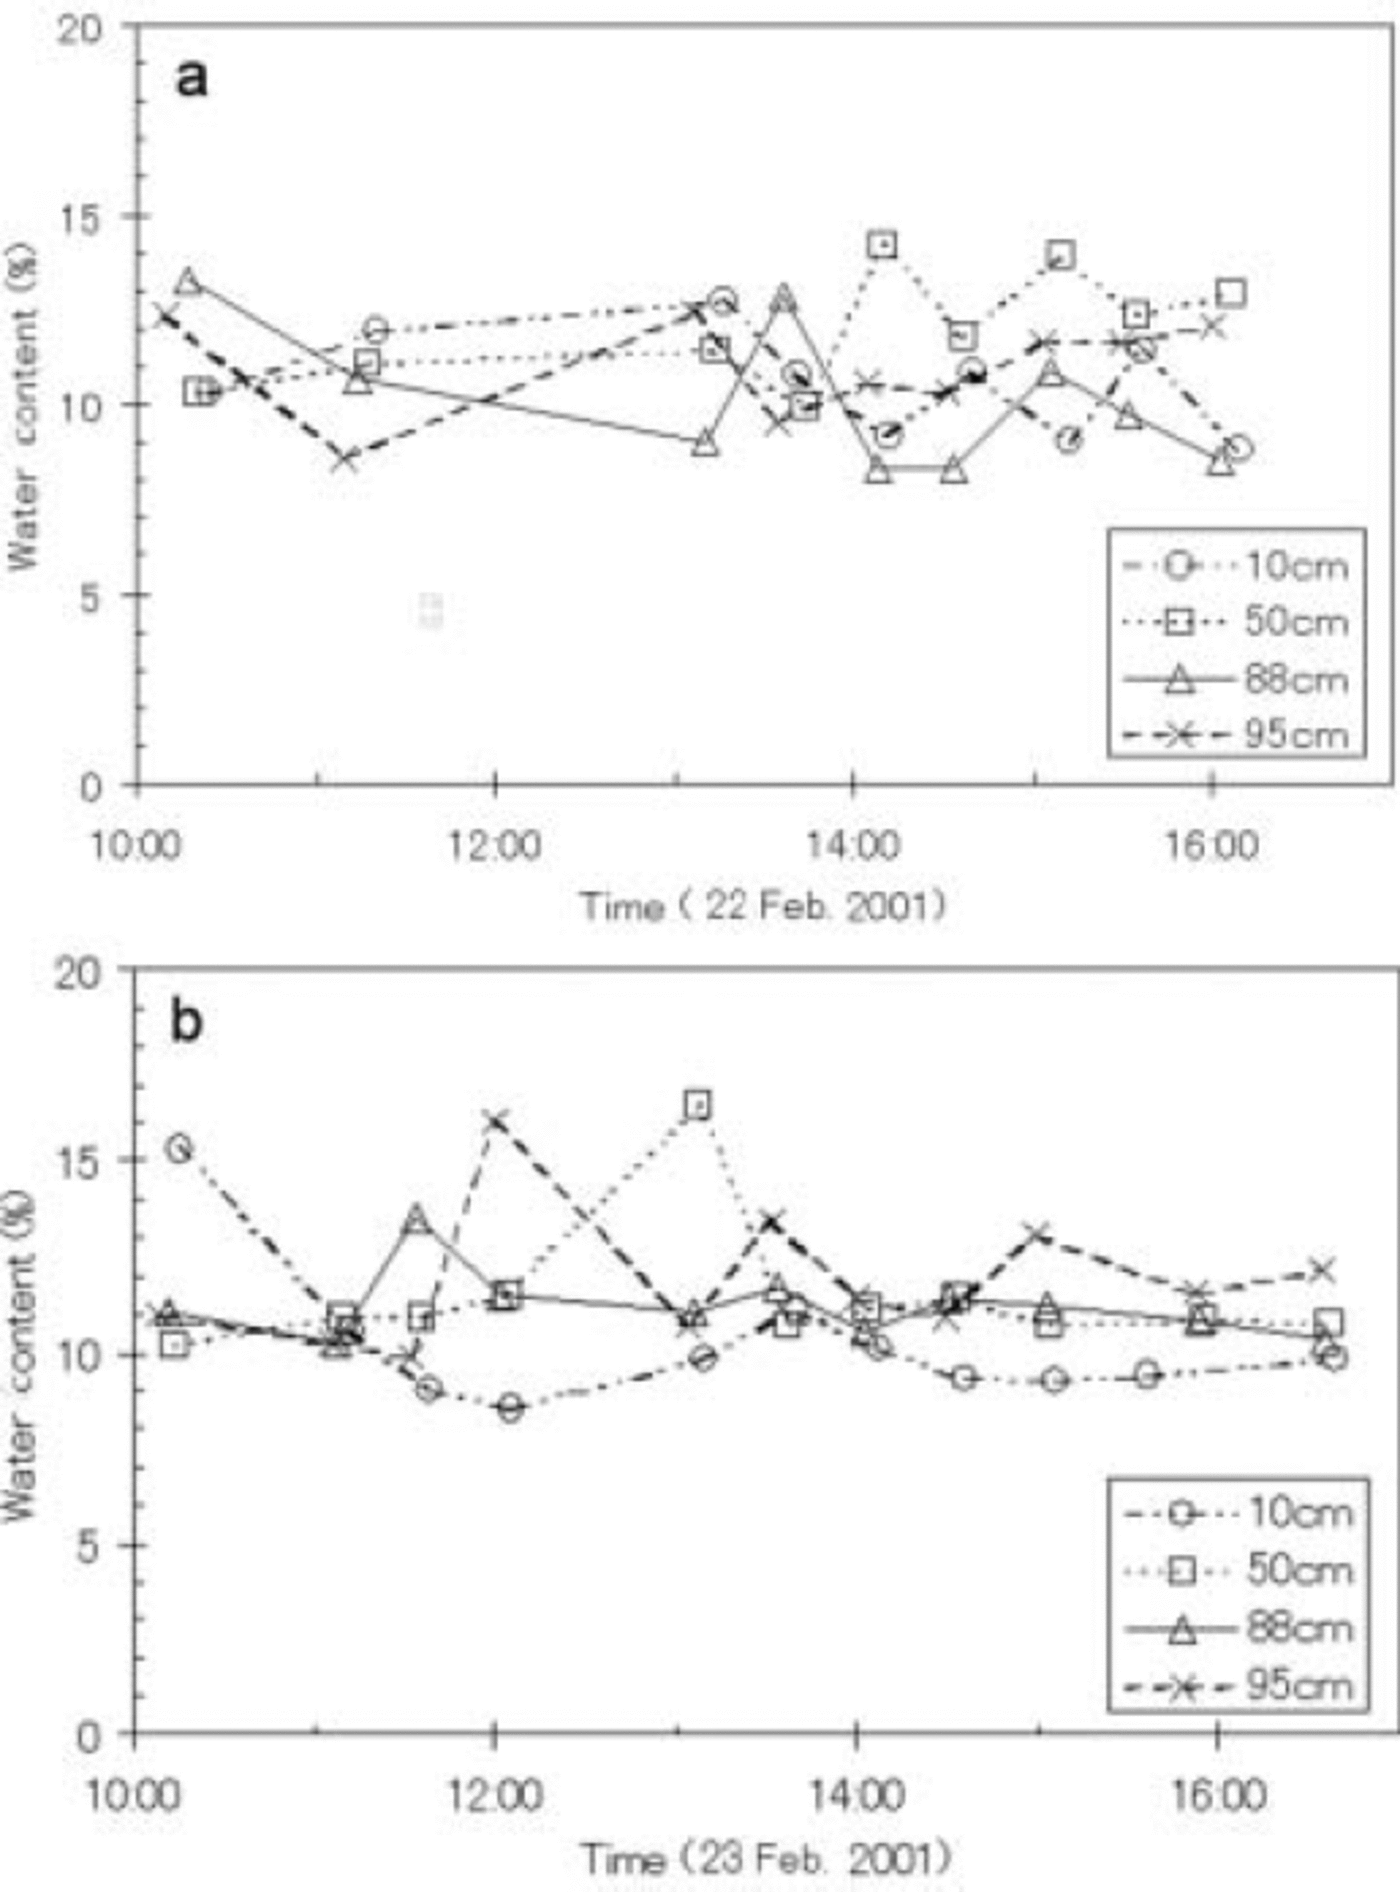
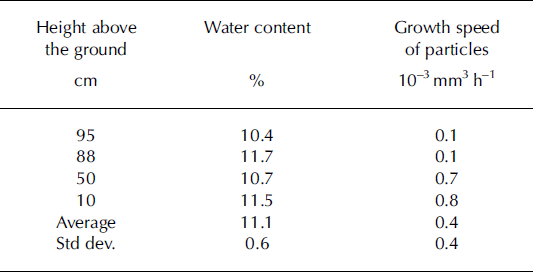
The water content at each observation height is shown in Figure 2 for the 2 days. The water-content peaks were 1300 h at 95 cm, 1330 h at 80 cm, and 1400 h at 50 cm on 22 February, indicating that liquid water formed by melting at the snow surface and then gradually flowed downward. The average water contents at the four observation heights were 10.4% (95 cm), 11.7% (88 cm), 10.7% (50 cm) and 11.5% (10 cm) (Table 1). The standard deviation of each average value was 1.6. The water content can be regarded as remaining constant around the mean value, although it fluctuated between a maximum of 16.4% (at 1300 h on 23 February at 50 cm) and a minimum of 8.3% (at 1400 h on 22 February at 88 cm). As shown in Figure 2a and b, the mean water content in the snow was approximately 10%.
Diurnal variation of water content in snow cover at different heights above the ground: (a) 22 February, (b) 23 February.
3.2. Growth speed of snow particles
According to Reference Raymond and TusimaRaymond and Tusima (1979), the normalized cumulative frequency curve for the volume distribution of snow particles is approximated by
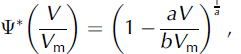
where V is the volume of a particle, V m is a median volume, that is the volume corresponding to the volume where the cumulative frequency curve of the snow particle volume becomes 50%, and a and b are constants. V m is assumed to increase with time for simplicity.

where V 0 is median volume at time zero and δ is the growth speed of particles (Reference Raymond and TusimaRaymond and Tusima, 1979). The median volume V m at each height is shown in Figure 3. It is thought that the difference in initial volume in each layer occurred because the environment during snowfall differed from that after deposition. Figure 3 and Table 1 show the growth rates, γ, of particles measured at each height. The values are in the range 0.1–0.8 (10–3mm3 h–1), similar to the values obtained by Reference HashimotoHashimoto and others (2002).
Variation of the median volume V m of snow particles at each height above the ground. Time 0 = 1000 h local time (UTC + 0900), 22 February.

Results of growth speed of snow particles
3.3. Relation between snow particle growth rate and water content
The relation between the growth speed of snow particles and water content is shown in Figure 4. The growth rates at water contents of 0% and 50% are 0.0040 (10–3mm3 h–1) (Reference Nakamura, Nakawo, Ageta, Goto-Azuma and KamiyamaNakamura and others, 2000) and 5.6 (10–3mm3 h–1) (Reference Raymond and TusimaRaymond and Tusima, 1979), respectively. Nakamura and others’ result was obtained by analyzing 10 years of snow samples collected from Antarctica, and Raymond and Tusima’s result was obtained through an experiment that preserved the bottle containing equivalent water and equivalent ice at 0°C in the laboratory. In the experiment, particle size measurement was performed three times during a period of 200 hours. As can be seen in Figure 4, the relation between the snow-particle growth rate and water content is nonlinear, although no data are available for 20–50% water content. Although the data scattered in a wide range, the growth rate of snow particles for water contents of 10% is about 0.4 (10–3mm3 h–1), which is rather small compared with the value expected for 50% water content. This is in agreement with Reference WakahamaWakahama’s (1964) finding that the growth of snow particles is minimal in low water content.
Relationship between the growth speed of snow particles and water content (dotted line: the straight line that connected growth speed at 0% and at 50%).

3.4. Relationship between the constant a and water content
As mentioned in section 1, relatively small particles shrink by melting and large particles grow by freezing in a wet snowpack at 0°C, due to the particle curvature effect. Under isothermal conditions at 0°C, the amount of melting of relatively small particles is identical with the amount of freezing of water on to large particles. The exchange mass, f, can be calculated by
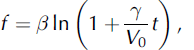
where  as indicated by Raymond and Tusima (1979).
The value obtained for b in Equation (1) was 1.55 for both 0% and 50% water contents (Reference Raymond and TusimaRaymond and Tusima, 1979; Reference Nakamura, Nakawo, Ageta, Goto-Azuma and KamiyamaNakamura and others, 2000). However, the constant a differs as a function of water content: it is 0.14 (Reference Nakamura, Nakawo, Ageta, Goto-Azuma and KamiyamaNakamura and others, 2000) and 0.23 (Reference Raymond and TusimaRaymond and Tusima, 1979) for 0% and 50% water contents, respectively. The average value for a obtained in our observation was 0.15 (std dev.: 0.01) for 11.3% water content. The a value is plotted in Figure 5 for different water contents. It is found that a has a linear relation with water content wg (%), which is expressed by
Relationship between the constant a and water content.


4. Discussion
4.1. Isotope change in snow particles at 0˚C
Model calculation of isotope change was performed by Reference Nakawo, Chiba, Satake and KinouchiNakawo and others (1993) for snow particles with 50% water content. In our observation, however, the water content was about 10% in the snow cover, which is much lower than that used in the calculation by Reference Nakawo, Chiba, Satake and KinouchiNakawo and others (1993). The isotope concentration of the total ice fraction δ iz in wet snow with 100 wt.% water content is given by
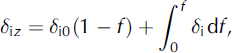
where δ i0 is the initial isotope concentration in snow particles and δ i is the isotope concentration of ice formed by refreezing water. Because of heavy-isotope fractionation during freezing, the isotope concentration of ice formed by refreezing of liquid water with isotope concentration δ w can be calculated by

The isotope fractionation is described in detail by Reference DansgaardDansgaard (1964). The mass-conservation law gives

From Equations (5–7)

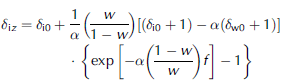
and

where δ w0 is the initial isotope concentration of water, and α the isotope fractionation factor for the ice–water boundary at 0˚C. Using an isotope fractionation factor of 1.00291 for oxygen (Reference Lehmann and SiegenthalerLehmann and Siegenthaler, 1991), we can calculate the isotope content for snow particles and water between the particles by Equations (9) and (10) respectively for a given value of f.
Figure 6 compares the result calculated by Equation (9) with the field observation data given by Reference HashimotoHashimoto and others (2002). Layers III and II in the figure were located completely inside the snowpack during the observation period and were isothermal at 0˚C (Reference HashimotoHashimoto and others, 2002).
4.2. Comparison with observations
Temporal isotope change of snow particles. o: layer II, ▴: layer III. The values represent the difference between isotope concentrations in snow particles and pore water, (δ w0 V δ i0).

In the calculation, a value of 0.15 was used for a (Fig. 5) and 0.4×10⁻³mm3 h–1 for γ, which corresponds to a water content of 10%. The following data were also used for the calculation based on the observation results (Reference HashimotoHashimoto and others, 2002): initial isotope content of ice δ i0 was –13.6% and the initial volume of the particles V 0 was 0.14 mm3 for layer II; δ i0 was –15.3% and V 0 was 0.1 mm3 for layer III; δ w0 was –14.6% for layer II and –16.3% for layer III. Reference HashimotoHashimoto and others (2002) observed that the isotope content of liquid water, δ w0, is smaller than the isotope content of ice by about 1%. A 1% difference between isotope concentrations in snow particles and in pore water was therefore assumed in the calculation.
The results of the calculation are shown with dotted lines in Figure 6. The calculated results predict smaller changes in isotope content, for both layers, than the observations. This may be because the pore water in reality was meltwater generated at the snow surface that had flowed downward, but the calculation neglects the water movement by assuming an isolated system with snow and water.
Figure 7 shows the isotope content profiles for liquid and solid observed by Reference HashimotoHashimoto and others (2002). As mentioned above, isotope content is about 1% larger in water’s solid phase than in its liquid phase, at the same height. The isotope content of water near the surface that would flow downward, however, is much greater than the isotope content in the solid phase in layer III by about 3–4%. On the other hand, the isotope content for the solid phase in layer II is almost equivalent to the content for the liquid phase in the surface layer.
Isotope profiles in the snow cover on 2 April (from Reference HashimotoHashimoto and others, 2002). Solid line: snow particles; dotted line: pore water; dashed line: pore water at surface layer. 4.2. Comparison with observations

The model calculation was therefore made with the condition that isotope content is greater in the liquid phase by 3.5% than in the solid phase for layer III, and that isotope content is the same for the liquid phase and the solid phase for layer II. The results are shown in Figure 6 with solid lines. The recalculation is in good agreement with the observations, indicating that we must take into account the liquid water that flowed downward from the surface.
The model calculation, however, is based on Equation (9), which is applicable only to a closed system. Further modeling work is required that will take into account the water percolation process combined with the isotope fractionation process.
Acknowledgement
We wish to thank the staff of the Nagaoka Institute of Snow and Ice Studies.
Appendix
Substituting Equations (5) and (6) into Equation (7) gives:

Refining this equation gives:

Integrating both sides

So

At initial condition f = 0, the following equation is generated:

This is substituted for Equation (A1):

Equation (A1) substitution of this is carried out:

Rearranging gives:

Substituting Equation (˚) for Equation (5) gives:

Substituting Equation (˚) for Equation (6) gives:



