Introduction
Anxiety disorders are among the most highly prevalent mental disorders in older people (Kessler et al., Reference Kessler, Berglund, Demler, Jin, Merikangas and Walters2005; Bryant et al., Reference Bryant, Jackson and Ames2008; Byers et al., Reference Byers, Yaffe, Covinsky, Friedman and Bruce2010). However, diagnosis and treatment of late-life anxiety – particularly generalized anxiety disorder (GAD) – are challenging due in significant part to an insufficient understanding of age influences on symptom presentation and diagnostic status (Flint, Reference Flint2005; Wetherell et al., Reference Wetherell, Maser and van Balkom2005; Bryant et al., Reference Bryant, Jackson and Ames2008; Wolitzky-Taylor et al., Reference Wolitzky-Taylor, Castriotta, Lenze, Stanley and Craske2010; Lenze and Wetherell, Reference Lenze and Wetherell2011a; Reference Lenze and Wetherell2011b; Mohlman et al., Reference Mohlman2011).
Previous studies have aimed to identify differences in the manifestation of worry symptoms – both quantitative and qualitative – between younger and older adults. These studies have demonstrated that older adults typically endorse numerically fewer worries relative to younger adults, and that the content of their worries is also distinctive (Basevitz et al., Reference Basevitz, Pushkar, Chaikelson, Conway and Dalton2008; Gould and Edelstein, Reference Gould and Edelstein2010; Gonçalves and Byrne, Reference Gonçalves and Byrne2013). For instance, Basevitz et al. (Reference Basevitz, Pushkar, Chaikelson, Conway and Dalton2008) found that older adults reported less intolerance of uncertainty and less belief in the functional value of worrying than younger adults; Gonçalves and Byrne (Reference Gonçalves and Byrne2013) found that older adults tend to worry more about the health and welfare of loved ones, whereas younger adults tend to worry more about work and interpersonal relations; and Gould and Edelstein (Reference Gould and Edelstein2010) found that younger adults report having less control over their anxiety. These findings suggest that anxiety symptoms in general, and worry in particular, can manifest differently as a function of age. However, such findings are not particularly informative about the impact of age differences on diagnostic status.
An alternative approach has been to identify differences in symptom presentation between individuals with and without current GAD diagnoses. Older adults with GAD can be differentiated from asymptomatic older adults and older adults with sub-threshold anxiety by higher frequency of worry, uncontrollability of worry, higher levels of distress and impairment, muscle tension, and sleep disturbance (Diefenbach et al., Reference Diefenbach2003; Wetherell et al., Reference Wetherell, Le Roux and Gatz2003). The observation that muscle tension and sleep disturbance differentiate between older adults with and without GAD is perhaps the most clinically informative data, given that the other anxiety symptoms (i.e. excessive and uncontrollable worry, distress and impairment) are integral to a GAD diagnosis. However, it is important to note that muscle tension and sleep disturbance can arise from a variety of causes, including medication use, as well as being part of the physical changes associated with normal aging (Wetherell et al., Reference Wetherell, Le Roux and Gatz2003). Moreover, given the relatively small sample sizes in these studies, it is unclear whether these findings generalize to the population at large. Finally, lack of young adult comparison groups makes it difficult to draw conclusions about age effects. Thus, a better understanding of how age influences symptom presentation and diagnostic status in anxiety is still needed, particularly in terms of differentiating between self-reported worriers with and without GAD across the lifespan.
The purpose of this study was to determine the type and number of symptoms that best predict GAD across the lifespan using a nationally representative dataset. We hypothesized that a distinct set of symptoms would characterize GAD in older adults, and that overall fewer symptoms would characterize GAD in older adults.
Method
Sample
The National Epidemiological Survey of Alcohol and Related Conditions (NESARC) was conducted in 2001–2002 by the U.S. Bureau of the Census and sponsored by the National Institute of Alcohol Abuse and Alcoholism (NIAAA). The NESARC consists of a nationally representative sample of civilian, non-institutionalized adults (age range 18–98 years; N = 43,093) sampled from all 50 US states and the District of Columbia. The overall response rate was 81%. Face-to-face interviews were conducted by trained lay interviewers using the Alcohol Use Disorder and Associated Disabilities Interview Schedule – DSM-IV version (AUDADIS-IV). African-Americans, Hispanics, and young adults were purposively oversampled, and data were adjusted for oversampling and non-response. Sampling weights were based on census data.
Participants who responded affirmatively to one of two screening questions (“Ever had a 6+ month period during which you felt: (a) tense/nervous/worried most of the time; or (b) very tense/nervous/worried most of the time about everyday problems”) were included in this study, because they were further assessed for overall GAD symptoms.
Measures
Twelve-month non-hierarchical GAD diagnoses were obtained with the AUDADIS-IV, based on DSM-IV criteria. Socio-demographic characteristics, including gender, education (some college or higher, completed high school, less than high school), personal income (0–9,999, 10,000–34,999, 35,000+ USD), marital status (married/cohabiting, widowed/divorced/separated, never married), urbanicity (urban, rural), geographic region (Northeast, Midwest, South, West), and self-perceived health (excellent, very good, good, fair, poor) were accounted for in all analyses.
Procedure
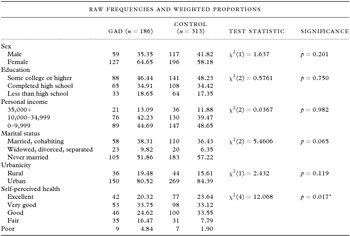
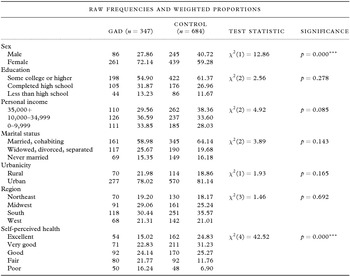
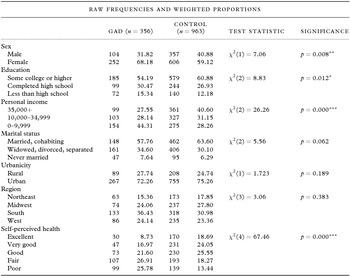
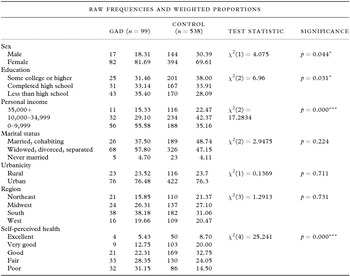
Participants were classified into one of the four age groups (18–29; 30–44; 45–64; 65–98 years), and one of the two diagnostic groups (12-month GAD; or No Current GAD diagnosis). Tables 1–4 indicate the distribution of participants across age and diagnostic groups. Self-reported symptoms were compared between diagnostic classes within each age group to assess the features that best differentiate between those with GAD and their age-matched counterparts, which resulted in four sets of binary logistic regression analyses, corresponding to one per age group.
Socio-demographic characteristics of 18–29-year-olds, by current GAD diagnosis

*p < 0.05; Pearson's χ2-test conducted for all comparisons.
Socio-demographic characteristics of 30–44-year-olds, by current GAD diagnosis

***p < 0.0001; Pearson's χ2-test conducted for all comparisons.
Socio-demographic characteristics of 45–64-year-olds, by current GAD diagnosis

*p < 0.05; **p < 0.01; ***p < 0.0001; Pearson's χ2-test conducted for all comparisons.
Socio-demographic characteristics of 65–98-year-olds, by current GAD diagnosis

*p < 0.05; ***p < 0.0001; Pearson's χ2-test conducted for all comparisons, unless n ≤ 5 for a given cell (Fisher's exact).
Statistical analyses
All statistical analyses were conducted using Stata 12.0 (Statacorp, 2011). Appropriate survey commands were used to account for the complex survey design of the NESARC. Raw frequencies, weighted proportions, and chi-square tests were calculated within age groups and between diagnostic groups. A series of chi-square tests, comparing the proportion of each symptom between individuals with GAD and non-GAD worriers in each age group only warranted the exclusion of one variable from further analyses: “in worst period, ever found it difficult to stop being tense, nervous, or worried,” which perfectly discriminated between diagnostic groups due to this symptom being an integral part of a GAD diagnosis (for proportions of responses to each symptom, see Supplementary Tables S1–S4 available as supplementary material attached to the electronic version of this paper at www.journals.cambridge.org/jid_IPG). Odds ratios (ORs) derived from weighted logistic regression analyses were used to indicate the utility of specific symptoms for predicting GAD group membership within each age group, after controlling for sociodemographic and health variables.
Results
Socio-demographic characteristics of the sample
The total sample of self-reported worriers consisted of 3,486 participants. The 18–29-year-old subgroup consisted of 499 participants (M age = 24; 61% female), the 30–44-year-old subgroup consisted of 1,031 participants (M age = 38; 64% female), the 45–64-year-old subgroup consisted of 1,319 participants (M age = 53; 61% female), and the 65–98 subgroup consisted of 637 participants (M age = 75; 71% female). Eighty-four percent of the total sample had completed a high school education, with 54% having completed at least some college. Seventy percent reported having a personal annual income of less than $35,000, and 78% of participants lived in an urban region. The overall marriage distribution was as follows: 56% married or cohabiting; 27% widowed, divorced or separated; and 16% never married. Sixty-nine percent of the sample reported that their health was good, very good, or excellent. A total of 988 participants, representing slightly more than one quarter of this screen positive sample, had a 12-month GAD diagnosis. See Tables 1–4 for participants’ sociodemographic characteristics stratified by age and diagnostic groups.
Number of symptoms
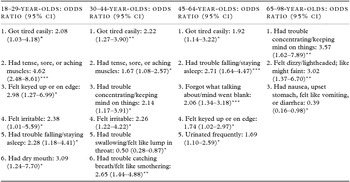
A set of binary logistic regression analyses was conducted within each age group, with GAD group membership (coded GAD, 1, no GAD, 0) as the outcome variable and GAD symptoms as the predictor variables (See Table 5 for summary of analyses and Supplementary Table S5 (available online) for full analyses). These revealed that fewer symptoms differentiated between individuals with and without GAD in each successively older age group. In the 18–29-year-old group seven symptoms distinguished between diagnostic groups, in the 30–44-year-old group six symptoms distinguished between diagnostic groups, in the 45–64-year-old group five symptoms and one sociodemographic variable distinguished between diagnostic groups, whereas in the older adult (65–98-year-old) group only three symptoms and one sociodemographic variable differentiated between those with and without GAD.
Summary of binary logistic regression analyses showing symptoms that significantly distinguished between self-reported worriers with and without GAD in each age group

*p = 0.05; **p = 0.01; ***p = 0.001.
Note: Results of full binary logistic regression analyses can be found in Supplementary Table S5 (available online).
Types of symptoms
Inspection of the binary logistic regression findings further revealed that a qualitatively different set of symptoms predicted GAD group membership in each age group. In the 18–29-year age group, “got tired easily” (OR = 2.08; 95% CI: 1.03 – 4.18), “had tense, sore, or aching muscles” (OR = 4.62; 95% CI: 2.48 – 8.61), “became so restless you fidgeted, paced, could not sit still” (OR = 0.33; 95% CI: 0.14 – 0.77), “felt keyed up or on edge” (OR = 2.98; 95% CI: 1.27 – 6.99), “felt irritable” (OR = 2.38; 95% CI: 1.01 – 5.59), “had trouble falling/staying asleep” (OR = 2.28; 95% CI = 1.18 – 4.41), and “had dry mouth” (OR = 3.09; 95% CI = 1.24 – 7.70) best distinguished between self-reported worriers with and without GAD.
In the 30–44-year age group, “got tired easily” (OR = 2.22; 95% CI: 1.27 – 3.90), “had tense, sore, or aching muscles” (OR = 1.67; 95% CI: 1.08 – 2.57), “had trouble concentrating/keeping mind on things” (OR = 2.14; 95% CI: 1.17 – 3.91), “felt irritable” (OR = 2.26; 95% CI: 1.22 – 4.22); “had difficulty swallowing/felt like lump in throat” (OR = 0.50; 95% CI: 0.28 – 0.87), and “had trouble catching breath, felt like smothering” (OR = 2.65; 95% CI: 1.44 – 4.88) best distinguished between self-reported worriers with and without GAD.
In the 45–64-year age group, “got tired easily” (OR = 1.92; 95% CI: 1.14–3.22), “often felt keyed up or on edge” (OR = 1.74; 95% CI: 1.02 – 2.97), “had trouble falling/staying asleep” (OR = 2.71; 95% CI: 1.64 – 4.47), “forgot what talking about/mind went blank” (OR = 2.06; 95% CI: 1.34 – 3.18) and “urinated frequently” (OR = 1.69; 95% CI: 1.10 – 2.59) best distinguished between self-reported worriers with and without GAD.
In the 65–98-year age group, low personal income (OR = 3.51; 95% CI = 1.07 – 11.43), “had trouble concentrating/keeping mind on things” (OR = 3.57; 95% CI = 1.62 – 7.89), “felt dizzy/lightheaded/like might faint” (OR = 3.02; 95% CI = 1.37 – 6.70), and “often had nausea, upset stomach, felt like vomiting or diarrhea” (OR = 0.39; 95% CI = 0.16 – 0.98) best distinguished between self-reported worriers with and without GAD.
Discussion
The most salient findings of this study are as follows. First, among screen positive worriers a distinct set of symptoms predicted GAD in each age group. Second, numerically fewer symptoms predicted GAD in older adults compared to all other age groups. Third, changes in the type and number of symptoms that predicted GAD occurred gradually across the lifespan. The results underscore important age differences in GAD symptom presentation, and further suggest that such differences in the degree and kind of symptoms that distinguish between self-reported worriers with and without GAD can be invoked to explain some of the challenges surrounding the detection of late-life GAD.
In the 65-year and older age group, (i) difficulty concentrating and keeping mind on things, and (ii) feeling dizzy, lightheaded, or like fainting were positive predictors of GAD, and (iii) had nausea, upset stomach, felt like vomiting or diarrhea was a negative predictor of GAD. Moreover, a sociodemographic variable, low personal income was a positive predictor of GAD in older adults. At first glance, these findings are apparently at odds with a previous study by Wetherell et al. (Reference Wetherell, Le Roux and Gatz2003), which suggested that sleep disturbance and fatigue are useful for distinguishing between older adults with and without GAD. The results of the present study demonstrate that these symptoms have utility for distinguishing between individuals with and without GAD in the other age groups, but not in the older adult group. Upon closer examination of the Wetherell et al. study, however, we conclude that both sets of findings are compatible. Wetherell and colleagues found that sleep disturbance and fatigue distinguished between the sub-syndromal and asymptomatic groups, but did not distinguish between GAD and sub-syndromal groups. In the present study, the control group is more akin to the sub-syndromal group in the Wetherell et al. study than to the asymptomatic group. In our study, only participants who answered affirmatively to one of the screening questions (indicating that they worried frequently in the past six months) were included in the final sample, and all participants who did not subsequently receive a GAD diagnosis were included as controls. Participants who did not endorse one of the screening questions (i.e. asymptomatic participants) were not assessed on the anxiety portion of the diagnostic interview, and therefore could not be included in our study.
Although we acknowledge that inclusion of an asymptomatic control group could have provided for more thorough comparisons, we do not believe that the absence of an asymptomatic group is a major limitation of this study. Clinical decisions involving asymptomatic adults are typically straightforward. Difficult GAD diagnoses most often rely on the clinician's ability to distinguish between individuals with pathological and non-pathological anxiety, rather than between individuals with pathological anxiety and those with a relative absence of anxiety symptoms. For this reason, we believe that these findings are of particular clinical significance. A second issue concerns the fact that we did not control for co-morbid psychiatric conditions. We believe that future studies, designed specifically to address issues related to co-morbidity, would be better suited to account for such variables.
The present results demonstrate two novel ways in which age impacts the presentation of GAD symptoms and diagnostic outcomes. We believe that these results are particularly interesting in light of a heretofore unresolved question regarding late-life anxiety. It has been widely observed that prevalence estimates of anxiety disorders and the frequency of anxiety symptoms decrease into older adulthood (e.g. Kessler et al., Reference Kessler, Berglund, Demler, Jin, Merikangas and Walters2005; Gonçalves and Byrne, Reference Gonçalves and Byrne2013). However, sub-threshold anxiety symptoms (in the absence of a disorder) are highly prevalent, and individuals with sub-threshold anxiety symptoms are similar to threshold symptom groups in terms of shared health characteristics (Bryant et al., Reference Bryant, Jackson and Ames2008; Grenier et al., Reference Grenier2011). It remains unclear whether decreases in the prevalence of disorders and the frequency of symptoms reflect age-related reductions in pathological anxiety, or whether these trends reflect the absence of age-appropriate criteria for older adults. We endorse the latter view, and believe that under-diagnosis of GAD in older adults could be partly attributed to the observations that older adults tend to endorse fewer symptoms compared to younger adults, that fewer symptoms are associated with GAD in older adults, and that these symptoms are qualitatively different to those observed in younger adults.
We will pursue these findings by investigating whether older adulthood is also associated with a lower threshold of symptoms required to meet the disability/distress criterion. If a lower magnitude of symptoms accounts for clinically significant disability and/or distress in older adults, it would suggest that late-life anxiety disorders are more highly prevalent than previous estimates suggest. Further, it would stress the need to develop age-appropriate criteria for older adults.
Conflict of interest
None.
Description of authors’ roles
B.M. performed statistical analyses. All authors were involved in the conception and planning of the study, and contributed to writing and editing the paper.