Acquiring a language is a complex process that requires a combination of the learner’s linguistic, cognitive, and social abilities, together with exposure to quantitatively and qualitatively sufficient input. The present study investigates which qualitative features of the visual input contribute the most to young children’s learning of nonnative phonological categories. Research on the development of nonnative phonological categories in young children is still scarce (see discussions in Erdener & Burnham, Reference Erdener and Burnham2018; Walley, Reference Walley, Pisoni and Remez2008). Most evidence comes from infant studies and shows that functionally relevant phonological cues enhance learning. Young infants acquire novel phonological categories easier if they can consistently associate the acoustic distributional properties of the input to distinctive referential categories (e.g., Best, Reference Best, De Boysson-Bardies, de Schonen, Jusczyk, MacNeilage and Morton1993; Fennell & Waxman, Reference Fennell and Waxman2010; Thiessen, Reference Thiessen2011; Yeung & Nazzi, Reference Yeung and Nazzi2014; Yeung & Werker, Reference Yeung and Werker2009). The visual context accompanying a learning situation provides such associations, as infants acquire nonnative phonemes when these are paired unambiguously with a visually presented object of reference, compared to when no object of reference is present or when the pairing is inconsistent (Fennell & Waxman, Reference Fennell and Waxman2010; Yeung & Werker, Reference Yeung and Werker2009). The functional dimension of phonological acquisition seems to continue in early childhood (Metsala & Walley, Reference Metsala, Walley, Metsala and Ehri1998) and adults (Feldman, Myers, White, Griffiths, & Morgan, Reference Feldman, Myers, White, Griffith and Morgan2013). It is possibly grounded on the more general mechanism of acquired distinctiveness, which predicts that two phonetic stimuli are more easily distinguishable when they are consistently presented in distinctive contexts (Hall, Reference Hall1991).
In natural conversations learners are exposed to additional visual cues that complement the statistical and functional dimension of the phonological acquisition process. Thus, the presence of a social partner that creates socially engaging interactive situations (Bannard & Tomasello, Reference Bannard and Tomasello2012; Hakuno, Omori, Yamamoto, & Minagawa, Reference Hakuno, Omori, Yamamoto and Minagawa2017; Kuhl, Reference Kuhl2007; Kuhl, Tsao, & Liu, Reference Kuhl, Tsao and Liu2003; Linebarger & Vaala, Reference Linebarger and Vaala2010; Nussenbaum & Amso, Reference Nussenbaum and Amso2015; Roseberry, Hirsh-Pasek, & Golinkoff, Reference Roseberry, Hirsh-Pasek and Golinkoff2014), the exposure to ostensive signs of the object–label mapping (Csibra & Gergely, Reference Csibra and Gergely2009; Hanna & Brennan, Reference Hanna and Brennan2007; Moore, Angelopoulos, & Bennett, Reference Moore, Angelopoulos and Bennett1999; Triesch, Teuscher, Deák, & Carlson, Reference Triesch, Teuscher, Deak and Carlson2006; Wu & Gros-Louis, Reference Wu and Gros-Louis2014), and the learner’s sensitivity to visual speech information (Birulés, Bosch, Brieke, Pons, & Lewkowicz, Reference Birulés, Bosch, Brieke, Pons and Lewkowicz2019; Erdener, Reference Erdener2007; Erdener & Burnham, Reference Erdener and Burnham2013, Reference Erdener and Burnham2018; Lalonde & Holt, Reference Lalonde and Holt2015; Ter Schure, Junge, & Boersma, Reference Ter Schure, Junge and Boersma2016; Weikum et al., Reference Weikum, Vouloumanos, Navarra, Soto-Faraco, Sebastián-Gallés and Werker2007), are all factors that positively impact the language acquisition process.
Of interest here, speakers might not be able to spontaneously and simultaneously provide all these additional visual cues in the learning situation. For instance, an adult might create a socially engaging situation in which a joint attentional frame is created (i.e., the adult uses eye contact or body movements to alternate his/her focus of interest between the child and the object of interest; Tomasello, Reference Tomasello and Dunham1995). However, because of the alternation of the focus of interest, the adult might spend less time facing directly the child and therefore the child’s exposure to visual speech input will be reduced. It is thus important to investigate the relative importance of the additional visual cues of a learning situation, to see if any of these may particularly boost the nonnative phonological acquisition process.
We know that being part of socially engaging interactive situations helps young learners to acquire nonnative phonemes and novel lexical items (Bannard & Tomasello, Reference Bannard and Tomasello2012; Hakuno et al., Reference Hakuno, Omori, Yamamoto and Minagawa2017; Kuhl, Reference Kuhl2007; Kuhl et al., Reference Kuhl, Tsao and Liu2003; Linebarger & Vaala, Reference Linebarger and Vaala2010; Nussenbaum & Amso, Reference Nussenbaum and Amso2015; Roseberry et al., Reference Roseberry, Hirsh-Pasek and Golinkoff2014). In general, 9-month-old infants acquire novel (nonnative) phonological contrasts when trained in live exposure situations (Kuhl, Reference Kuhl2007), or when exposed to (media or real life) learning situations that are socially interactive, resembling real-life experiences (Linebarger & Vaala, Reference Linebarger and Vaala2010). Bannard and Tomasello (Reference Bannard and Tomasello2012) trained 2-year-old toddlers in two situations: one in which the interlocutor named the referent while alternating the gaze between the child and the object, and one in which the referent was available in the visual display, but the interlocutor did not look at it while naming it. While children showed implicit knowledge of the word–referent mapping in the two situations equally (by looking at the right referent in both situations), only if trained in the socially engaging condition had children overly pointed at the right referent when asked to do so.
The exposure to ostensive signals that reinforce the object–label mapping also impacts the early acquisition of nonnative phonemes. In first language acquisition, for instance, caregivers naturally speak to their infants using more verbal redundancy and with exaggerated prosody (e.g., Fernald, Reference Fernald1993; Fernald & Mazzie, Reference Fernald and Mazzie1991; Saint-Georges et al., Reference Saint-Georges, Chetouani, Cassel, Apicella, Mahdhaoui, Muratori and Cohen2013; Soderstrom, Reference Soderstrom2007). These social interactive features help infants’ acquisition of phonological, syntactic, and lexical categories because they highlight these units in speech, boost the label–referent association, and promote infants’ engagement in the communicative interaction (Golinkoff, Can, Soderstrom, & Hirsh-Pasek, Reference Golinkoff, Can, Soderstrom and Hirsh-Pasek2015; Spinelli, Fasolo, & Mesman, Reference Spinelli, Fasolo and Mesman2017). At a visual level, adults naturally provide ostensive cues like eye gaze to indicate the relevant focus of attention, to disambiguate and reinforce the object–label associations, and to help young learners comprehend the meaning of what is being said (Hanna & Brennan, Reference Hanna and Brennan2007; Wu, Tummeltshammer, Gliga, & Kirkham, Reference Wu, Tummeltshammer, Gliga and Kirkham2014). Infants can follow their interlocutor’s gaze very early in development (Brooks & Meltzoff, Reference Brooks and Meltzoff2005), and eye-tracking results have shown that infants use this ability to attend to the relevant object of reference (Senju & Csibra, Reference Senju and Csibra2008). Other eye-tracking studies have also shown that infants learn new words better when speech input is accompanied by ostensive signs indicating its functional value (Wu, Gopnik, Richardson, & Kirkham, Reference Wu, Gopnik, Richardson and Kirkham2011; Wu & Kirkham, Reference Wu and Kirkham2010; Yoon, Johnson, & Csibra, Reference Yoon, Johnson and Csibra2008), and the timing in which the adult establishes the object–label association is highly relevant. Previous studies in vocabulary learning find consistent evidence that in the ideal learning situation the adult provides the new linguistic input while the infant is already attending to the relevant referent, as opposed to trying to redirect the infant’s focus of interest by providing a new linguistic input. This phenomenon has been called “social contingency” or “parental responsiveness” (e.g., Bannard & Tomasello, Reference Bannard and Tomasello2012; Hakuno et al., Reference Hakuno, Omori, Yamamoto and Minagawa2017; McGillion et al., Reference McGillion, Herbert, Pine, Vihman, Keren-Portnoy and Matthews2017; Nussenbaum & Amso, Reference Nussenbaum and Amso2015; Roseberry et al., Reference Roseberry, Hirsh-Pasek and Golinkoff2014, see Mermelshtine, Reference Mermelshtine2017, for a review).
Phonetic information is not only perceived through the auditory modality. Listeners perceive speech sounds also through the visual channel, as the inspection of mouth movements while speaking provides redundant information to the acoustic signal (Gogate, Walker-Andrews, & Bahrick, Reference Gogate, Walker-Andrews and Bahrick2001). Previous findings show that listeners discriminate and identify phonemes with more accuracy when visual (e.g., Alm, Behne, Wang, & Eg, Reference Alm, Behne, Wang and Eg2009; Schwartz, Berthommier, & Savariaux, Reference Schwartz, Berthommier and Savariaux2004) and haptic (Gick & Derrick, Reference Gick and Derrick2009) information is presented next to the acoustic information. Infants are sensitive to the visual aspects of speech from very early on (see Esteve-Gibert & Guellai, Reference Esteve-Gibert and Guellaï2018, for a review), and they use information from lip and head movements to acquire novel phonological contrasts. Learners perceive and identify novel consonants and vowels better after being exposed to audio-visual input compared to audio-only input, evidence coming from young infants (e.g., Ter Schure et al., Reference Ter Schure, Junge and Boersma2016; Weikum et al., Reference Weikum, Vouloumanos, Navarra, Soto-Faraco, Sebastián-Gallés and Werker2007), school-aged children (e.g., Erdener, Reference Erdener2007; Erdener & Burnham, Reference Erdener and Burnham2013), and adults (e.g., Aliaga-Garcia & Mora, Reference Aliaga-Garcia, Mora, Watkins, Rauber and Baptista2009; Cebrian & Carlet, Reference Cebrian, Carlet, Alegre, Moyer, Pladevall and Tubau2012; Hardison, Reference Hardison2003; Hazan et al., Reference Hazan, Sennema, Faulkner, Ortega-Llebaria, Iba and Chung2006; Ortega-Llebaria, Faulkner, & Hazan, Reference Ortega-Llebaria, Faulkner and Hazan2001). Of interest, the very few studies exploring preschoolers seem to indicate that the benefit of visual speech input on top of the auditory cues may be less clear in this age range. Erdener (Reference Erdener2007) tested 48 3- and 4-year-old English-speaking children in a nonnative (Thai) phoneme discrimination task and found that children discriminated nonnative phonemes better when presented in an audio–visual condition, and that their performance in the audio–visual condition was predicted by their ability in the auditory–only perception task (but not by their ability in the visual only—lip-reading—perception task).
In the current study we investigate if any of these additional visual cues (the presence of a socially interactive interlocutor, the interlocutor’s production of ostensive signals of the object–label, and the exposure to visual speech information) has a stronger impact in young children’s acquisition of nonnative phonemes. Young children are an interesting population to investigate because preschool is for many children the time when they start being exposed to a new language, either because the language at school is different from the one spoken in their home environment or because they start formal instruction in a second language (L2). Yet, as reviewed, most of previous research on the role visual input in phonological acquisition has been conducted with infants.
A word-learning task was chosen for the training because the presence of word referents enhances the learners’ creation of nonnative representations (e.g., Yeung, Chen, & Werker, Reference Yeung, Chen and Werker2014; Yeung & Werker, Reference Yeung and Werker2009). Young children’s phonetic discrimination abilities are compared after being trained in one of these three distinct word-learning conditions: a socially engaging condition in which the adult alternates his/her attention between a referent and his/her interlocutor, an ostensive-cueing condition in which the adult establishes a clear link between the referent and the linguistic input, and a visual-speech condition in which the adult faces the child without being socially engaging nor providing ostensive cues of the speech-meaning mapping. During the training children were exposed to minimal pairs of nonce words, which included English phonological contrasts that do not exist in their native languages (L1s) and which were consistently paired with an object of reference. The third training session was conducted with an eye-tracking system to check for the children’s eye-gaze patterns during the learning situation.
We predicted that if children only need easy access to the visual speech input to acquire nonnative phonological contrasts, their gains after being trained with the visual-speech trials will be higher than with any other trained condition. Instead, if social engagement is more crucial, children’s gains after being trained with the socially engaging condition will be higher than with the other conditions. Yet, if the ideal situation for the children’s acquisition of nonnative phonemes is one in which the L2 speaker provides the critical linguistic input while unambiguously referring to the meaning of the speech material, the ostensive-signaling condition will lead to higher gains. In terms of the children’s eye gaze preferences, if children use lip-reading to learn novel phonological contrasts, we expect them to look more at the mouth in conditions that elicit the highest acquisition gains. Instead, if a higher social engagement is more relevant, we expect more gaze shifts from mouth to object in conditions that lead to higher gains. Finally, if children benefit from an ostensive signal of the speech–meaning association, we expect more gazes at the object in conditions that lead to higher gains.
Method
Participants
A total of 47 Catalan/Spanish-speaking children participated in the study (21 4-year-olds and 26 5-year-olds, 23 boys and 24 girls). Children were recruited from a school at a 1-hr radius of Barcelona (Spain). The sole language of instruction at the school was Catalan. The children’s parents signed a consent form and filled in a language background questionnaire. Parents reported that their child was Catalan dominant (N = 22) or bilingual (N = 25, 17 Catalan/Spanish and 8 Catalan/Spanish/other).1 All children were included in the final sample because neither Catalan nor Spanish include the English phonological contrasts to be learned, and because additional analyses revealed no effect of the other languages spoken on our results.2
Stimuli
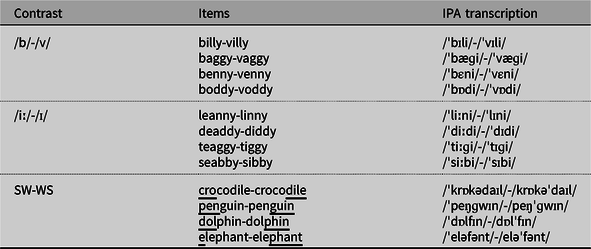
Three nonnative phonological contrasts were studied: a consonant contrast (/b/ vs. /v/), a vowel contrast (/iː/ vs. /ɪ/), and a lexical stress contrast (trochaic word vs. iambic word). The training and test materials contained these critical contrasts in the form of minimal pairs. In the consonant contrast, the following four minimal pairs of nonwords were used: baggy-vaggy (/bæɡi/-/væɡi/), boddy-voddy (/bɑːdi/-/vɑːdi/), billy-villy (/bɪli/-/vɪli/), and benny-venny (/bεni/-/vεni/). In the vowel contrast, the following four minimal pairs of nonwords were used: teaggy-tiggy (/tiɡi/-/tɪɡi/), deaddy-diddy (/didi/-/dɪdi/), leanny-linny (/lini/-/lɪni/), and seabby-sibby (/sibi/-/sɪbi/). In the lexical stress contrast, cognate words were used that have a trochaic (strong-weak; SW) pattern in English but an iambic (weak-strong; WS) pattern in Catalan or Spanish. Catalan and Spanish are languages with lexical stress, and so both SW and WS patterns are already present in the young children’s L1 vocabulary. The crucial difference between Catalan/Spanish and English is that many cognate words have a WS pattern in Catalan/Spanish but an SW pattern in English (e.g., “actor” in Spanish but “actor” in English, where underlying indicates stress position), and learners need to learn to relocate the stress syllable in order to produce the contrastive metrical pattern. Thus, the following four minimal pairs were used for the stress contrast: dolphin-dolphin , crocodile-crocodile , penguin-penguin , and elephant-elephant.
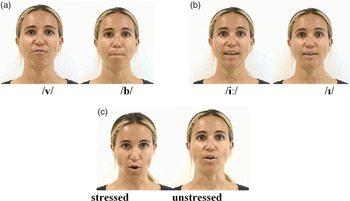
These contrasts were chosen because adult learners are found to discriminate and identify them better if the acoustic signal is accompanied by visual information (see Figure 1 for a display of the video frames corresponding to the points of maximal visual differentiation for each contrast). The two phonemes in the /b/-/v/ contrast have a different place of articulation (bilabial and labiodental, respectively) and thus their lip configuration varies. Previous studies on Catalan and Spanish learners of English suggest that visual information (lip-reading) influences the learners’ identification of these target consonants (Cebrian & Carlet, Reference Cebrian, Carlet, Alegre, Moyer, Pladevall and Tubau2012; Hazan et al., Reference Hazan, Sennema, Faulkner, Ortega-Llebaria, Iba and Chung2006; but see Pons, Lewkowicz, Soto-Faraco, & Sebastian-Galles, Reference Pons, Lewkowicz, Soto-Faraco and Sebastián-Gallés2009, for contradictory evidence in young infants and adults). The two phonemes /iː/-/ɪ/ also vary in terms of lip configuration (lips are wider spread in /iː/ than in /ɪ/, and there is a longer opening of the mouth in /iː/ than in /ɪ/) and Catalan/Spanish adult learners of English are found to rely on these visual differences for phoneme discrimination (Aliaga-Garcia, Reference Aliaga-Garcia2017; Flege, Reference Flege1989; Ortega-Llebaria et al., Reference Ortega-Llebaria, Faulkner and Hazan2001). For the lexical stress contrast, the visual cues are not related to the configuration of lips but to the movement of the head. When we speak we produce body gestures that are timely aligned with landmarks in speech. Head nods, one of these body gestures, are found to co-occur with prominent (i.e., stressed and/or pitch accented) syllables in speech (e.g., Esteve-Gibert, Borràs-Comes, Asor, Swerts, & Prieto, Reference Esteve-Gibert, Borràs-Comes, Asor, Swerts and Prieto2017; Hadar, Steiner, Grant, & Rose, Reference Hadar, Steiner, Grant and Rose1983; Ishi, Ishiguro, & Hagita, Reference Ishi, Ishiguro and Hagita2014), and listeners rely on these timely aligned co-speech body movements to detect prominent syllables in speech (Krahmer & Swerts, Reference Krahmer and Swerts2007).
Video frame of the point of maximal visual differentiation for each contrast. (a) Lip configuration at the onset of consonants /v/ and /b/ in the minimal pair venny-benny. (b) Lip configuration in the middle of the vowels /iː/ and /ɪ/ in the minimal pair seabby-sibby. (c) Head posture during the production of the “dol -’” syllable in a stressed and unstressed context in the minimal pair dolphin-dolphin .

Stimuli for the training phrase
One training trial consisted of six repetitions of a critical word that was inserted in the context of a meaningful phrase, as these contexts are found to help word–object mappings (Fennell & Waxman, Reference Fennell and Waxman2010; Namy & Waxman, Reference Namy and Waxman2000). Each training trial contained two parts (one per item of the minimal pair) and had the following shape: “Look, it’s a voddy! Look, a voddy! Voddy is nice! Nice voddy! Hey voddy! Voddy! [2-s pause] [Part 2:] Look! It’s a boddy! Look, a boddy! Boddy is nice! Nice boddy! Hey boddy! Boddy!” To avoid any learning bias, half of the trials had the /b/-/iː/-WS words in the first part of the trial and the /v/-/ɪ/-SW words in the second part, and the other half of the trials followed the opposite pattern.
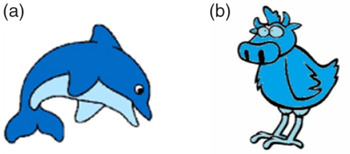
The visual display in each training trial consisted of the native speaker appearing in the middle of the screen, plus the two objects referred to being displayed on the left bottom corner (first half of the trial) and right bottom corner of the screen (second half of the trial; see Figure 2). In the consonant and vowel training trials, the object images were taken from the Novel Object and Unusual Name (NOUN) Database (Horst & Haust, Reference Horst and Hout2016). In the lexical stress training trials, critical words were cognates and therefore children already had a cognitive representation for them in their L1. We consequently used images depicting the real meaning of the word for the real word of the minimal pair (e.g., a drawing of a dolphin for the critical word dolphin), and a drawing resembling the real meaning for the counterpart words in the minimal pair (e.g., a drawing of a dolphin-like animal for the critical word dolphin; see Figure 2 as an example). Adobe Premiere Pro was used to insert the object of reference into the visual display.
Example of images depicting the meaning of target words of a minimal pair in the lexical stress training trials in which cognates were used. (a) A drawing depicting the meaning of the real word of a minimal pair (e.g., a dolphin). (b) A drawing depicting the meaning of the counterpart (nonreal) word in the minimal pair (e.g., a dolphin).

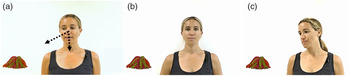
Each training trial was presented in three different visual conditions: a “socially engaging” condition, an “ostensive-cueing” condition, and a “visual-speech” condition. In the socially engaging condition, the speaker (native Northern American English) uttered the sentences containing the target word and then alternated her gaze between the child and the object of reference (Figure 3a). The speaker alternated the gaze six times during each training trial (one gaze alternation after each repetition of the critical word). In the visual-speech condition, the speaker only directed her gaze to the child but not to the object of reference during the production of the sentences (Figure 3b). In the ostensive-cueing condition, the speaker only directed her gaze to the object of reference but not to the child during the production of the sentences (Figure 3c). In total, the speaker produced 72 training trials (3 visual conditions × 3 phonological contrasts × 8 critical words per contrast).
Visual display of the three visual conditions during the training trials. (a) Example of the socially engaging condition. (b) Example of the visual-speech condition. (c) Example of the ostensive-cueing condition. The dashed arrows in (a) indicate a dynamic movement by which the speaker alternated her gaze between the object and the observer and did not appear in the real display.

Each training condition was designed to enhance one of the three visual cues that were our focus of interest, despite some degree of cue-overlap between them. In all three training conditions the speaker’s mouth was visible, but in the visual-speech condition young children were exposed longer (during the entire trial) and more clearly (front view) to visual speech cues. In all three conditions there was a triadic social interaction (child–speaker–object), but only in the socially engaging situation the speaker acted in a referential and engaging way (the visual-speech situation was nonreferential and in the ostensive-cueing the speaker did not establish eye contact with the child). Finally, in both the socially engaging and the ostensive-cueing conditions the speaker looked at the object of reference, but only in the ostensive-cueing condition the speaker uttered the target sound while staring at it (in the socially engaging situation the speaker first named the object and then directed her gaze toward it).
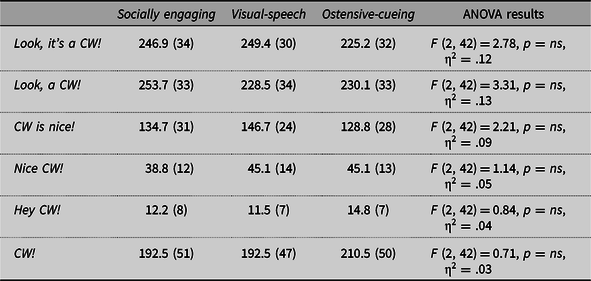
The speaker, a trained prosodist, was asked to use the same intonation and prosodic features across visual conditions to avoid children being attentive to specific word–object relations due to acoustic salience. We nonetheless acoustically analyzed all instances of critical words to check for any inconsistency in pitch range across visual conditions. Whenever a significant change was observed, we manipulated the pitch range in Praat (PSOLA Manipulation) to accommodate it to the mean. Table 1 shows the pitch range values of the critical words in the final stimuli across conditions. A linear regression analysis was applied to the data (with pitch range of the CW as the dependent variable and with visual condition as the fixed factor) and results showed that the pitch range values of the final critical words did not vary across conditions in any occurrence within the training trial (see results in Table 1).
Mean pitch range values in Hertz (SD in parentheses) of the critical word (CW) across visual conditions and for all carrier sentences within a training trial

Pre-, post-, and delayed posttraining discrimination tests
A same-different AX task was used to test children’s discrimination abilities. To create the stimuli for the pre- and posttraining discrimination tests, the last repetition of the critical word in each training trial of the visual-speech video-recordings was extracted. Stimuli were presented in an audio–visual format to children, but the visual display only showed the native speaker in the center of the screen, not the objects referred to.
In the AX task each child was presented with 24 test trials in a randomized order. There were 12 AA trials (4 trials × 3 phonological contrasts) and 12 AB trials (4 trials × 3 phonological contrasts). In AA trials each phoneme/phonological pattern was represented twice (e.g., for the consonant contrast, there were 2 AA trials with /v/-/v/ and 2 AA trials with /b/-/b/). In AB trials the order of the phoneme/phonological pattern combination was also repeated twice (e.g., for the vowel contrast, there were 2 AB trials with a /iː/-/ɪ/ order and 2 AB trials with a /ɪ/-/iː/ order; see Appendix A for a list of test trials in the pre- and posttests).
Procedure
Children were assessed on their discrimination abilities before and after the word-label phonetic training. The pretest occurred 1 week before the training. There were three training sessions, spaced at about 7–9 working day intervals. The posttest took place 1 week after the last training session and was followed by a delayed posttest 3 weeks later to check for long-term gains. Children were tested in a silent room at the school setting and they always wore Beyerdynamic DT-770 closed (noise-canceling) headphones during the tasks.
Pre-, post-, and delayed posttraining discrimination tests
A total of 8 practice trials (4 AA and 4 AB) preceded the beginning of the 24 test trials, to familiarize the child with the task and to check their ability to distinguish the concept “same” and “different.” Practice trials contained phonological contrasts that were noncritical and that belonged to the children’s L1 (e.g., /s/-/k/ or /k/-/t/). If the child did not respond correctly to any practice trial, the experimenter gave feedback to the child by emphasizing the different phoneme in AB trials, or emphasizing the phonological coincidence in AA trials. Only when the experimenter was sure that the child eventually understood why the two target words in the minimal pair were the same or different, the experimenter moved to the next trial.
A PowerPoint presentation was used to advance through the trials. The experimenter, who was the first author of the study, sat next to the child and handled the PowerPoint presentation using a wireless mouse. To keep children interested in the task, test trials were alternated with attention-getting slides. In these slides animals were hidden behind colored squares and children had to point at the square to be uncovered, one at a time. The test session lasted about 15–20 min for 5-year-old children and 20–25 min for 4-year-old children (younger children spent more time looking at the attention-getting slides).
After each trial children were asked to say whether they heard an exact repetition of the same word (target response in AA trials) or, instead, two words that varied slightly (target response in AB trials). The children’s responses were manually coded in a score sheet by the experimenter. To rule out the possibility that they would respond incorrectly because they would not be able to choose the appropriate verbal label for “same” and “different,” their response was behavioral rather than verbal: using a small set of Lego pieces, they were asked to give 2 same pieces to the experimenter if they heard 2 same words, or 2 different pieces if they heard 2 different words. They scored “0” if they responded “same” in an AB trial or “different” in an AA trial, and “1” if they responded “different” in an AB trial or “same” in an AA trial. If the child responded “I don’t know,” the experimenter played the stimulus again. If the child did not respond in the second repetition, the experimenter asked the child to make a guess about the response. If the child responded but in an uncertain way (according to the experimenter, as perceived by his/her facial expression or the prosodic features of the voice), the experimenter asked, “Are you sure?” to the child. If the answer was “yes,” the experimenter coded the response in the score sheet; if the answer was “no,” the experimenter played the trial again to the child and asked him/her to respond again. In case of a divergence, the response that was coded was always the latest. This procedure had to be applied in 1.4% of the trials.
Training sessions
Each of the 3 training sessions consisted of 12 training trials, divided into 3 blocks, each block including 4 trials that trained one specific phonological contrast in a specific visual condition. Contrast and visual condition were counterbalanced and randomized across participants in a Latin square design and resulted in three different lists so that each block changed according to the list. Participants were randomly assigned to the lists (see summary in Table 2).
Summary of the various trained conditions across blocks and lists

A PowerPoint presentation was used to advance through the trials. The experimenter sat next to the child and handled the PowerPoint presentation using a wireless mouse. Children were asked to attend to the screen during the training sessions and did not have to perform any activity. Attention-getting slides were alternated between blocks to make sure children kept being attentive and maintained their interest in the trials. Attention-getting slides consisted of a display of several objects (e.g., fruits) that sometimes were repeated, and children had to point at repeated ones. The experimenter only interacted with the child during the attention-getting slides to animate the task and make sure the child kept on being attentive. When the attention-getting task finished, the experimenter told the child that the presentation would move to the next trial, and did not interact with the child until the next between-block pause. One training session lasted about 20–25 min for 5-year-old children and 25–30 min for 4-year-old children (younger children were again slower in the attention-getting slides).
The last training session was conducted with an eye-tracking system (Tobii X 120) to check for the children’s gaze patterns during the learning situation. Because children showed traces of fatigue during the last trials of the second training session, this third training session was designed as significantly shorter: it included only 3 training trials, 1 trial per block (instead of the 4 trials per block in the previous sessions). Children’s gaze patterns were recorded during the third training session because we estimated it was the session where children would display less anxiety (as they were already familiarized with the experimenter, the experimental setting, and the task), and so their behavior would be more natural and the gaze patterns would be better indicators of the children’s phonological learning.
Results
Accuracy scores
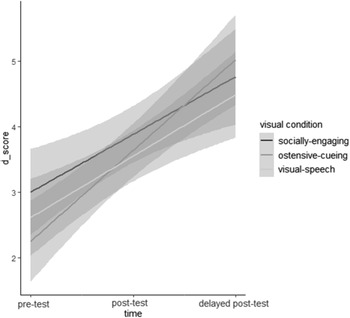
Children’s accuracy in discriminating between phonological contrasts was calculated using d’ scores, an unbiased signal detection theory measure that corrects for any potential bias in learners’ responses (MacMillan & Creelman, Reference MacMillan and Creelman2005). For that, the hit rate (proportion of “different” responses in AB trials) and false alarm rate (proportion of “different” responses in AA trials) were calculated for each participant and contrast, and then z-transformed. The final score represents a subtraction of the z-transformed false alarm rate from the z-transformed hit rate.
Figure 4 shows the d’ scores across the three different time points (pretest, posttest and delayed posttest) and as a function of type of visual condition. It reveals that children were more accurate in the posttest compared to the pretest, independently of the visual condition in which they were trained. It also shows that children’s accuracy upheld at the delayed posttest only when being trained with the ostensive-cueing condition.
Children’s accuracy in distinguishing the phonological contrasts (as measured by d’ scores), across the three testing sessions and as a function of the social interaction in which they were trained.

To investigate whether children’s gains across testing sessions significantly varied as a function of the trained visual condition, the phonological contrast, and the children’s age, two linear mixed effects models were fit using the lmer function of the lme4 package (Bates, Maechler, Bolker, & Walker, Reference Bates, Maechler, Bolker and Walker2015) in R (R Core Team, 2014). One model included gains between pretest and posttest as the dependent variable, while the other model included gains between pretest and delayed posttest as the dependent variable. In both models the fixed factors were visual condition (3 levels: socially engaging, visual-speech, and ostensive-cueing), age (2 levels: 4 year olds, and 5 year olds), and phonological contrast (3 levels: consonant, vowel, and lexical stress), and had a by-participant random slope for the effect of visual condition.3
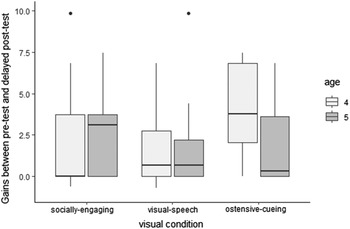
The first model revealed that gains between pretest and posttest were not affected significantly by visual condition, χ2 (2) = 0.24, p = .88, age, χ2 (1) = 0.01, p = .92, phonological contrast to be learned, χ2 (2) = 1.20, p = .55, nor by any interaction between these factors, χ2 (2) = 4.42, p = .11, for Visual Condition × Age; χ2 (4) = 5.68, p = .22, for Visual Condition × Phonological Contrast; χ2 (2) = 2.19, p = .33, for Phonological Contrast × Age. The second model showed that gains between pretest and delayed posttest were significantly affected by visual condition, χ2 (2) = 7.17, p < .05, by an interaction between visual condition and age, χ2 (2) = 8.47, p < .05) and by an interaction between visual condition and phonological contrast, χ2 (4) = 9.49, p = .05. An inspection of the estimated coefficients of the second model showed, first, that the main effect of visual condition was because children learned significantly more in the ostensive-cueing condition compared to the socially engaging (β = –1.38, SE = 0.57, t = –2.42, p < .05) and visual-speech (β = –1.21, SE = 0.57, t = –2.13, p < .05) conditions, the last two not differing between each other (β = 0.16, SE = 0.57, t = .29, p = 77). Second, and as illustrated by Figure 5, we found that visual condition and age interacted in that 4-year-olds learned significantly more than 5-year-olds in the ostensive-cueing condition (β = –3.01, SE = 0.93, t = –3.23, p < .01), all other comparisons being nonsignificant (age 4 vs. age 5 in visual-speech condition: β = –0.26, SE = 0.93, t = –0.28, p = .77; age 4 vs. age 5 in socially engaging condition: β = –0.17, SE = 0.93, t = –0.18, p = .85). Third, the interaction between visual condition and phonological contrast was due to the ostensive-cueing condition leading to higher gains in the consonant contrast (ostensive-cueing vs. socially engaging: β = –2.45, SE = 1.13, t = –2.16, p < .05; ostensive-cueing vs. visual-speech: β = –1.81, SE = 1.13, t = –1.59, p = 11; socially engaging vs. visual-speech: β = 0.64, SE = 1.16 t = 0.56, p = .58), and in the vowel contrast (ostensive-cueing vs. socially engaging: β = –2.48, SE = 1.13, t = –2.19, p < .05; ostensive-cueing vs. visual-speech: β = –0.80, SE = 1.15, t = –0.69, p = .49; visual-speech vs. socially engaging: β = –1.68, SE = 1.13, t = –1.48, p = .14). Instead, for learning the lexical stress contrast, the comparison across conditions was not significantly different (socially engaging vs. visual-speech: β = –1.92, SE = 1.13, t = –1.69, p = .09; socially engaging vs. ostensive-cueing: β = –0.89, SE = 1.15, t = –0.77, p = 44; visual-speech vs. ostensive-cueing: β = 1.03, SE = 1.13, t = 0.91, p = .36). Neither age nor phonological contrasts, nor the interaction between these two came out as significant, χ2 (2) = 2.67, p = .11; χ2 (2) = 3.71, p = .16; χ2 (2) = 0.84, p = .66, respectively.
Boxplots depicting gains between pretest and delayed posttest (measured by d’ scores), as a function of the three distinct visual conditions and of the children’s age.

Children’s gaze patterns
Three areas of interest (AoI) were defined in the training materials: the speaker’s mouth, the speaker’s eyes, and the object of reference (either on the bottom left or on the bottom right corner of the screen). Because the position of the speaker’s mouth and eyes slightly varied across video frames, especially in the socially engaging condition, these AoIs were set in a dynamic way in order to account for the distinct positions of the target AoI in the visual space. Assuming that it takes about 200 ms for the eyes to program a saccade in reaction to a linguistic stimulus (e.g., Altmann & Kamide, Reference Altmann, Kamide, Henderson and Ferreira2004; Matin, Shao, & Boff, Reference Matin, Shao and Boff1993; Salverda, Kleinschmidt, & Tanenhaus, Reference Salverda, Kleinschmidt and Tanenhaus2014), we extracted children’s gaze patterns at the onset of the critical words and until the critical word ended, adding a leeway of 200 ms from the offset of the target word. For the analyses we only considered children’s gaze patterns during critical words, and hence looks during the sentence context of these words were excluded.
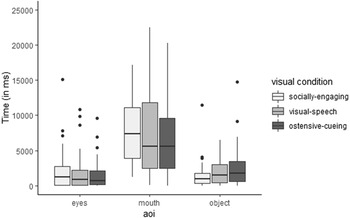
Figure 6 shows the amount of time spent on each AoI for each trained visual condition. Overall children looked more at the mouth than at the other AoI in the three trained conditions. Within each AoI, some differences can be observed across trained conditions: children seemed to look longer at the eyes in the socially engaging condition, and this same condition also seemed to elicit more looks at the mouth than any other condition. In contrast, children seemed to spend more time looking at the object of reference in the ostensive-cueing condition (a bit less in the visual-speech condition and even less in the socially engaging condition).
Boxplots displaying the amount of time (in milliseconds) children spent looking at each area of interest (AoI) across the three distinct trained visual conditions.

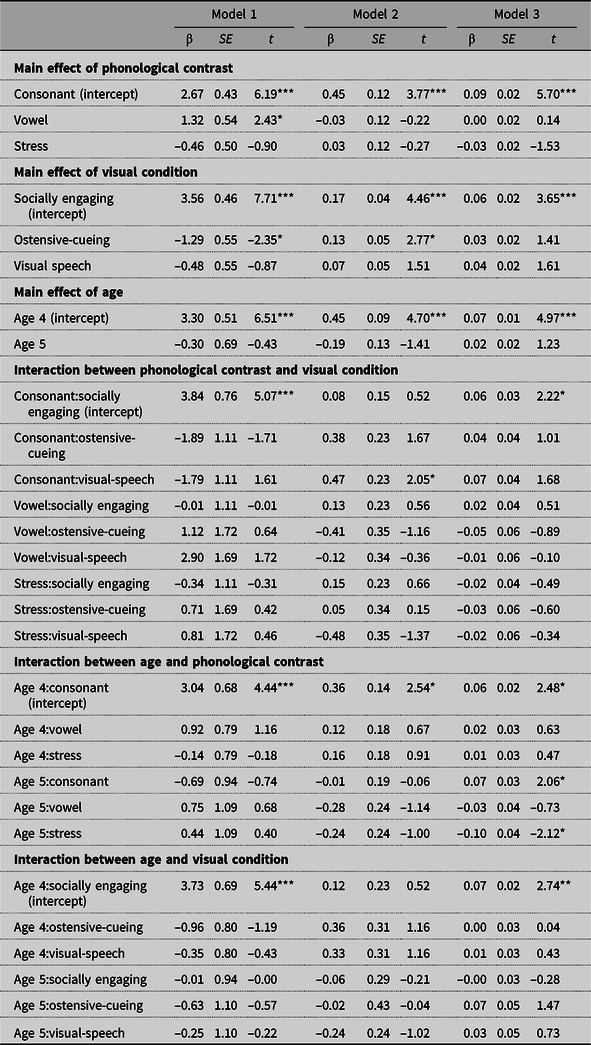
Three linear mixed models were applied to the data to explore children’s looking patterns across visual conditions, phonological contrasts, and age, using the lmer function of the lme4 package (Bates et al., Reference Bates, Maechler, Bolker and Walker2015) in R (R Core Team, 2014). The first model explored the odds ratio of time looking at the mouth versus at the other two AoI; the second model explored the odds ratio of time looking at the object of reference versus at the other AoI; the third model investigated odds ratio of looking shifts between mouth and object of reference versus gazes to mouth, object, or eyes (without shifting between regions). In all models fixed factors were visual condition (3 levels: socially engaging, visual-speech, and ostensive-cueing), age (2 levels: 4 year olds and 5 year olds), and phonological contrast (3 levels: consonant, vowel and lexical stress). Participant and item were set as random factors. The structure of the models was determined by our research predictions: if the relevant visual information is the processing of mouth and lip speech movements, fixations on the mouth would be higher in conditions with higher phonological gains (first model); instead, if the relevant visual information is an ostensive cueing of the relation between phonetic input and object of reference, fixations on the object of reference would be higher in conditions with higher phonological gains (second model); or, in contrast, if the relevant visual information is the social interaction and triadic joint attentional frame, gaze shifts between mouth and object would be higher in conditions with higher phonological gains (third model).
The results of the first model (time looking at mouth vs. at other AoI) showed a main effect of phonological contrast, χ2 (2) = 17.38, p < .01, and a marginal effect of visual condition, χ2 (2) = 5.1991, p = .07, but no main effect of age, χ2 (1) = 0.24, p = .62, nor any interaction between the three factors, Age × Visual Condition: χ2 (2) = 1.05, p = .59; Age × Phonological Contrast: χ2 (2) = 0.67, p = .72; Visual Condition × Phonological Contrast: χ2 (4) = 3.38, p = .50. The estimated coefficients revealed that children spent more time looking at the mouth when presented with the vowel contrast and when being trained with the socially engaging condition (see estimated coefficients of this and the other two models in Table 3).
Coefficient effects of all main effects and 2-way interactions of the three models exploring the children’s looking patterns across visual conditions, phonological contrasts, and age

NOTE: Model 1 explores the amount of time looking at the mouth versus at other areas of interest (AoI); Model 2 explores the amount of time looking at the object of reference versus other AoI; Model 3 explores looking shifts between mouth and object of reference versus “static” gazes to mouth, object, or eyes. *p < .05. **p < .01. ***p < .001.
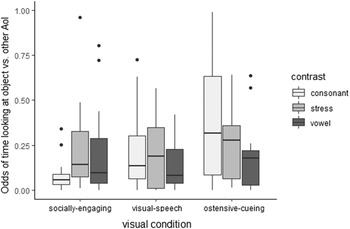
The second model (time looking at object of reference vs. at other AoI) revealed a main effect of visual condition, χ2 (2) = 8.15, p < .05, and a main interaction between visual condition and phonological contrast, χ2 (4) = 15.33, p < .01, all other main effects and interactions being nonsignificant, main effect of age: χ2 (1) = 1.15, p = .28; main effect of phonological contrast: χ2 (2) = 3.51, p = .17; Age × Visual Condition: χ2 (2) = .88, p < .25; Age × Phonological Contrast: χ2 (2) = 0.74, p = .69. The estimated coefficients indicate that children looked more at the object of reference in the ostensive-cueing condition than in the other conditions, and that in the ostensive-cueing condition the consonant contrast triggered more looks at the object of reference than the vowel or lexical stress contrasts (see Table 3 and Figure 7).
Box plots representing the odds ratio of time looking at the object of reference (vs. other areas of interest; AoI), across visual conditions and phonological contrasts.

The third model (looking shifts between mouth and object of reference vs. “static” gazes to mouth, object, or eyes) showed no main effects of visual condition, χ2 (2) = 3.33, p = .19, phonological contrast, χ2 (2) = 3.70, p = .16, or age, χ2 (1) = 1.50, p = .22, nor any interaction between any of these factors; Visual Condition × Age: χ2 (2) = 2.14, p = .34; Visual Condition × Phonological Contrast: χ2 (4) = 1.12, p = .89; Phonological Contrast × Age: χ2 (2) = 4.56, p = .10. These results indicate that children shifted their gaze between the speaker’s mouth and object of reference at a similar proportion in all training visual conditions and independently of the phonological contrasts to be learned and of their age (see all coefficients in Table 3).
Discussion
The present study aimed at investigating which enriching visual cues are particularly helpful for training preschoolers’ perception of nonnative phonemes: that in which learners can easily access visual speech information, that in which novel phonemes are presented in a socially engaging situation, or that in which there is a clear link between a reference entity and the phonological input. We designed a training study in which Catalan/Spanish-speaking preschoolers were presented with three novel English phonological contrasts in a context of an object-labeling task: the /b/-/v/ distinction (Catalan/Spanish learners of English assimilate /v/ to /b/), the /iː/-/ɪ/ contrast (Catalan/Spanish learners of English assimilate /iː/ to the native /i/ and /ɪ/ either to /i/ or to /e/), and the SW-WS contrast (although Catalan, Spanish, and English are languages with lexical stress, many cognate words have the opposite stress pattern in both languages: WS in Catalan and Spanish but SW in English). The preschoolers’ accuracy in perceiving these contrasts was assessed before and after training, to evaluate which trained enriching visual cue leads to higher phonological gains, and the children’s gaze preferences during the training phase were recorded using an eye tracker, to investigate the relation between the children’s focus of attention and their learning gains.
The analysis revealed that children’s learning of nonnative phonological contrasts is boosted in the ostensive-cueing condition, as this visual condition contributed to higher long-term gains than the other visual conditions. When children were assessed immediately after the training (posttest), similar gains were observed across all trained visual conditions, children’s age, or nature of the novel phonological contrast (consonant, vowel, and stress position). However, when children’s gains were evaluated some weeks after the training (delayed posttest), a main effect of visual condition arose and the ostensive-cueing condition emerged as the ideal frame for acquiring L2 phonological contrasts. Our results on preschoolers align with previous results reporting crucial effects of referential cues for young infants’ phonological categorization in object-labeling tasks (Fennell & Waxman, Reference Fennell and Waxman2010; Yeung, Chen, & Werker, Reference Yeung, Chen and Werker2014; Yeung & Werker, Reference Yeung and Werker2009). In all learning conditions the object of reference was visually available when the novel phonological information was uttered, but only in the ostensive-cueing condition stimuli the L2 speaker was ostensibly looking at the object of reference during the entire trial, and therefore also when naming the target object and producing the nonnative phonological input to be learned. We argue that this visual situation helped establishing an unequivocal link between phonological input and its meaning in the real world, and hence enhanced phonological learning.
Previous studies on young infants had also reported that referential and lexical factors influence positively the acquisition of novel phonological categories at early stages in development. At the level of the word form, it has been found that infants form novel phonological categories when the fine-grained detailed acoustical information is paired to distinct lexical contexts (Feldman et al., Reference Feldman, Myers, White, Griffith and Morgan2013; Thiessen, Reference Thiessen2011). At the level of word meaning, infants acquire novel phonemes if these have a functional value, that is, if there is a consistent pairing between novel phonemes and object of reference that reinforce phonetic distinctiveness (Fennell & Waxman, Reference Fennell and Waxman2010; Yeung & Werker, Reference Yeung and Werker2009). The importance of meaningful interactions for language learning does not seem to decline with age. During preschool years, shared attention cues and adult responsiveness are a better predictor of language skills than simple exposure (Romeo et al., Reference Romeo, Leonard, Robinson, West, Mackey, Rowe and Gabrieli2018; Rowe & Snow, Reference Rowe and Snow2020), and our study suggests that preschoolers’ phonological learning is boosted when the presence of an object of reference is accompanied by ostensive unequivocal signs of the sound–object relation.
Next to the essential status of referential clarity, previous work had found that learners use social interactive joint-attentional frames (Bannard & Tomasello, Reference Bannard and Tomasello2012; Kuhl, Reference Kuhl2007; Kuhl et al., Reference Kuhl, Tsao and Liu2003; Roseberry et al., Reference Roseberry, Hirsh-Pasek and Golinkoff2014) and visual speech information (i.e., the observation of the interlocutor’s lip movement when speaking) to discriminate between nonnative phonemes (e.g., Hardison, Reference Hardison2003; Hazan et al., Reference Hazan, Sennema, Faulkner, Ortega-Llebaria, Iba and Chung2006; Ortega-Llebaria et al., Reference Ortega-Llebaria, Faulkner and Hazan2001; Ter Schure et al., Reference Ter Schure, Junge and Boersma2016; Weikum et al., Reference Weikum, Vouloumanos, Navarra, Soto-Faraco, Sebastián-Gallés and Werker2007). In our study we also found that children looked at the speaker’s mouth more than her eyes or the object of reference, when the critical phonological input unfolded. Because this happened in the three trained visual conditions, we can presuppose that preschoolers attend to the speaker’s mouth by default in any learning situation and independently of the visual context. This means that providing clear visual-speech information does not imply that children will look more at the mouth and that they will improve their nonnative phoneme perception. Similarly, the socially engaging situation we designed did not significantly contribute to make children shifting their gaze between the L2 speaker and the object of reference, nor boosted their nonnative phoneme acquisition. Instead, providing ostensive cues to the object-label mapping did enhance children’s long-term learning of nonnative phonemes.
Why is it that, compared to ostensive-cueing signs, visual speech and socially engaging cues have a lesser contribution to long-term phonological gains? Several explanations may be suggested. One relates to the learners’ age. Existing theoretical accounts propose that the value of any feature of the linguistic input for learning varies depending on the learner’s age and the learner’s linguistic ability (Rowe & Snow, Reference Rowe and Snow2020). Longitudinal studies provide the ideal evidence to see which features of the visual input matter more for nonnative phonological acquisition at each developmental stage, but they are scarce. In his seminal study, McGurk and MacDonald (Reference McGurk and MacDonald1976) tested preschoolers, school-aged children, and adults, and found that adults were more influenced by visual speech information than school-aged or preschool children when perceiving speech sounds. Similarly, Erdener and Burnham (Reference Erdener and Burnham2013) compared speech perception by 5-, 6-, 7-, and 8-year-old children and adults across two conditions (matching vs. mismatching audio-visual McGurk stimuli), and found that adults were more influenced than children by visual speech information. Cross-sectional studies with young infants find that visual speech input has a positive effect on the listener’s perception of nonnative sounds (Teinonen, Aslin, Alku, & Csibra, Reference Teinonen, Aslin, Alku and Csibra2008; Ter Schure et al., Reference Ter Schure, Junge and Boersma2016; but see divergent results in Pons et al., Reference Pons, Lewkowicz, Soto-Faraco and Sebastián-Gallés2009), and cross-sectional studies with adults obtain similar findings (Cebrian & Carlet, Reference Cebrian, Carlet, Alegre, Moyer, Pladevall and Tubau2012; Ortega-Llebaria et al., Reference Ortega-Llebaria, Faulkner and Hazan2001). Tentatively, it could be suggested that the importance of visual speech information follows a U-shaped pattern: stronger effect in infancy and adulthood, and a temporary regression in childhood. Some accounts propose that distinct cues matter differently in the course of development (Hollich, Hirsh-Pasek, & Golinkoff, Reference Hollich, Hirsh-Pasek and Golinkoff2000), and nonlinear developmental trajectories have been observed in various dimensions of language acquisition (Gershkoff-Stowe & Thelen, Reference Gershkoff-Stowe and Thelen2004; Marcus, Reference Marcus2004). Future longitudinal studies that include infants, children, and adult populations are needed to investigate this potential age-related effect in more detail.
The nonlinearity explanation seems to be less appropriate to interpret the lack of boosting effect of the socially engaging situation. Previous cross-sectional studies find that social interactions are crucial in young infants’ language learning (Bannard & Tomasello, Reference Bannard and Tomasello2012; Kuhl, Reference Kuhl2007; Kuhl et al., Reference Kuhl, Tsao and Liu2003; Roseberry et al., Reference Roseberry, Hirsh-Pasek and Golinkoff2014), and that the importance of social cues in language learning does not decrease with age (Rowe & Snow, Reference Rowe and Snow2020). It could be, however, that the specific features of the social interaction are determinant. In our socially engaging training stimuli, the L2 speaker uttered the phrase containing the critical phonological contrast and then turned her gaze toward the object of reference. From a novice learner point of view, this might have blurred the relation between linguistic input and object, as children might have not known if any portion of the carrier sentence referred to the object. Previous studies have observed that learning takes place when the young learner is focusing her attention on the relevant referent and at the same exact time perceive the linguistic input that refers to this element (Yu & Smith, Reference Yu and Smith2012). In the successful ostensive-cueing condition the adult speaker provided the phonological input while directing her gaze to the object of reference, and this might have reduced the referential ambiguity of the nonnative phonological input. The children’s fixations on the object of reference are in line with these time-related effects: young children fixated on the object of reference significantly more in the ostensive-cueing condition, increasing the children’s chances to process the nonnative phoneme while attending to its object of reference.
Providing learners with the relevant linguistic information in synchrony with the learners’ focus of interest is typical of contingent contexts. In a contingent situation the adult follows the infant’s focus of interest and therefore provides linguistic input that refers to meanings that are highly relevant for the child. Our eye-tracking results show that the most contingent visual context in our study was the ostensive-cueing situation, as the speaker provided the linguistic input that referred to the actual child’s focus of interest. Previous research reported positive correlations between social contingency and infants’ linguistic development (e.g., Bannard & Tomasello, Reference Bannard and Tomasello2012; Hakuno et al., Reference Hakuno, Omori, Yamamoto and Minagawa2017; McGillion et al., Reference McGillion, Herbert, Pine, Vihman, Keren-Portnoy and Matthews2017; Nussenbaum & Amso, Reference Nussenbaum and Amso2015; Roseberry et al., Reference Roseberry, Hirsh-Pasek and Golinkoff2014, see Mermelshtine, Reference Mermelshtine2017, for a review). Our study adds to this body of findings by supporting the positive effects of contingent behaviors in young children’s nonnative phonological acquisition, but also calls for a more precise picture: we found that the younger the learners, the more they may need contingent interactions to acquire sounds that do not belong to their native phonological system.
This study investigated segmental and suprasegmental contrasts. At the segmental level, children learned to discriminate nonnative consonant and vowel contrasts, and at the suprasegmental level children learned to relocate the stressed syllable in cognate words. Our eye-tracking results show that the vowel contrast triggered more looks at the mouth than any other contrast, while the consonant contrast triggered more looks at the object of reference than any other contrast. The acoustic salience of each contrast, and its relative distance with the native category, might explain this pattern of results, as predicted by the perceptual assimilation model (Best & Tyler, Reference Best, Tyler, Munro and Bohn2007). As a trade-off effect, learners might have looked more to the visual speech information (the mouth) when there was less acoustic salience, and they might have looked less at the mouth (and more at the object) when acoustic salience was higher. The tense /iː/–lax /ɪ/ vowel contrast is particularly challenging for Catalan/Spanish learners of English, as neither Catalan nor Spanish have any tense-lax contrast in their vocalic system. It has been found that the acoustic signal is not highly reliable for learners, as they are found to associate the lax /ɪ/ vowel to the /i/ and /e/ categories (Cebrian, Reference Cebrian2006), so the children in the present study might have focused more on the mouth to compensate for the lack of acoustic reliability. Instead, Catalan and Spanish consonantal inventory does not include the voiced labiodental fricative /v/, but both languages have bilabial-labiodental contrast (as in /b/-/f/). The consonant contrast might have been more acoustically salient, and so they focused less on visual speech input and more on the object of reference.
One of the limitations of the current study is the lack of speaker variability during the distinct sessions. The same L2 speaker produced the stimuli during the training sessions and was also presented in the pre- and postdiscrimination tests. Our current results do not show if children generalize the learned patterns to new speakers. Likewise, we did not include nontrained stimuli in the posttest discrimination tasks to look for generalization. While the inclusion of the delayed posttest task was an attempt to investigate long-term more stable phonological gains, we agree that future work should address these concerns.
For many children in the world the preschool period is the time when they first get in contact with an additional language, either because the language used at home differs from that in the school setting or because it is when the school system starts the formal instruction of a L2. Among other things, these children need to be sensitive to the fact that the new language has a distinct phonological system, and therefore need to construct new phonological categories that might not exist in their L1. Investigating how they manage to do it was one of the motivations for the present study. Our study showed that young preschoolers learn nonnative phonemes better if they are presented with ostensive signs of the relevant object of reference, as in contingent situations. The presence of clear and contingent mapping between linguistic input and referential function seems to outrank the availability of clear visual speech input or the amount of social interactivity, at least for the contrasts we studied, at preschool age, and when gains are measured in the long-term. We do not claim that visual speech cues or social engagement could or should be erased from a learning situation, only that an ideal learning situation for preschoolers is one in which children have the opportunity to clearly match what the interlocutor says with what the interlocutor means.
Acknowledgments
Thanks to teachers, parents, and children at the Escola Dolors Piera school in Vilafranca del Penedès (Barcelona). We thank Joan C. Mora for his advice in analyzing the results and Jill Thorson for her help with the stimuli. This research was funded by Grants FJCI-2015-26845 and SGR 560.
Appendix A LIST OF TEST TRIALS