Introduction
Environmental pollution and energy shortages are problems of globalization and urgently need to be resolved. How to remove pollutants efficiently is a hot and difficult point in research [Reference Colmenares and Luque1]. Heterogeneous photocatalytic oxidation technology has the characteristics of low energy consumption, mild reaction conditions, and no secondary pollution [Reference Yin and Zhu2, Reference Li, Wei, Hu, Wu and Li3]. It is an effective technology to solve environmental pollution and energy shortage problems [Reference Pasti, Sarti, Martucci, Marchetti, Stevanin and Molinari4, Reference Mena, Rey and Beltrán5]. The key to the application of this technology in life is to find or design efficient photocatalysts. At present, photocatalysts are mainly based on traditional inorganic semiconductors [Reference Saavedra, Pursell and Chandler6, Reference Schlexer, Widmann, Behm and Pacchioni7, Reference Nguyen, Nguyen and Do8]. Doping and morphological modification of traditional inorganic semiconductor photocatalysts can improve their photocatalytic activity [Reference Chiarello, Ferri and Selli9, Reference Camacho, Rey, Hernández-Alonso, Llorca, Medina and Contreras10, Reference Shen, Xie, Ding, Liu, Adamski, Chen and Li11]. But their application is affected, because of the difficulty of modification and unstable activity. As a new material, metal–organic frameworks (MOFs) have been studied in gas storage [Reference Spanopoulos, Tsangarakis, Klontzas, Tylianakis, Froudakis, Adil and Trikalitis12, Reference Yang and Xu13], adsorption [Reference Hasan and Jhung14, Reference Liao, Huang, Zhang, Zhang and Chen15, Reference Lin, Xiang, Xing, Zhou and Chen16], fluorescence [Reference Lu and Yan17, Reference Shustova, McCarthy and Dinca18, Reference Li, Liao, Liao and Jiang19], magnetism [Reference Liao, Li and Yin20, Reference Liao, Yang, Li, Jiang and Yin21, Reference Yin, Liao, Wu, Pang and Li22, Reference Jia, Li and Jiang23], and reduction of CO2 [Reference Hod, Sampson, Deria, Kubiak, Farha and Hupp24, Reference Chen, Han, Tian, Liu, Liang, Deng and Lin25]. It has also made some good achievements in photocatalytic degradation of organic pollutants [Reference Li, Yu, Jaroniec and Chen26, Reference Pi, Li, Xia, Wu, Li, Xiao and Li27, Reference Huang, Zhang, Song, Chen, Han and Wen28, Reference Azhar, Vijay, Tadé, Sun and Wang29, Reference Li, Xie, Jiang, Yu and Zhang30, Reference Li, Shen, Ma, Chen and Xie31, Reference Zhang, Wan, Li, Dong and Zhou32, Reference Thirugnanam, Song and Wu33, Reference Yan, Xu, Chai, Wang, Wang and Ren34, Reference Challagulla and Roy35, Reference Feng, Zeng, Chen, Ma, Zhao, Jin, Lu, Wu and He36]. However, these materials need to be prepared at the nano-level to show high photocatalytic activity. When two-dimensional materials are stripped into flakes near the atomic level, their quantum sheets are obtained.
Two-dimensional material quantum sheets can improve the catalytic performance when the surface atoms and/or active sites are completely exposed [Reference Li, Sun, Wu, Wei and Hu37, Reference Li, Feng, Hu, Wei, Wu and Huang38]. At present, two-dimensional materials mainly include MOS2, graphene, WS2, and some MOFs [Reference Yin and Tang39, Reference Dou, Wong, Yu, Lai, Kornienko, Eaton, Fu, Bischak, Ma, Ding, Ginsberg, Wang, Alivisatos and Yang40, Reference Huang, Li, Huang, He, Gong, Hu, Wang, Xu, Tian, Liu, Ye, Wang, Zhou, Zhang and Zhang41, Reference Han, Zhang, Gao, Chen, Liu, Mi and Chang42, Reference Xu, Yuan, Chen, Chang, Day, Gu and Zhou43]. Most of them are based on single valence states of atoms or ions. Recently, the author synthesized a two-dimensional polymer directly composed of inorganic ion coordinated with Cu(I)/Cu(II) [Reference Li, Feng, Hu, Wei, Wu and Huang38]. We classify it as inorganic coordination polymer, and its quantum sheet is described by inorganic coordination polymer quantum sheets (ICPQS). The ICPQS has a thickness of about 0.2 nm and a specific surface area of only 132.5 cm3/g, but its photocatalytic degradation rate of methylene blue (MB) can reach 2.5 mg/(L min), which is 45.7 times higher than that of the reference photocatalyst MoS2 QS [Reference Li, Feng, Hu, Wei, Wu and Huang38]. Even if the quantum sheets of the photocatalysts expose more catalytic active sites, the smaller specific surface area is not conducive to the enrichment of organic pollutants, thereby affecting the photocatalytic activity. Therefore, the composite photocatalyst should exhibit higher photocatalytic performance when the ICPQS are loaded on materials with high specific surface area.
The graphene oxide (GO) is a new type of carbon material with excellent properties [Reference Sim, Moon, An, Kang, Jerng, Moon and Nam44, Reference Voiry, Yamaguchi, Li, Silva, Alves, Fujita, Chen, Asefa, Shenoy, Eda and Chhowalla45], which has high specific surface area and abundant surface functional groups. In this paper, a series of ICPQS@GO composite photocatalysts are synthesized by adding GO to the synthesis process of ICPQS. These composite photocatalysts are characterized by powder X-ray diffraction (PXRD), X-ray photoelectron spectroscopy (XPS), scanning electron microscopy (SEM), UV–Vis diffuse reflectance spectra, Zeta potential, and N2 adsorption/desorption isotherms. Their photocatalytic performances are investigated with MB as organic pollutant and ICPQS as reference photocatalyst.
Results and discussion
Structural characterization of ICPQS@GO
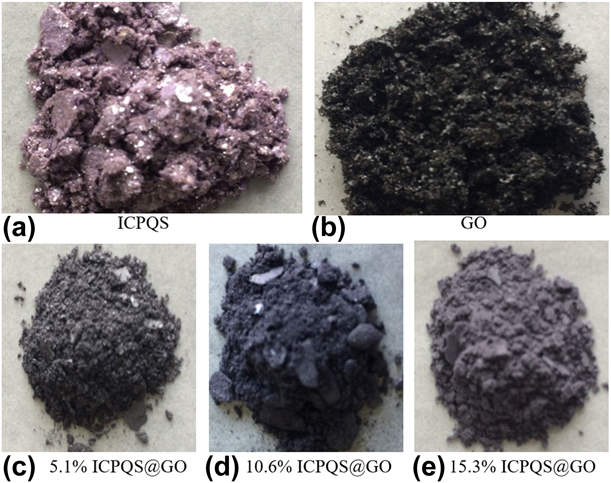
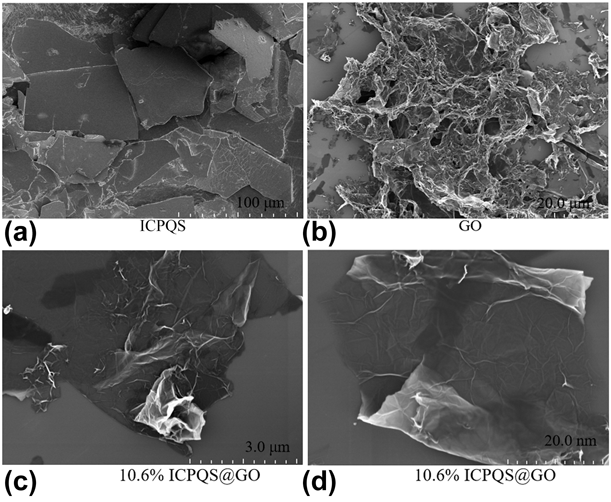
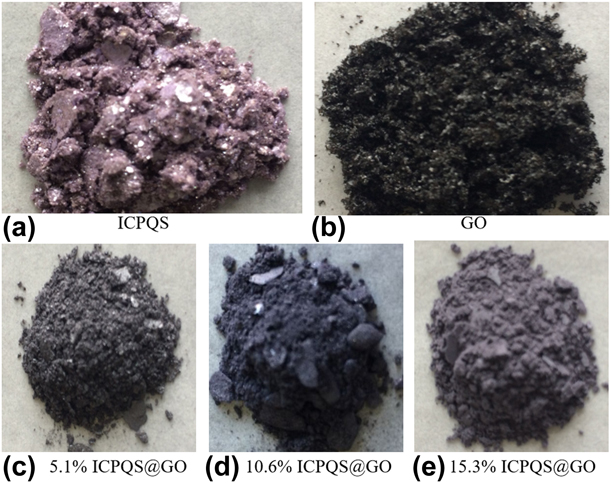
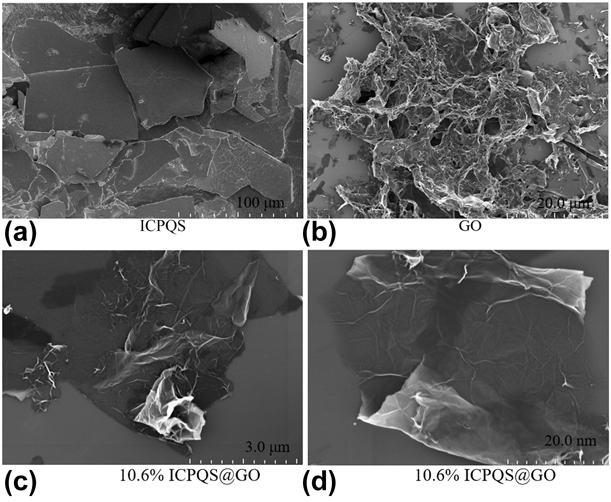
The synthesis of ICPQS@GO composite photocatalysts is based on the addition of a certain amount of GO during the synthesis of ICPQS. Due to the difference in the amount of GO added, the color of the synthesized composite photocatalysts changed significantly (Fig. 1). It can be clearly seen from Fig. 1 that the color of ICPQS is purple, and the color of GO is black. However, the color of 5.1% ICPQS@GO is gray, the color of 10.6% ICPQS@GO is dark blue, and the color of 15.3% ICPQS@GO is light purple. It can be seen that the combination of ICPQS and GO causes a significant change in the color of the composite photocatalysts. SEM can be used to observe the surface information of the material. The previous SEM studies [Reference Li, Feng, Hu, Wei, Wu and Huang38] had shown that both ICPQS and GO are two-dimensional structures (Fig. 2). Although ICPQS@GO composite photocatalysts are formed by adding GO during the synthesis of ICPQS, it can be seen that their morphologies are also two-dimensional structure (Fig. 2). The high-resolution transmission electron microscopy (HRTEM) analysis showed that they also have very thin thicknesses (Fig. S1). These ICPQS@GO composite photocatalysts inherit the morphological properties of the two-dimensional structure of ICPQS and GO. The two-dimensional structure of ICPQS@GO composite photocatalysts makes these photocatalysts exposed to more photocatalytic sites, which is beneficial to increase photocatalytic activity.
The color of (a) ICPQS, (b) GO, and (c)–(e) composite photocatalysts.
The SEM of (a) ICPQS, (b) GO, and (c) and (d) 10.6% ICPQS@GO.
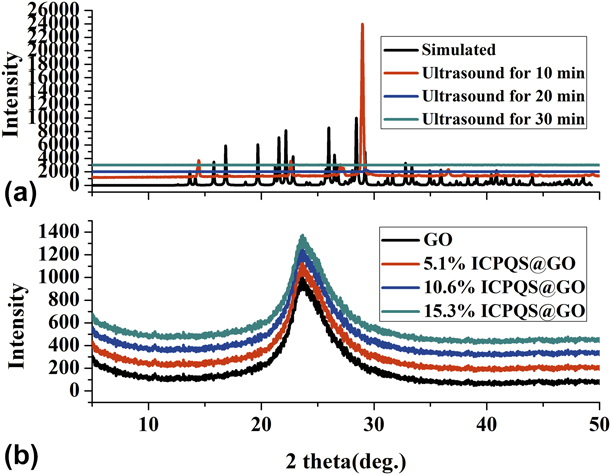
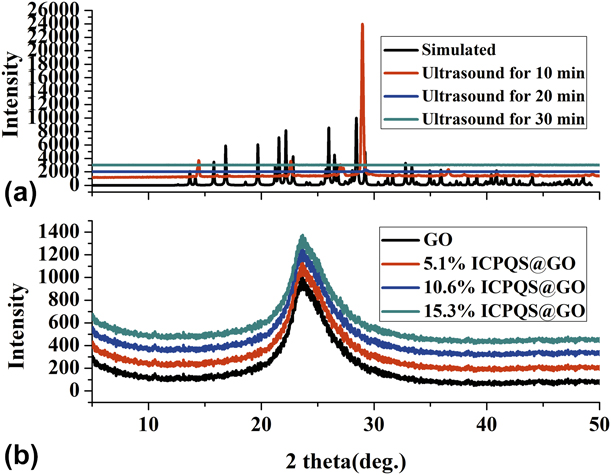
PXRD can be used to analyze the structure of the material. The PXRD test results show that the ICPQS is amorphous phase and it has no diffraction peaks [Fig. 3(a)]. But, the main diffraction peaks of GO and ICPQS@GO are sharper and have higher peak intensity, indicating that the materials prepared in this study have good crystal structure whether single or composite [Fig. 3(b)]. Among them, the PXRD patterns of ICPQS and GO are similar to the theory, and there is no peak, indicating that they are successfully synthesized. It can be seen from Fig. 3(b) that the XRD diffraction peak of GO is at 23.65°. Since the amorphous phase of ICPQS has no PXRD diffraction peak, GO has only one strong diffraction peak. Therefore, the PXRD of the ICPQS@GO composite photocatalysts also has only one strong diffraction peak (the peak at 23.65°). So, the PXRD of ICPQS, GO, and ICPQS@GO composite photocatalysts showed that the composite photocatalysts 5.1% ICPQS@GO, 10.6% ICPQS@GO, and 15.3% ICPQS@GO have the peaks of ICPQS and GO. This indicates that the 5.1% ICPQS@GO, 10.6% ICPQS@GO, 15.3% ICPQS@GO are successfully synthesized.
The PXRD of (a) ICPQS and (b) GO and ICPQS@GO composite photocatalysts.
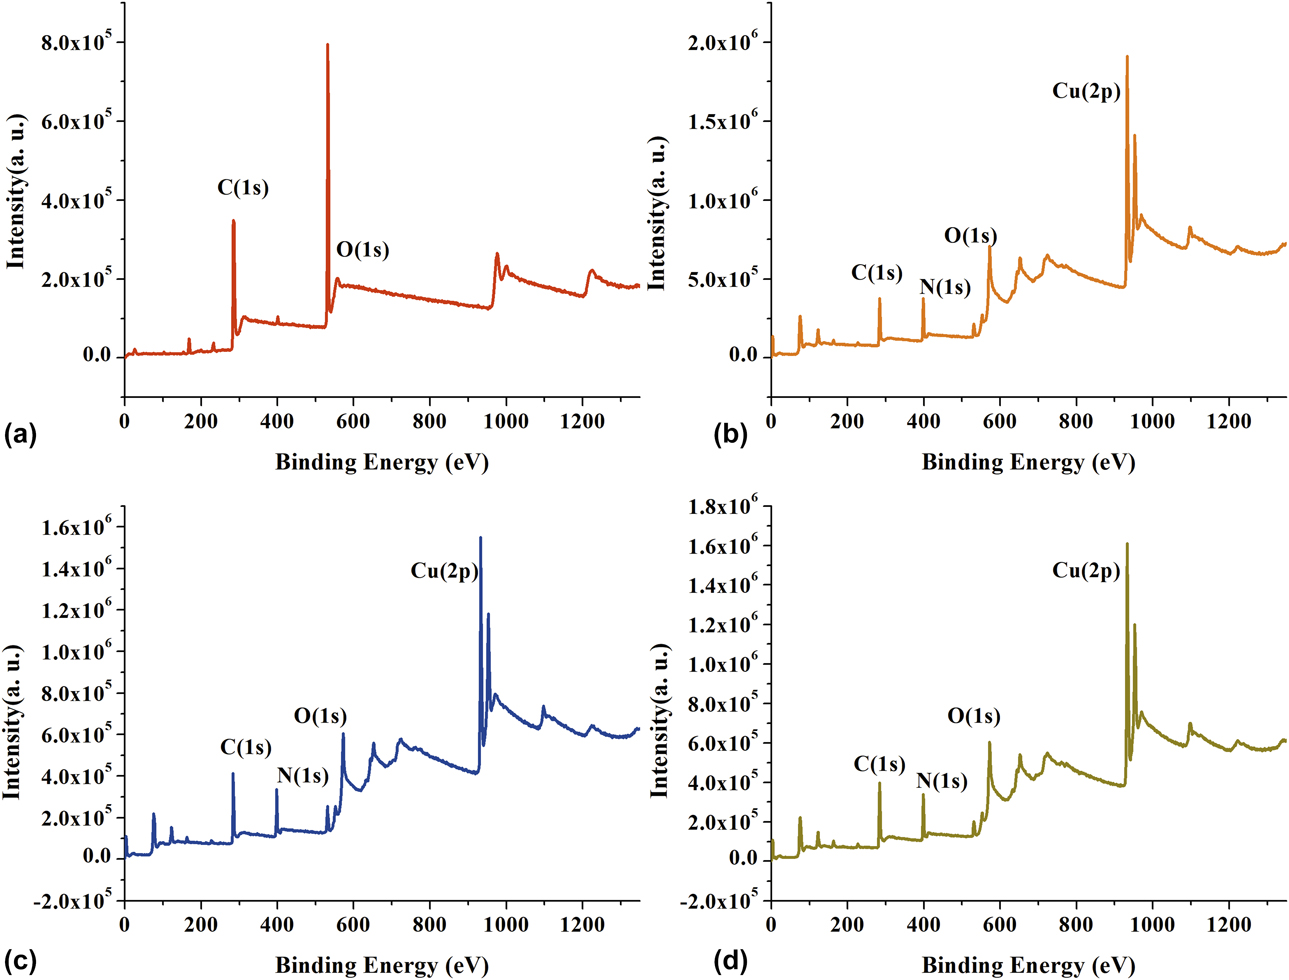
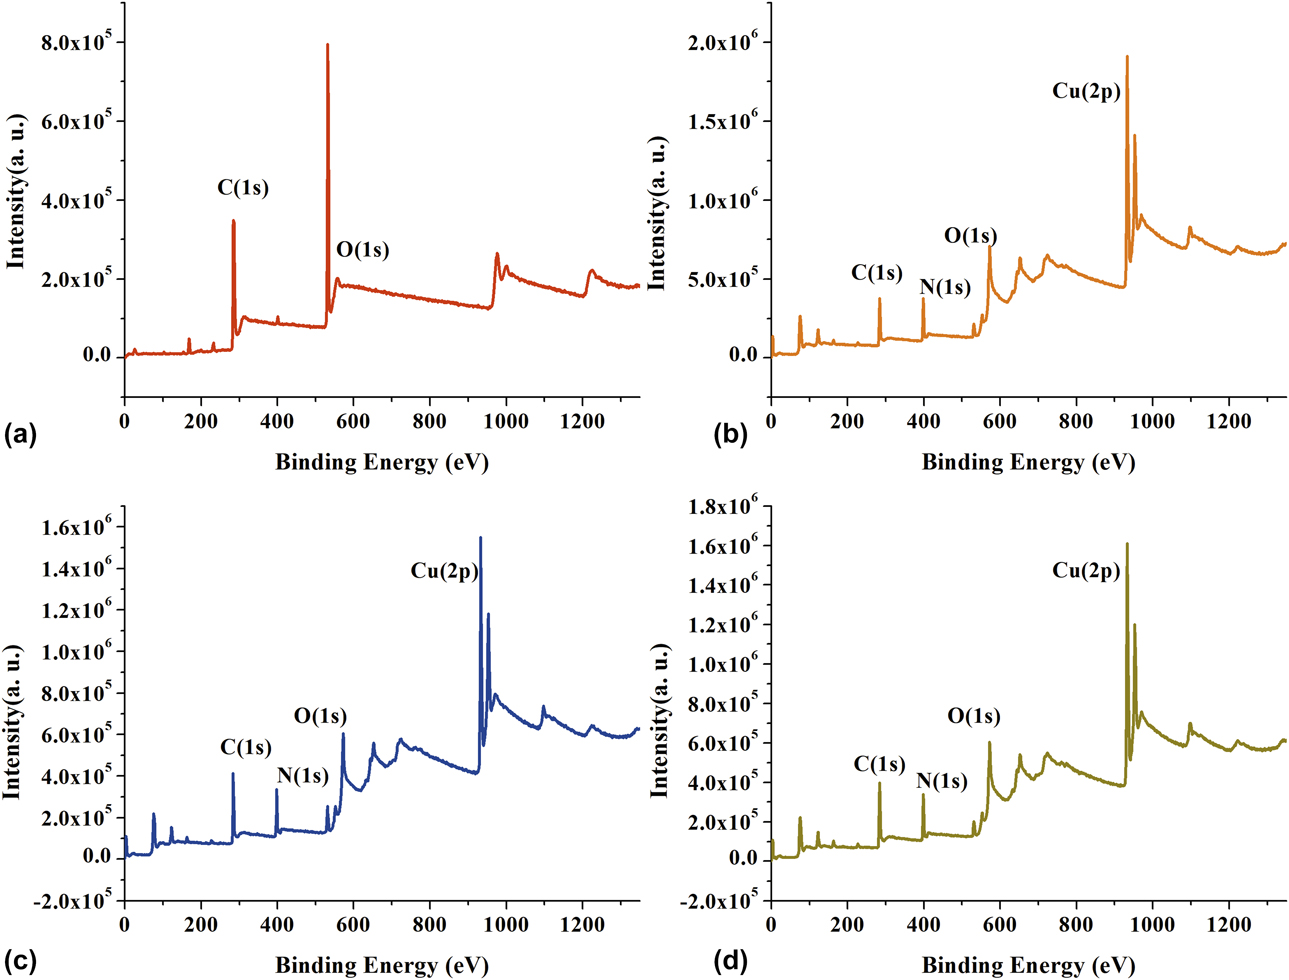
XPS can be used to analyze the composition of materials and the valence of elements. The XPS scan full spectrum of ICPQS (Fig. S2) shows that it consists of C, H, O, and Cu elements. The binding energies are 284.12 eV, 398.01 eV, and 530.75 eV, assigned to C(1s), N(1s), and O(1s), respectively [Fig. S2(b)]. The XPS of core level region of Cu(2p) in ICPQS shows that the Cu(2p 3/2,1/2) peaks are resolved into sets of spin–orbit doublets [Fig. S2(a)]. For Cu(2p 3/2), Cu(I) is characteristic of peak at 932.5 eV (peak I) with no satellite peak and Cu(II) has main peak at 935.1 eV (peak II) with a shakeup satellite (peak III) at higher binding energies. The shakeup satellites are characteristic of materials having a d 9 configuration in the ground state. Peaks IV and V come from Cu(2p 1/2) core. So, the Cu elements are composed of Cu(I) and Cu(II). The XPS analysis showed that GO consists only of C, H, and O elements [Fig. 4(a)]. The binding energies are 284.12 eV, 398.01 eV, and 530.75 eV, assigned to C(1s), N(1s), and O(1s), respectively. The ICPQS@GO composite photocatalysts combine the composition of GO and ICPQS [Figs. 4(b)–4(d)]. They are composed of C, H, O, and Cu elements, and the Cu element in them are also composed of Cu(I) and Cu(II). Therefore, XPS analysis also indirectly indicates that these ICPQS@GO composite photocatalysts have been successfully synthesized.
The XPS of (a) GO, (b) 5.1% ICPQS@GO, (c) 10.6% ICPQS@GO, and (d) 15.3% ICPQS@GO.
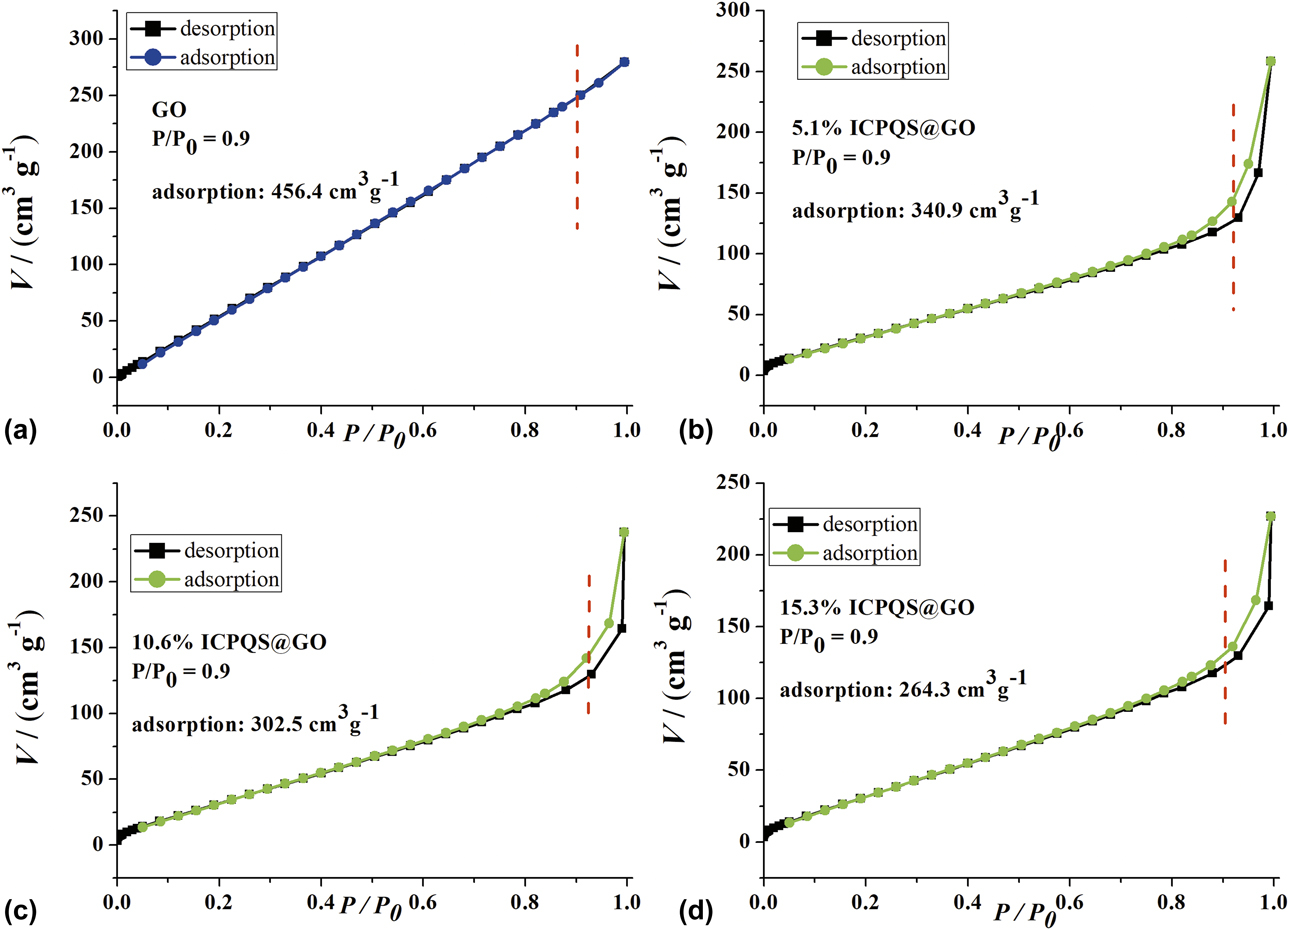
Although SEM, HRTEM, XRD, and XPS indicate that ICPQS@GO composite photocatalysts have been synthesized, it is still necessary to study their specific surface area. The N2 adsorption/desorption experiment showed that the surface area of ICPQS was 132.5 m2/g (Fig. S3). Furthermore, the N2 adsorption/desorption experiment of GO [Fig. 5(a)] shows that its surface area is 456.4 m2/g. However, the N2 adsorption/desorption experiment of composite photocatalysts [Figs. 5(b)–5(d)] shows a significant increase in the specific surface area of ICPQS@GO composite photocatalysts compared with ICPQS. The specific surface areas of 5.1% ICPQS@GO, 10.6% ICPQS@GO, 15.3% ICPQS@GO are 340.9 m2/g, 302.5 m2/g, and 264.3 m2/g, respectively. The specific surface area of ICPQS is only 132.5 m2/g, which is less than 456.4 m2/g of GO [Fig. 5(a)]. The specific surface area of the ICPQS@GO composite photocatalyst is between 132.5 and 456.4 m2/g. These changes in specific surface area are related to the occupancy of ICPQS in ICPQS@GO. The larger the amount of ICPQS, the smaller the specific surface area in the composite photocatalyst of ICPQS@GO. So, these specific surface areas of ICPQS@GO composite photocatalysts also indirectly show that the ICPQS@GO composite photocatalysts are successfully synthesized.
The N2 adsorption/desorption experiment of (a) GO, (b) 5.1% ICPQS@GO, (c) 10.6% ICPQS@GO, and (d) 15.3% ICPQS@GO.

Redox potential
The forbidden bandwidth can be determined by testing the redox potential of the composite photocatalyst. The cyclic voltammetry (CV) curve (Fig. S4) of ICPQS, 5.1% ICPQS@GO, 10.6% ICPQS@GO, and 15.3% ICPQS@GO shows that there is a strong oxidation peak at 0.85, 0.83, 0.81 and 0.82 eV, respectively. In addition, they also have strong reduction peaks, which are −1.61, −1.60, −1.45, and −1.53, respectively. Therefore, the forbidden bandwidth of these composite photocatalysts can be obtained according to the difference between the maximum oxidation peak and the minimum reduction peak (Table SI). As can be seen from Table SI that 10.6% ICPQS@GO has a smaller forbidden bandwidth, which is 2.26. So, the highest occupied molecular (HOMO) = −5.25 eV and lowest unoccupied molecular (LUMO) = −2.99 eV of 10.6% ICPQS@GO can be calculated by the following formula [Reference Li, Wei, Hu, Wu and Li3, Reference Li, Feng, Hu, Wei, Wu and Huang38]: E HOMO/eV = −4.44 − E onset (Ox); E LUMO/eV = −4.44 − E onset (Red). Therefore, these composite photocatalysts are very good photocatalyst, which photocatalytically degrades MB in comparison with ICPQS in solutions of pH 3–9.
Photocatalytic performance
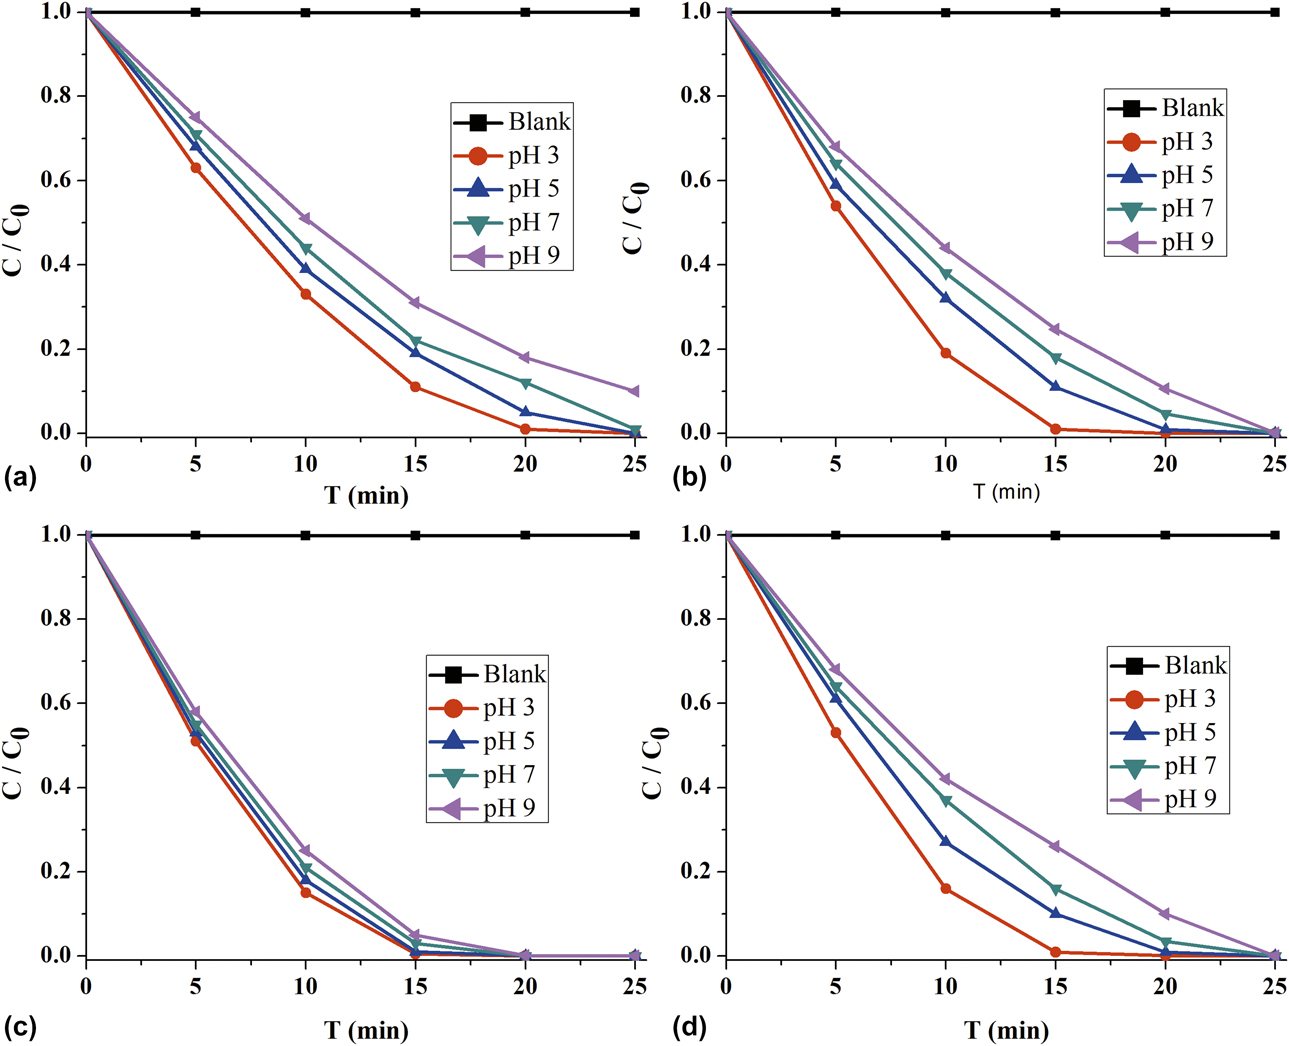
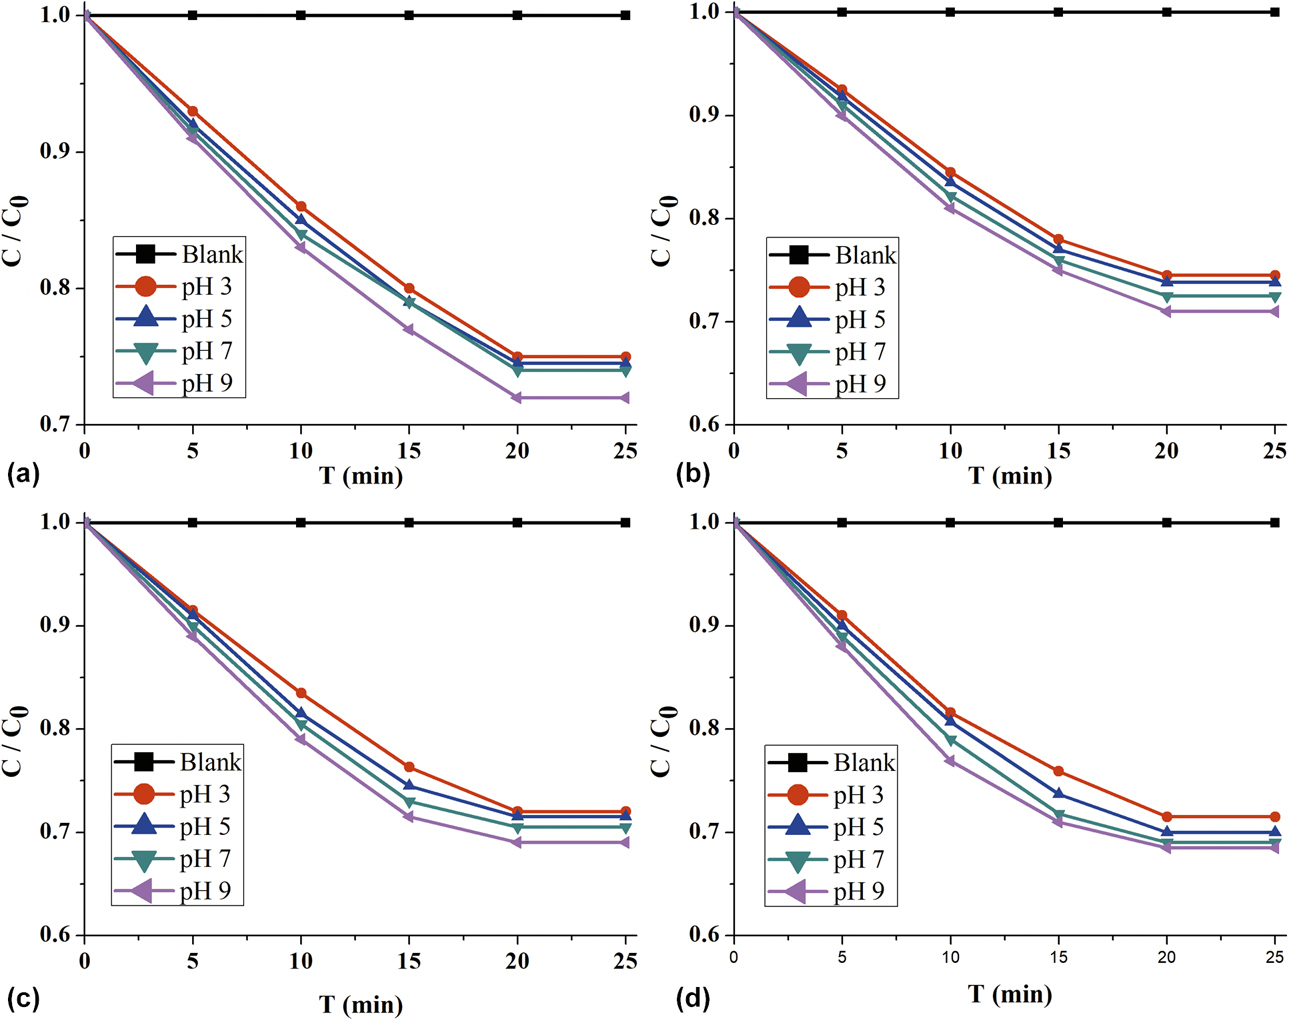
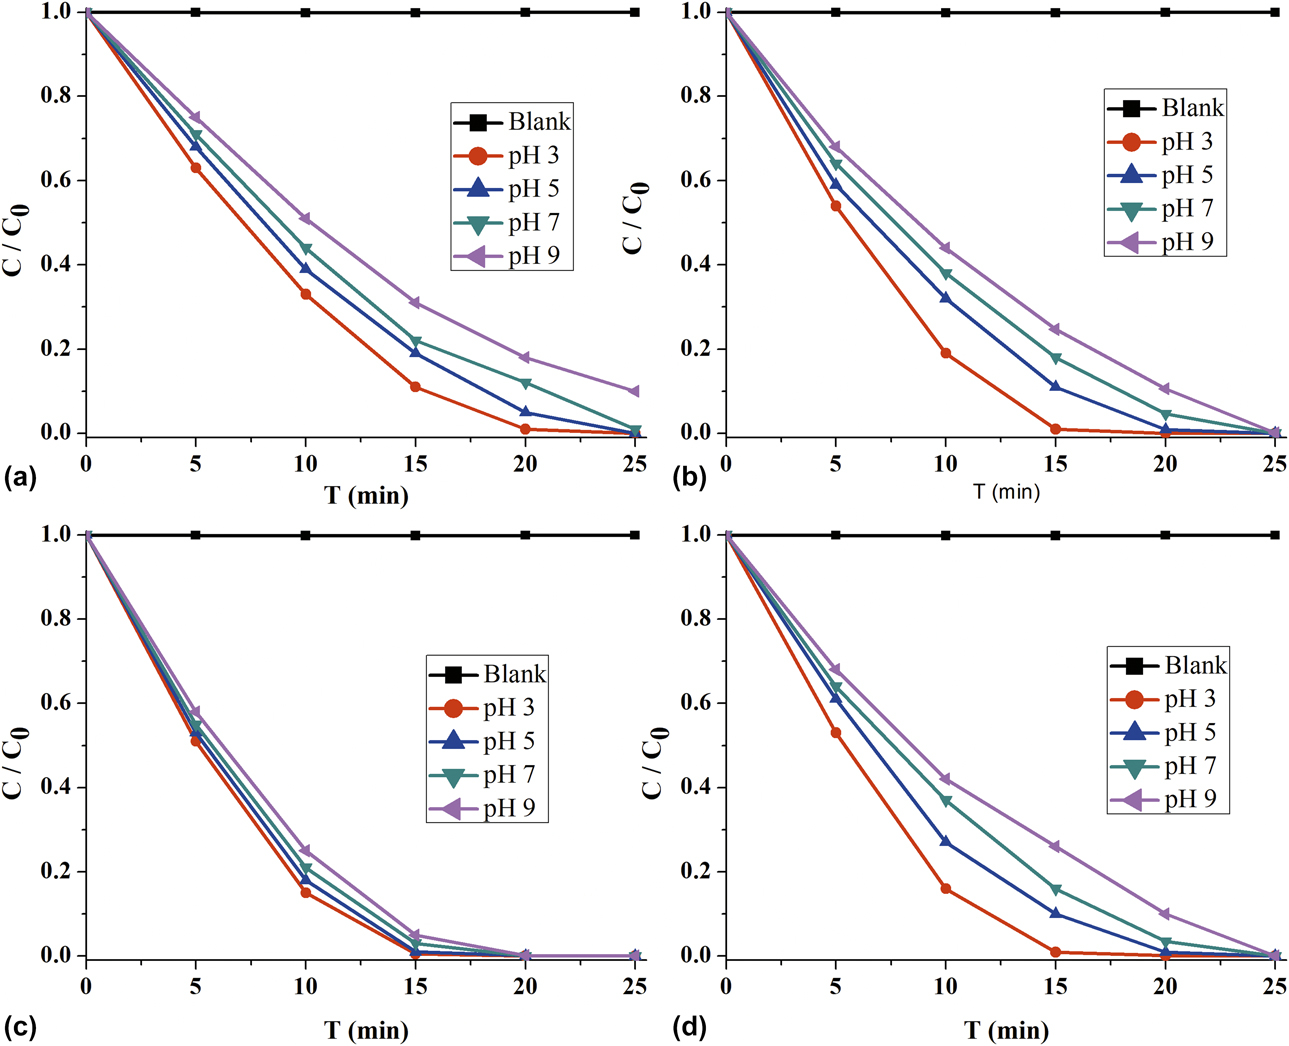
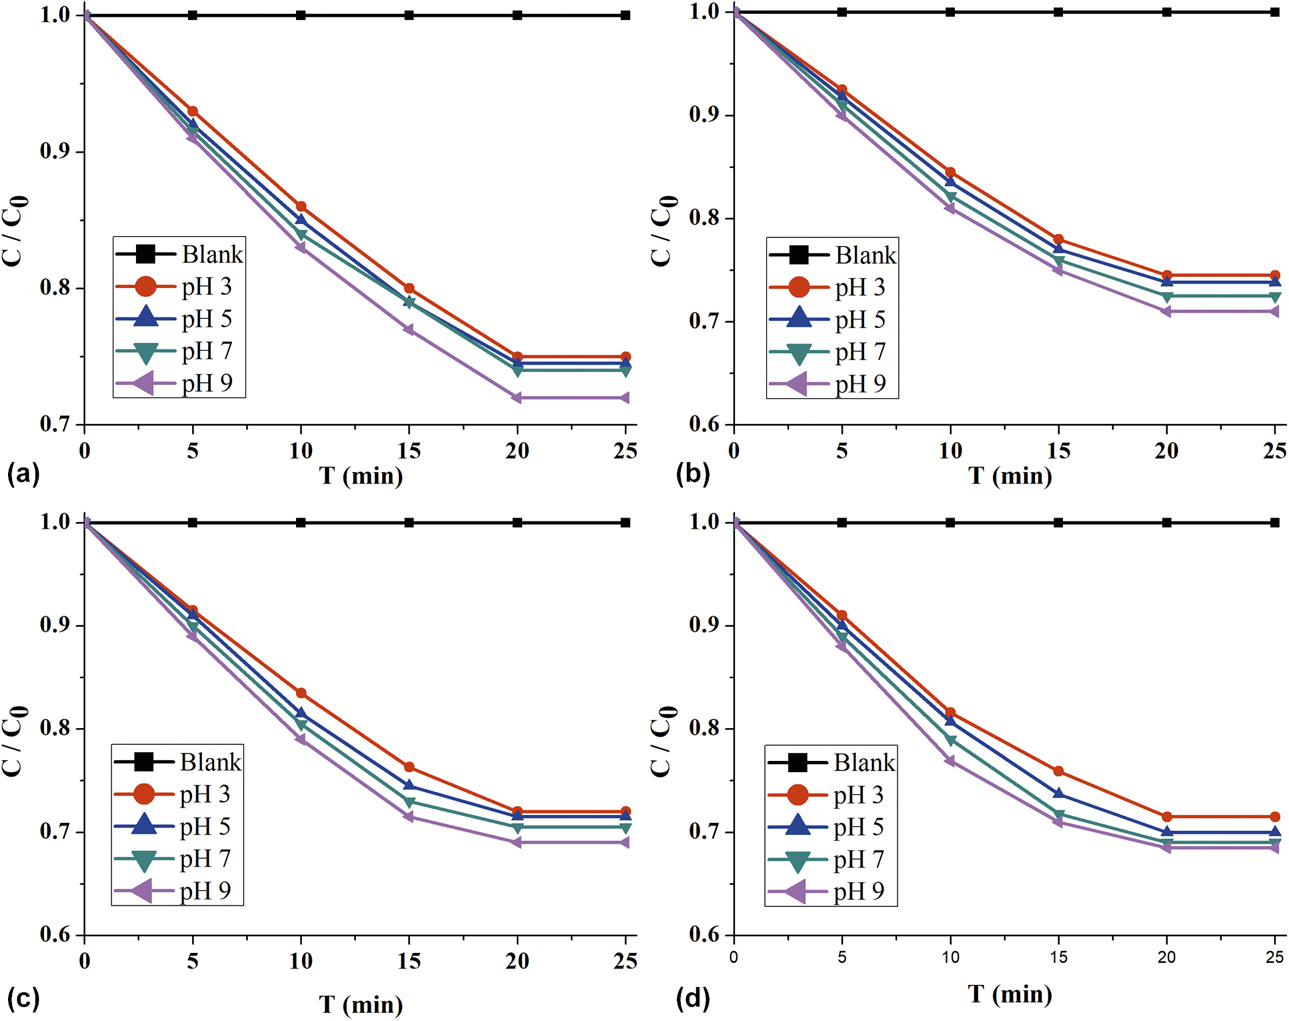
The purpose of this paper is to investigate the photocatalytic properties of the synthesized ICPQS@GO composite photocatalysts. The approximate reaction conditions for photocatalytic degradation have been detailed in the “Photocatalytic experiments” section. The performance of the synthesized ICPQS@GO composite photocatalyst was analyzed using ICPQS as a reference photocatalyst under the same photocatalytic reaction conditions (Fig. 6). It can be clearly seen from Fig. 6 that whether it is ICPQS or a composite photocatalyst, the rate of photocatalytic degradation of MB under acidic conditions is faster than that under alkaline and neutral conditions. The photocatalytic degradation rate of MB by ICPQS at pH 3 can reach 2.5 mg/(L min) [Fig. 6(a)]. This rate is much greater than the rate at which ICPQS adsorbs MB in the absence of light irradiation [Fig. 7(a)]. The performance trend of photocatalytic degradation of MB by ICPQS@GO composite photocatalysts is similar to that by ICPQS [Figs. 6(b)–6(d)]. At pH 3, 50 mL of 50 mg/L MB, can be fully photocatalyzed by 5.1% ICPQS@GO, 10.6% ICPQS@GO, and 15.3% ICPQS@GO in about 17 min, 13 min, and 15 min, respectively. So, the photocatalytic degradation rates of 5.1% ICPQS@GO, 10.6% ICPQS@GO, and 15.3% ICPQS@GO can reach 2.9 mg/(L min) [Fig. 6(b)], 3.3 mg/(L min) [Fig. 6(c)], and 3.1 mg/(L min) [Fig. 6(d)], respectively. However, in the absence of light irradiation, the amount of MB adsorbed by them is only 0.01275, 0.01425, and 0.1535 mg/mg [Figs. 7(b)–7(d)]. These rates of photocatalytic degradation of MB is also greater than the rate at which they adsorb MB. It was found that there is a good linear relationship between ln(C 0/C t) and time (t) when their degradation kinetics was studied, which indicate that the MB photocatalytic degradation reaction conforms to the first-order kinetic reaction (Fig. S5). The rate of 5.1% ICPQS@GO, 10.6% ICPQS@GO, 15.3% ICPQS@GO, and ICPQS at pH 3 is 0.01265, 0.01685, 0.00716, and 0.00438, respectively. It can be seen that the rate of photocatalytic degradation of MB by ICPQS@GO composite photocatalyst is faster than that of ICPQS. Among them, the 10.6% ICPQS@GO composite photocatalyst has the best activity, which is 2.9 times that of ICPQS.
Photocatalytic degradation of MB at pH 3–9 by (a) ICPQS, (b) 5.1% ICPQS@GO, (c) 10.6% ICPQS@GO, and (d) 15.3% ICPQS@GO.
The adsorbed amount of MB at pH 3–9 of (a) ICPQS, (b) 5.1% ICPQS@GO, (c) 10.6% ICPQS@GO, and (d) 15.3% ICPQS@GO.
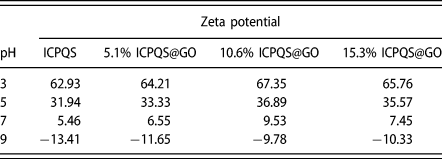
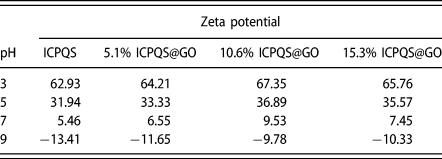
The results of photocatalytic degradation of MB by composite photocatalyst showed that the high-efficiency photocatalytic performance of ICPQS combined with high–specific surface area GO can further improve the photocatalytic performance. This result may be due to the fact that the ICPQS@GO composite photocatalysts has a larger specific surface area (Fig. 5) than the ICPQS, and the Zeta potential (Table I). This is because in the process of photocatalytic degradation of organic pollutants, h+ and e−, which are highly active, are easily recombined, thereby affecting photocatalytic efficiency [Reference Li, Feng, Hu, Wei, Wu and Huang38]. These composite photocatalysts have high specific surface area to facilitate the enrichment of MB, thereby providing favorable conditions for photocatalytic degradation. In addition, ICPQS@GO composite photocatalysts have higher Zeta potential than ICPQS (Table I). The higher zeta potential facilitates the adsorption separation of h+ and e−, which also contributes to the improvement of photocatalytic performance [Reference Yan, Xu, Chai, Wang, Wang and Ren34].
The Zeta potential versus pH of ICPQS and ICPQS@GO composite photocatalysts.
Photocatalytic mechanism
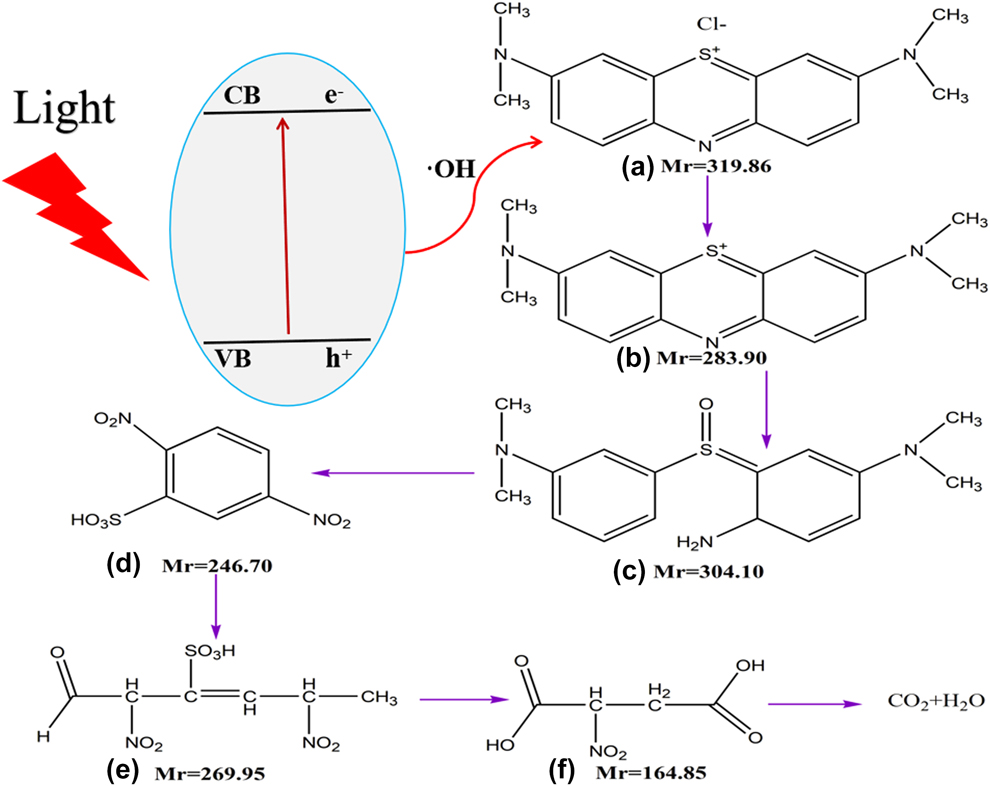
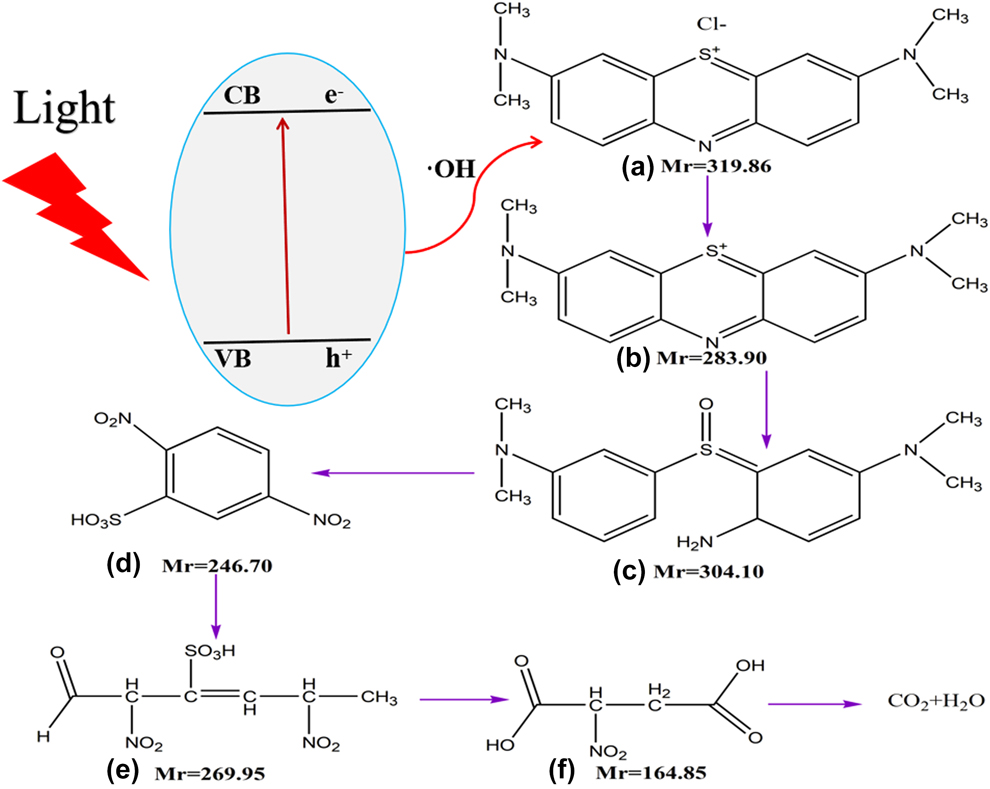
At pH 3, when 10.6% of ICPQS@GO photocatalyzed the MB for 10 min, the photocatalysts was removed by centrifugation and the reaction solution was concentrated in a sample vial. The concentrate was characterized using electrospray ionization mass spectrometry (ESI-MS spectra). The ESI-MS spectra results show that four signals (Fig. S6) attributed to [C16H18N3S]+, [C16H22N3SO]+, [C6H9N2SO8]+, and [C4H6NO6]+ are observed. Therefore, the path of its photocatalytic degradation can be analyzed according to the molecular weight of MB and the ESI-MS spectra results (Fig. 8). It can be seen from Fig. 8 that the decomposition of the MB is performed in multiple steps. The amide bond in the MB is first broken to form amino group; the S atom and the O atom combine to form an S=O bond; the methyl group attached to the N atom is oxidized, resulting in the formation of a small molecule acid. Subsequently, the benzene ring is opened under the attack of electrons to form a small molecule acid formed by six C chains. Then, the six C chains are oxidized to 2-nitrosuccinic acid. Finally, all organic molecules are completely mineralized to CO2 and H2O.
The possible mechanism of photocatalytic degradation of MB by 10.6% ICPQS@GO.
Recycling experiments
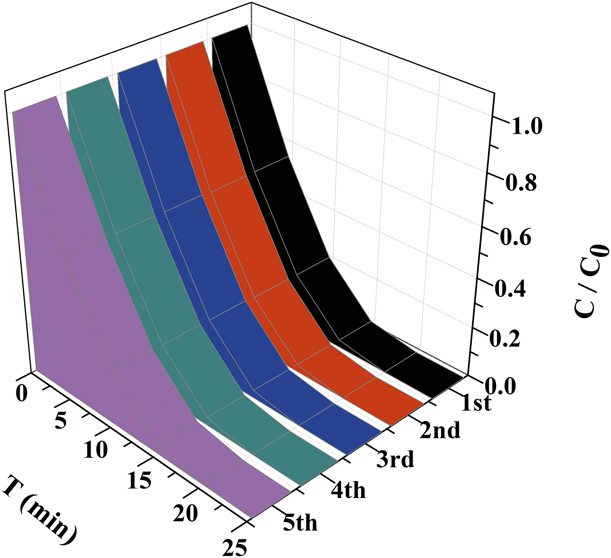
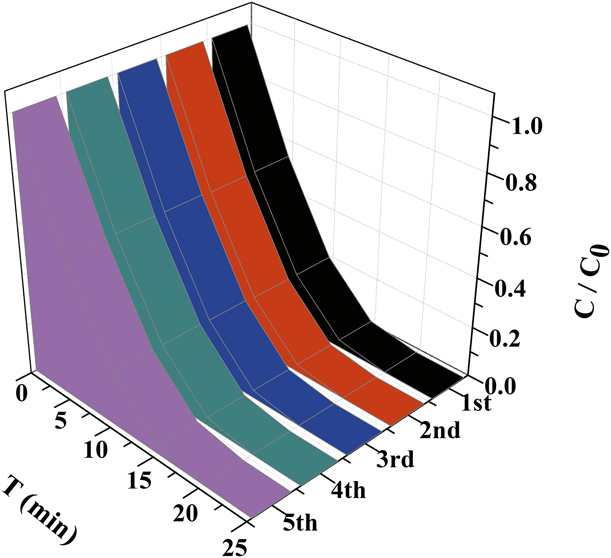
To evaluate the stability of the composite photocatalyst, a photocatalytic degradation of MB experiment was performed on 10.6% ICPQS@GO at pH 7. After one cycle of photocatalytic degradation, its efficiency is still near to 100% (Fig. 9). After five cycles of photocatalytic degradation, its efficiency remained at 98.5%. It can be seen that these composite photocatalysts are very stable and have practical application potential.
Cycle runs of 10.6% ICPQS@GO for the degradation of MB.
Conclusion
A series of ICPQS@GO composite photocatalysts of ICPQS and GO were synthesized. Their structures were characterized by SEM, XRD, XPS, N2 adsorption/desorption isotherms, and atomic absorption spectroscopy. These composite photocatalysts exhibit higher photocatalytic activity than ICPQS in the process of photocatalytic degradation of MB. Among them, the composite photocatalyst 10.6% ICPQS@GO has the highest activity of photocatalytic degradation of MB, which can reach 3.3 mg/(L min) at pH 3. Based on the ESI-MS spectra, the photocatalytic degradation mechanism of MB can be obtained. That is, the amide bond in its structure is first broken and then decomposed into small molecular acids. This method of improving photocatalytic performance by utilizing photocatalysts supported on high specific surface area material provides a direction for the development of highly efficient photocatalyst.
Experimental
Materials
The CuCl2·2H2O, K3[Fe(CN)6], KMnO4, graphite, and MB were purchased from Energy Chemical (Shanghai, China). All solvents and chemicals are commercial reagents and used without further purification. The water used in the experiment is distilled water.
Catalyst preparation
Synthesis of {[CuII(H2O)4][CuI4(CN)6]}n
The synthesis of {[CuII(H2O)4][CuI4(CN)6]}n is according to the prior literature [Reference Yan, Xu, Chai, Wang, Wang and Ren34]. The synthesis method is as follows: a mixture of CuCl2·2H2O (0.085 g, 0.5 mmol), K3[Fe(CN)6] (0.165 g, 0.5 mmol), and 20 mL of water, adjusted the pH to 5 with 1 mol/L NaOH, was prepared and then sealed in a 23-mL Teflon-lined stainless steel autoclave. The mixture was heated in an oven at 150 °C for 72 h and cooled to room temperature and then filtered, and the filtrate was collected in a 50-mL beaker and partially evaporated at room temperature for 2 h, and violet lump crystal were obtained. Yield: 65% (based on copper). Anal. Calcd for C6H8Cu5N6O8: C, 13.19; H, 11.47; N, 15.39. Found: C, 13.20; H, 11.51; N, 15.38. IR(cm−1): 3616m, 3512m, 3339s, 3259s, 3170m, 2107s, 1590s, 1256s, 696s, 443w.
Synthesis of ICPQS
The synthesis of ICPQS is also according to the prior literature [Reference Yan, Xu, Chai, Wang, Wang and Ren34]. Its synthesis process is similar to that of {[CuII(H2O)4][CuI4(CN)6]}n, except that the filtrate was collected in a 50-mL beaker, 2 mL of 50 mg/L sodium dodecylbenzenesulfonate was added, then ultrasound for 30 min and the suspension was collected and centrifuged at 10,000 rpm, the solvent molecule was removed, washed with anhydrous methanol and water three times, and dried in an oven at 80 °C for 8 h, to obtain ICPQS (yield: 42%, based on copper).
Synthesis of GO
The preparation procedure of GO is as follows: 3 g of graphite and a certain amount of KMnO4 were slowly added into a 500-mL flask containing concentrated H2SO4 and H3PO4 with the ratio of 9:1, maintaining the reaction temperature at 35–40 °C with subsequent mixing for 12 h at 50 °C. After cooling to the room temperature, the mixture was gradually dropped into 400 mL ice water, and 15 mL of 30 wt% H2O2 was slowly added to it under vigorous stirring. At the same time, the color of the mixture changed from black to light yellow. The obtained mixture was washed with 30% HCl, ethanol, and deionized water until pH 7 and then the solid was separated by centrifugal separation method. The resulting sample was freeze-dried under vacuum freeze-drying for 48 h.
Synthesis of ICPQS@GO
The specific synthesis process of GO has been described in detail in the Supplementary material. The synthesis of a series of ICPQS@GO composite photocatalysts is similar to that of ICPQS. The different synthetic parts to obtain ICPQS@GO are as follows: the filtrate was collected in a 50-mL beaker, 2 mL of 50 mg/L sodium dodecylbenzenesulfonate and a certain amount of GO (0.1 g, 0.2 g, 0.3 g, 0.4 g, and 0.5 g) were added, then ultrasound for 30 min and the suspension was collected and centrifuged at 10,000 rpm, the solvent molecule was removed, washed with anhydrous methanol and water three times, and dried in an oven at 80 °C for 8 h. The content of Cu(II) in the molecular structure of the composite photocatalysts was measured and analyzed by atomic absorption spectrophotometer. The content of ICPQS in the composite photocatalysts was calculated by Cu(II). They are 5.1% ICPQS@GO, 10.6% ICPQS@GO, and 15.3% ICPQS@GO.
Photocatalytic experiments
The photocatalytic degradation of MB was identical to that reported by other authors [Reference Yan, Xu, Chai, Wang, Wang and Ren34]. The specific experimental steps are as follows: taking photocatalytic degradation of MB as an example, the photocatalytic performance of composite photocatalysts was investigated and compared with that of ICPQS. The reaction conditions were as follows: MB initial concentration C 0 = 50 mg/L, pH 3–9, and dosage 50 mL. Photoirradiation was carried out using a 800 W xenon lamp (Xujiang Electromechanical Plant, Nanjing, China) through UV cutoff filters to completely remove any radiation below 420 nm and to ensure illumination by visible light only; the irradiation intensity was approximately 15.5 W/m2; 250 mL round glass container with circulating water jacket was used; and temperature (T) was 25 °C; The dosage of composite photocatalysts and ICPQS was 50 mg, respectively. The concentration of MB was measured by UV-Vis 2550. The photocatalytic degradation performance was evaluated through the changes in the concentration of MB before and after the reaction. The degradation rate was calculated as follows:
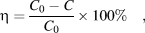 $$\eta = {{{C_0} - C} \over {{C_0}}} \times 100\% \quad ,$$
where η is the degradation rate (%) and C 0 and C are the quality of performance before and after degradation (mg/L), respectively. All adsorption and photocatalytic degradation data are the average of three repeated experiments.
Methodology section
The powder X-ray diffraction (PXRD) was performed using Rigaku’s D/max 2500 X-ray diffractometer (Rigaku, Tokyo, Japan) with Cu Kα radiation (λ = 0.15604 nm); the tube voltage was 40 kV, the tube current was 150 mA, a graphite monochromator was used, and 2θ was 5° to 65°. The morphology was observed by SEM (Hitachi S-4800, East Coast Port, Japan), and the acceleration voltage was 20 kV. The TEM images are taken with a JEOL ARM200F microscope (JEOL, Tokyo, Japan). The XPS measurements were performed on a Kratos Axis Ultra DLD system (Shimadzu, Tokyo, Japan) with a base pressure of 10–9 torr. The electrochemical CV is conducted on a CHI 410B Electrochemical Workstation with Pt disk coated with the polymer film, Pt plate, and Ag/Ag+ electrode as working electrode, counter electrode, and reference electrode, respectively, in 0.100 mol/L tetrabutylammonium hexafluorophosphate (Bu4NPF6) acetonitrile solution. The electrochemical potential is calibrated against Fc/Fc+. Zeta potential analyzer JS94H (Shanghai Zhongchen Digital Equipment Co., Ltd., Shanghai, China) was used to analyze the surface charge of all photocatalytic materials at a certain pH value. The surface area was determined using BET technique; the apparatus (AUTO CHEMII 2920, Micromeritics Instrument Corp, Atlanta, USA) was employed to determine the surface area using N2 as the probe gas. The Cu(II) content in photocatalysts was measured by atomic absorption spectrophotometer (AA-6300C; Shimadzu, Japan). The absorbance of MB was measured at a wavelength of 664 nm using an ultraviolet–visible spectrophotometer (UV-Vis 2550; Shimadzu, Tokyo, Japan). Photoirradiation was carried out using a 800 W xenon lamp through UV cutoff filters to completely remove any radiation below 420 nm and to ensure illumination by visible light only, the irradiation intensity was approximately 15.5 W/m2, as determined by a UV irradiation meter (Model UV-A; Photoelectric Instrument Factory of Beijing Normal University). The MB photocatalytic degradation products were analyzed by ESI-MS (LCQ/AD; Thermo-Finnegan, Los Angeles, USA). The pH in the solution was measured by a pH meter (PHS-25CW-CN; Shanghai Precision Instrument Co., Ltd., Shanghai, China).
Supplementary material
To view supplementary material for this article, please visit https://doi.org/10.1557/jmr.2019.207.
Author contributions
Shi-Xiong Li designed and conceived the experiments; Yan Lu, Qiao-Ling Mo and Xiao-Xia Lai performed the experiments and analyzed the data; Chuan-Song Lin characterized and Yu-Feng Chen analyzed the photocatalytic mechanism of photocatalysts; Bei-Ling Liao tested and analyzed the HRTEM and cyclic voltammetry curves of the composite photocatalyst; Shi-Xiong Li discussed with all authors and wrote the paper alone; all authors participated in the analysis, interpretation, and review of the results and provided input in the writing process of the paper.
Acknowledgments
This work was supported by the National Natural Science Foundation of China (No. 51878290), Guangxi Natural Science Foundation of China (No. 2015GXNSFBA139242); 2014 school-level scientific research project, Wuzhou University (2014B012), Guangxi Colleges and Universities Key Laboratory of Utilization of Microbial and Botanical Resources, Hechi University (2017HL004 and 2017HJA004), and Master’s degree awarded to the project construction fund,.