I. INTRODUCTION
Microwave imaging for biomedical applications has been a topic of extensive research for many years [Reference Meaney, Fanning, Li, Poplack and Paulsen1–Reference Fear, Bourqui, Curtis, Mew, Docktor and Romano4]. In comparison with other technologies, the microwave approach is safe, cheap, and easy to use. It has also been shown to be a promising solution for advanced personalized point-of-care diagnosis and treatment [Reference Persson, Fhager, Trefna, Yu, Mckelvey, Pegenius, Karlsson and Elam5, Reference Ireland and Bialkowski6]. For example, a portable microwave imaging system can be brought to the point of care, enabling pre-hospital diagnostics of diseases and injuries, which could largely eliminate the suffering of affected patients and leads to cost savings.
There has been an increasing research interest in the miniaturization of microwave imaging systems due to the great potential of the technology and the expected economic benefits [Reference Yang and Fathy7–Reference Zeng, Fhager, He, Persson, Linner and Zirath9]. These systems are either built from off-the-shelf components or as custom integrated solutions. In comparison with a frequency domain-based system, such as a vector network analyzer, a time-domain system is more suitable for monolithic integration due to a simpler structure. In addition, a time-domain system can potentially have a much higher measurement speed for ultra-wideband measurements, which makes it very attractive for real time applications.
In the past few decades, pulsed systems have attracted much attention in a variety of civil and military applications [Reference Daniels10]. They make use of very short pulses, which potentially give a high spatial resolution. This intrinsic feature makes it well suited for object tracking and localization. This type of system, however, has a poor signal-to-noise ratio (SNR), therefore it is mainly used for simple applications which have relatively low requirements on measurement accuracy. With the rapid development of microwave circuit technology, the measurement accuracy of pulsed systems has been significantly improved, and this makes them become attractive even for complicated applications, such as indoor tracking and biomedical imaging [Reference Yang and Fathy7, Reference Zeng, Fhager, He, Persson, Linner and Zirath9, Reference Santorelli, Chudzik, Kirshin, Porter, Lujambio, Arnedo, Popovic and Schwartz11].
Recently, another type of time-domain system, the pseudo-random noise (PN) sequence system, which is conventionally used in communication systems, has been investigated for microwave detections [Reference Helbig, Dahlke, Hilger, Kmec and Sachs12]. It was claimed that a PN sequence system is advantageous over a pulsed system due to a higher average power for the same input level [Reference Saches, Peyerl and Zetik13]. The validity of the statement however is based on the assumption that the effect of noise is the same for both systems. Our previous studies have shown that there are different types of error sources in a time domain microwave system, which affect the measurement accuracy in different ways [Reference Zeng, Fhager, Linner, Persson and Zirath14].
In order to develop a deep understanding of both systems, this paper gives a comprehensive comparison between a pulsed system and a PN sequence system. The measurement accuracy of these two systems is investigated and compared by means of simulations and measurements. The advantages and drawbacks of both systems for microwave detection are analyzed and discussed.
II. STIMULUS SIGNALS
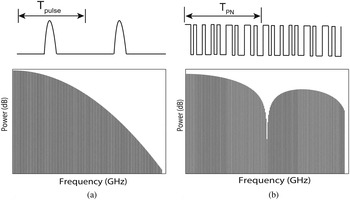
The two microwave diagnostic systems under investigation use different types of stimulus signals. The pulsed system generates a pulse train, which usually has a very low duty cycle. The responses of objects located at different positions can thus be easily distinguished. In contrast to the pulsed system, a PN sequence system sends out a periodic, deterministic noise-type signal, which has a duty cycle of 100%. This type of signal is very useful for digital communication testing. Figure 1 shows the waveforms and the frequency spectra of the stimulus signals in the pulsed system and the PN sequence system, respectively.
The waveforms and frequency spectra of the stimulus signals in the pulsed system (left) and the PN sequence system (right).

For both systems, the stimulus signal x(t) can be mathematically represented as the convolution of a single period signal s(t) and the periodic Dirac delta function with the repetition rate of f r :
 $$x(t) = s(t)\,\ast\sum\limits_{n = - \infty} ^\infty \delta \left( {t - \displaystyle{n \over {{f_r}}}} \right).$$
If the generated pulse is a Gaussian-shaped signal, the Fourier transform of a one volt peak-to-peak Gaussian pulse train can be expressed as follows:
 $${X_{pulse}}(\,f) = \sigma \sqrt {2\pi} \,{f_r}\exp [ - 2(\sigma \pi \,f{)^2}] \cdot \sum\limits_{n = - \infty} ^\infty \delta (\,f - n{f_r}),$$
where σ is the standard deviation of the Gaussian pulse and is related to the full-width at half maximum (FWHM) of the peak according to
 $\sigma = {\rm FWHM}/(2\sqrt {2{\rm ln}2} )$
. The bandwidth of the pulse is determined by the FWHM of the signal.
The stimulus signal used in the PN sequence system is the maximal-length pseudo-random binary sequence (M-sequence). The sequence is generated using maximum linear feedback shift registers. The output sequence is periodic and the repetition rate of an M-sequence generated by an m bit linear feedback shifter register is f r = f t /(2 m − 1), where f t is the triggering clock of the M-sequence generator. The stimulus signal x(t) is a repeating sequence of random bits where each bit is mapped to a specific voltage level, as shown in Fig. 1.
The Fourier transform of the PN sequence becomes:
 $$X_{PN}(f) = \displaystyle{1 \over {{2^m} - 1}}{\rm sinc} \left[ {\displaystyle{f \over {{{(2}^m} - 1){f_r}}}} \right] \cdot \sum\limits_{n = - \infty} ^\infty {A_n}\delta (f - n{f_r}),$$
where A n is the discrete Fourier transform of the M-sequence a n . The PN sequence has a sinc2 shape power spectrum and the zero-crossing points of the spectrum occur at integer multiples of the triggering frequency. Approximately 80% of the signal power is concentrated within half of the triggering frequency, which is consequently defined as the bandwidth.
The average power of these two different types of signals can be calculated as:
 $${P_{pulse}} = 2\pi {(\sigma {\,f_r})^2}\sum\limits_{n = - \infty} ^\infty \exp [ - {(2\sigma \pi n{f_r})^2}].$$
 $${P_{PN}} = {\left( {\displaystyle{1 \over {{2^m} - 1}}} \right)^2}\sum\limits_{n = - \infty }^\infty {\left\vert {{A_n}{\rm sinc}\left( {\displaystyle{n \over {{2^m} - 1}}} \right)} \right\vert^2}. $$
The above equations show that the average power of the pulse train is a function of the repetition rate f r , while that of the PN sequence is independent of the repetition rate.
III. NOISE MODEL AND PERFORMANCE METRICS
There are different types of error sources in a microwave measurement system. In this study, we only deal with random errors as non-random errors can be eliminated by means of compensation and calibration [Reference Gans15]. Random noise present in a microwave measurement system can in principle be classified as voltage noise and timing noise (jitter).
The same noise model can be used for both the pulsed system and the PN sequence system:
 $${y_j} = x({t_j} + {\tau}_j) + {\varepsilon}_j.$$
Here y j is the jth sample of a measured signal y(t), x(t) is the true voltage signal, t j is the ideal sampling instant of the jth sample, τ j is the random time jitter, and ε j represents the total voltage noise, which includes both thermal noise and quantization noise.
The measurement accuracy due to random errors is usually indicated by two parameters: dynamic range (DR) and SNR. These two parameters are closely related and are well defined in a narrow band (continuous wave) microwave system:
 $$DR{\rm [dB]} = 20\mathop {\,\log} \nolimits_{10} \displaystyle{{{V_{FS}}} \over {{\sigma _n}}},$$
 $$SNR{\rm [dB]} = 20\mathop {\,\log} \nolimits_{10} \displaystyle{{{V_{rms}}} \over {{\sigma _n}}},$$
where V FS is the full-scale input of the measurement system, V rms is the root-mean-square (RMS) amplitude of the input signal, and σ n is the voltage deviation of noise.
In a wideband system, the SNR may be defined in a different way depending on the application. For the applications of interest, e.g medical diagnostics, the received signal would be very different from the transmitted waveform due to the complicated antenna and propagation effects. A decision cannot be simply made just based on the peak or average signal power. Instead, the object responses at multiple frequencies are utilized to enable a diagnosis, and the measurement accuracy of all the frequency components could play a role in the detection [Reference Fhager, Hashemzadeh and Persson3, Reference Persson, Fhager, Trefna, Yu, Mckelvey, Pegenius, Karlsson and Elam5]. Therefore, the measurement accuracy is evaluated by the SNR defined in the frequency domain:
 $$SNR(f) = 20\,\mathop {\log} \nolimits_{10} \displaystyle{{Y(f)} \over {\sigma \,(f)}}.$$
Here Y(f) and σ(f) stand for the signal and noise magnitudes of each frequency bin. This definition is very useful when evaluating the measurement accuracy of a time domain system with reference to a frequency domain-based system (e.g. VNA).
IV. RESULTS
Simulations were performed in order to investigate the systems’ behavior under different noisy conditions. A specific measurement test was carried out in order to verify the simulation results.
A) Simulation
The effects of timing jitter and voltage noise in the pulsed and the PN sequence systems were investigated firstly by means of a simulation.
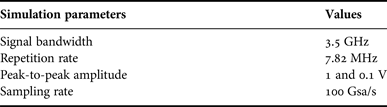
Matlab-based system-level simulations were performed, and in the simulation model, the generated waveforms were directly measured with a wideband receiver. To make a fair comparison, the stimulus signals in these two systems have the same bandwidth, the same repetition rate, the same peak-to-peak amplitude and were sampled at the same rate, as listed in Table 1. The frequency band of interest for medical diagnostics is from a few hundred megahertz up to 3–4 GHz, we therefore considered signals with a 3 dB bandwidth of about 3.5 GHz for both systems. The measurement unit was modeled as a low-pass filter with a cut-off frequency of 4 GHz.
List of simulation parameters.

In the simulation, random noise was added to the measured signal, and the sampling process of the measured signal was modeled with the consideration of a certain jitter. The signals obtained from several repetitive simulations were Fourier transformed. Then the mean and standard deviation of the amplitude spectrum were calculated in order to obtain the SNR as defined in equation (9). The simulated jitter and additive noise were independent zero-mean random variables with normal distributions. Different levels of timing jitter and voltage noise were considered.
The total jitter of a time-domain system is composed of three parts: generator jitter, receiver jitter, and clock jitter. The jitter of high-performance generators is usually between 1 and 2 ps [16, 17], and this level can be further reduced to sub-picoseconds with careful design [18]. A commercial measurement unit (receiver) has a jitter of <1 ps [19]. The clock jitter can vary from a few sub-picoseconds to picoseconds depending on the specific clock design. We therefore set the jitter level to be in the range from 0.5 to 4 ps in order to evaluate the SNR in terms of jitter. The choice of the voltage noise was also made in a similar way with reference to the current technological limitations and the performance parameters of available hardware.
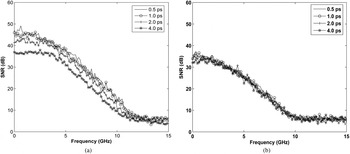
The effect of timing jitter was firstly investigated, and four different jitter levels were considered. Figure 2 shows the obtained SNRs for different jitter levels. It can be seen that the resulting SNRs for both systems have very small differences (less than a few dBs) in the frequency range of interest. Since the signal power density of the PN sequence is higher than that of the pulse when these two signals have the same amplitude, this result indicates that the jitter resulted noise is larger for the PN sequence system. This is attributed to the high slew rate of the PN sequence in a larger portion of the period in comparison with the pulse train.
SNRs due to timing jitter obtained in (a) the PN sequence system and (b) the pulsed system when voltage noise was not considered.

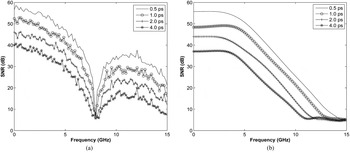
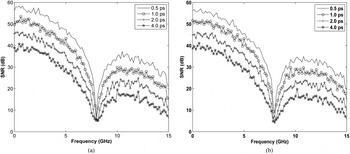
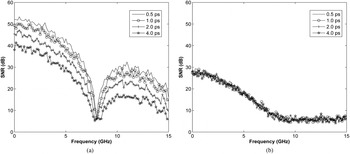
We then studied a more realistic case when both timing jitter and voltage noise were present. Two different voltage noise levels, 0.5 and 2.0 mV rms, were considered. These two cases could be defined as a good case and a poor case from the system performance point of view. The obtained SNRs under different conditions were plotted in Figs 3 and 4 for the PN sequence system and the pulsed system, respectively. It can be seen that the SNRs of the PN sequence system have little change as the voltage noise increases. In contrast, the pulsed system's SNR changes significantly when the voltage noise level varies. These results suggest that the performance of the PN sequence system is mainly affected by the timing jitter while the pulsed system's error source is dominated by the voltage noise.
SNRs of the PN sequence system due to different levels of timing jitter when the voltage noise is (a) 0.5 mV rms and (b) 2 mV rms.

SNRs of the pulsed system due to different levels of timing jitter when the voltage noise is (a) 0.5 mV rms and (b) 2 mV rms.

The above results were the investigations of a full-scale input signal. In a typical medical diagnostic system, an antenna array is involved and signals acquired by different antennas vary significantly in strength. To make a more comprehensive evaluation of the system performance, a weaker signal was studied.
Figure 5 gives the SNRs of a PN sequence and a pulse with an amplitude of −20 dBFS (dB full-scale). The voltage noise considered in the investigation is 0.5 mV rms, and different jitter levels were considered.
SNRs of the −20 dBFS signals in (a) the PN sequence system and (b) the pulsed system when the voltage noise is 0.5 mV rms.

By comparing Fig. 5(a) with Fig. 3(a), we can see a distinct SNR difference for the PN sequence system when the timing jitter is 0.5 ps, but as the jitter increases, the SNR difference between these two figures becomes insignificant. This is because when the timing jitter is very small (i.e. 0.5 ps), the system noise is dominated by the voltage noise which is constant and independent of the tested signal. Therefore, the weaker signal was measured with a lower SNR. However, as the jitter increases, the jitter resulted noise becomes the dominant component in the PN sequence system, and this component is proportional to the signal's intensity. As the signal becomes weaker, the jitter resulted noise decreases correspondingly, which consequently results in a nearly unchanged SNR. This is more evident as the ratio of the jitter resulted noise to other noise components becomes larger. In contrast with this, the SNRs in Fig. 5(b) are much lower than those in Fig. 4(a) for all considered jitter levels. This is because the jitter-resulted noise in the pulsed system is very small in comparison with the voltage noise, which results in a lower SNR for the smaller signal. These results suggest that the measurement accuracy of the PN sequence system is less sensitive to the signal's intensity than that of the pulsed system in the presence of timing jitter.
B) Measurement
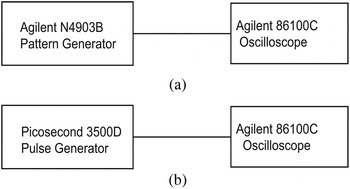
A measurement test was performed in order to support the simulation studies. Measurements were carried out using laboratory instruments and the measurement setup is consistent with the simulation model, as shown in Fig. 6.
The measurement setup of (a) the PN sequence system and (b) the pulsed system.

A picosecond pulse generator 3500D was used to send out the pulse train and the generated Gaussian pulse has a FWHM duration of about 75 ps, which correspondingly has a bandwidth of about 4.2 GHz. An Agilent pattern generator was employed to produce a PN sequence. The pattern generator was triggered at 8 GHz and the generated PN sequence has a length of 1023 (210–1) chips. According to the intrinsic feature of the PN sequence's power spectrum, the bandwidth of the PN sequence is 4 GHz.
Both signals were measured several times with Agilent 86100C digitizing oscilloscope mainframe plus a 70 GHz bandwidth sampling module 86118A. An equivalent time sampling technique is employed in the oscilloscope in order to extend the effective sampling rate. The input DR of the sampling oscilloscope is ±400 mV. The repetition clock outputs of the generators were fed to the sampling oscilloscope in order to trigger measurements. The repetition rate of the pulse and the PN sequence were 1 and 7.82 MHz, respectively. To make a fair comparison, the results of the pulsed system were adjusted with the consideration of having the same repetition rate and sampling rate as the PN sequence system.
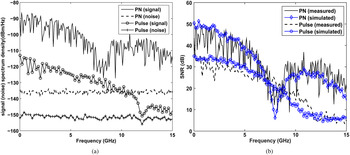
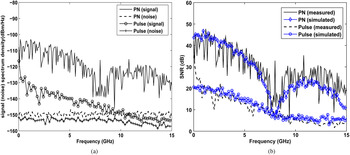
Two different signal levels were investigated. Figure 7(a) shows the signal and noise power spectra of the PN sequence system and the pulsed system when the measured signal has a peak-to-peak amplitude of 600 mV. Figure 7(b) plots the SNRs for both systems. It can be seen that the PN sequence has a much higher signal power spectrum density than the pulse, but the noise present in the PN sequence system was also larger due to the stronger effect of the timing jitter. This results in just a few dBs SNR difference between these two systems.
The systems’ (a) signal and noise spectra and (b) SNRs when the test signal is 600 mV peak-to-peak.

When the measured signal has peak-to-peak amplitude of 100 mV, the results shown in Fig. 8 were obtained. By comparing Figs 8(a) and 7(a), one can see that the noise present in the PN sequence system has decreased significantly. This is because the jitter resulted noise becomes smaller as the signal intensity decreases, and in this case it is comparable with the voltage noise, which results in the noise power spectrum densities of these systems to be similar. Consequently, the resulting SNRs are much higher for the PN sequence system than for the pulsed system.
The systems’ (a) signal and noise spectra and (b) SNRs when the test signal is 100 mV peak-to-peak.

The simulated SNRs of these two experimental systems were also plotted in Figs 7(b) and 8(b) in comparison with the measurement results. The same repetition rate and sampling rate as for the experimental study were used in the simulations. It can be seen that the simulated and measured SNRs agree well for both systems, and this agreement verifies the effectiveness of the simulation study.
V. DISCUSSION
The above investigations provided a better understanding of the difference in noise behavior in these two systems. When the timing jitter is within a few picoseconds, the dominant error source in the pulsed system is the voltage noise. Therefore, a weaker signal was measured with poorer accuracy using the pulsed system. In comparison with the pulsed system, the PN sequence system is dominated by the jitter-resulted noise, which makes the SNR remain almost unchanged as the measured signal decreases in amplitude. As the measured signal decreases further, the change in SNR is dependent on the ratio between the voltage noise and the jitter resulted noise, which are further determined by the measured signal's slew rate, the timing jitter level and the magnitude of the voltage noise.
In summary, a PN sequence system has a higher DR than a pulsed system if the voltage noise levels of these two systems are comparable. A weak signal can be measured with higher accuracy by using the PN sequence system compared with the pulsed system. A variable gain control strategy is usually employed in practical applications in order to tune the measured signal to a specific range. In this case, the measurement accuracy of the pulsed system is less dependent on the measured signal's amplitude, and the difference between these two systems becomes smaller.
In addition, the SNR difference between these two systems is dependent on the signal's repetition rate according to equation (5). As the repetition rate increases, the SNR of the pulsed system increases, which consequently results in a smaller difference between these two systems. The repetition rate is the frequency resolution in the frequency spectrum, which consequently determines the number of data points in the frequency range of interest. For some of the applications, this number is not a critical performance parameter, and then a higher repetition rate should be used in the pulsed system in order to gain higher measurement accuracy.
These results provide useful information for choosing an appropriate system for a specific application. Pulsed systems have the function of range-gating, and perturbing signals can easily be gated out due to the ultra-short duration of the pulses. The system is suitable for applications, which only requires a simple interpretation of the data and that has relatively low requirements on the measurement accuracy. It is also a good choice for applications in which measured signals have small variations. The PN sequence system is advantageous for complicated applications in which the measured signals’ amplitude varies significantly and high measurement accuracy is required.
VI. CONCLUSION
A comprehensive study on the noise performance of two different types of time-domain systems was performed. Both the simulation and measurement results suggest that the timing jitter has a much stronger effect on the measurement accuracy of the PN sequence system than the pulsed system.
In the case of low-voltage noise (<0.5 mV) but high timing jitter (>2.0 ps) in the system, the pulsed system can achieve the same level of measurement accuracy as the PN sequence system in the frequency range of interest. Since timing jitter plays a very important role in determining the measurement accuracy of a PN sequence system, the system needs to be carefully designed with a low timing jitter in order to realize the full performance benefit of a PN sequence system.
ACKNOWLEDGEMENTS
This work was supported by the Swedish Agency for Innovation Systems within the Chalmers Antenna Systems VINN Excellence Centre.
 Xuezhi Zeng received the Ph.D. degree in electric engineering from the Chalmers University of Technology, Götborg, Sweden, in 2013. She is currently a Post-Doctoral Fellow with the Biomedical Electromagnetics Group at the Chalmers University of Technology. Her main research interests include microwave system design and development, experimental measurement, and evaluation of microwave systems for medical and other emerging applications.
 Albert Monteith was born in 1990 in Pretoria, South Africa. He received the M.Sc. degree in Biomedical Engineering from Chalmers University of Technology, Gothenburg, Sweden, in 2015, where he is currently working toward the Ph.D. degree at the Department of Earth and Space Sciences. His main research interests include microwave system design, measurements, and imaging of living objects.
 Andreas Fhager received the M.Sc. degree in Engineering Physics and the Ph.D. degree in Electrical Engineering from Chalmers University of Technology, Göteborg, Sweden, in 2001 and 2006, respectively. Currently he is an Associate Professor and the Head of the Biomedical Electromagnetics Research Group at the Department of Signals and Systems, Chalmers University of Technology. His research interests include signal processing, algorithm and systems development for microwave tomography, and imaging intended for medical diagnosis and treatment applications.
 Mikael Persson received the M.Sc. and Ph.D. degrees from Chalmers University of Technology, Göteborg, Sweden, in 1982 and 1987, respectively. In 2000, he became a Professor in Electromagnetics and in 2006 a Professor in Biomedical Electromagnetics at the Department of Signal and Systems, Chalmers University of Technology. Since 2010, he has been the Head of the Division of Signal Processing and Biomedical Engineering, Chalmers University of Technology. His main research interests include electromagnetic diagnostics, monitoring and treatment, including microwave hyperthermia, stroke diagnostics, EEG source localization, and microwave system design. He is the author/coauthor of more than 200 refereed journal and conference papers.
 Herbert Zirath received the M.Sc. and Ph.D. degrees from Chalmers University of Technology, Göteborg, Sweden, in 1980 and 1986, respectively. Since 1996, he has been a Professor of High-speed Electronics with the Department of Microtechnology and Nanoscience, Department of Micro Technology and Nano Science, Chalmers University of Technology. He became the Head of the Microwave Electronics Laboratory in 2001. His main research interests include foundry-related monolithic microwave-integrated circuit designs for millimeter-wave applications and circuits for high-power applications. He is with Ericsson AB part-time as a Microwave Circuit Expert. He is the author/coauthor of more than 300 refereed journal/conference papers and holds four patents.