Implications
Feed is the greatest expense in milk production. However, monitoring the individual cow’s feed intake is currently only economically feasible under research conditions. Existing nutrition models to predict feed intake may only fit groupwise. It can be assumed that low-cost feeding-behavior sensors will soon be available for commercial use in many farms. The aim of this study was to develop a feed intake model for the individual dairy cow that includes feeding behavior.
Introduction
Feed is the greatest expense in milk production (Buza et al., Reference Buza, Holden, White and Ishler2014). Knowledge of the individual dairy cow’s voluntary dry matter intake (DMI) could contribute to the design of more efficient animal nutrition, at either the group level, summing more accurate predictions of all individual cows concurrently presented in a group (Maltz et al., Reference Maltz, Barbosa, Bueno, Scagion, Kaniyamattam, Greco, De Vries and Santos2013) or the individual cow level. At the latter level, the design of an individualized animal diet is required when computerized concentrate self-feeders either standalone (Livshin et al., Reference Livshin, Maltz and Edan1995) or are built into a milking robot stall (Halachmi, Reference Halachmi2004 and Reference Halachmi, Børsting, Maltz, Edan and Weisbjerg2005; Madsen et al., Reference Madsen, Weisbjerg and Hvelplund2010).However, monitoring the individual cow’s feed intake is currently only feasible under research conditions (Halachmi et al., Reference Halachmi, Edan, Moallem and Maltz1996 and Reference Halachmi, Ofir and Miron1998; Calan, Reference Calan1997; Schwartzkopf-Genswein et al., Reference Schwartzkopf-Genswein, Huisma and McAllister1999; Grant and Albright, Reference Grant and Albright2001; Huisma, Reference Huisma2002; DeVries et al., Reference DeVries, von Keyserlingk, Weary and Beauchemin2003; Bach et al., Reference Bach, Iglesias and Busto2004; Ferris et al., Reference Ferris, Keady, Gordon and Kilpatrick2006; Wang et al., Reference Wang, Nkrumah, Li, Basarab, Goonewardene, Okine, Crews and Moore2006; Chapinal et al., Reference Chapinal, Veira, Weary and von Keyserlingk2007; Mendes et al., Reference Mendes, Carstens, Tedeschi, Pinchak and Friend2011; Krawczel et al., Reference Krawczel, Klaiber, Thibeau and Dann2012). Therefore, several nutrition models have been developed to predict feed intake, but even the best models have been unable to account for >70% of the variation in intake (Vandehaar, Reference Vandehaar1998; Shelley, Reference Shelley2013), that is, the existing models may only fit groupwise (Arnerdal, Reference Arnerdal2005). A DMI model at the individual cow level requires further complexity: the few hundred coefficients in the model presented by Halachmi et al. (Reference Halachmi, Edan, Maltz, Peiper, Brukental and Moalem2004) are not accurate enough (Halachmi et al., Reference Halachmi, Edan, Maltz, Peiper, Brukental and Moalem2011).
In addition to supporting the prediction of feed intake, changes in feeding behavior may indicate approach calving and may indicate disease. Gonzalez et al. (Reference Gonzalez, Tolkamp, Coffey, Ferret and Kyriazakis2008) discovered that cows with ketosis and lameness show decreased feed intake, by 10.4 kg and 1.57 kg, respectively. Urton et al. (Reference Urton, von Keyserlingk and Weary2005) claimed that cows with clinical metritis spend 22 min/day less at the feed bank than those without clinical metritis. Early identification of sick cows could minimize disease duration (Urton et al., Reference Urton, von Keyserlingk and Weary2005), improve treatment efficacy and improve animal welfare (Gonzalez et al., Reference Gonzalez, Tolkamp, Coffey, Ferret and Kyriazakis2008), thereby decreasing economic losses (Urton et al., Reference Urton, von Keyserlingk and Weary2005; Gonzalez et al., Reference Gonzalez, Tolkamp, Coffey, Ferret and Kyriazakis2008). Therefore, it can be assumed that low-cost feeding-behavior sensors will soon be available for commercial use in many farms.
Sensors of feeding behavior, that is, time spent in the feeding lane, duration of each meal and frequency of meals throughout the day and night, are under development by a few commercial sensor companies (Halachmi, Reference Halachmi2015). The principal author is familiar with a few Israeli prototype sites from three different companies that are in the last developmental phases in Israel aimed at low-cost monitoring of feeding behavior under commercial farm conditions (Halachmi et al., Reference Halachmi, Tello, Fernández, Hertem, Sibony, Weyl-Feinstein, Verbrugge, Bonneau and Neilson2015). Soon these sensors will be incorporated into the dairy farm markets. There are already quite a few feeding-behavior sensors operating under research conditions (Shelley, Reference Shelley2013).
However, feeding behavior is not the only parameter determining feed intake. A wide range of predictors can potentially affect voluntary feed intake of dairy cows (Ingvartsen, Reference Ingvartsen1994; Kjos, Reference Kjos2002). These include (i) individual animal factors: BW, milk yield (MY), days in milk (DIM), breed, genetics, age, parity, gestation, previous feeding, body condition, fatness, eating velocity, rumen activity, health status, anabolic agents; (ii) food quality: dietary factors, diet composition, chemical composition, digestibility, degradation profiles, physical form, conservation, dry matter (DM) content, fermentation quality, palatability, mineral salts alkaline agents, food additives; (iii) housing and management practices: duration of access to feed, frequency of feeding, separate (‘cafeteria’) v. complete feed (total mixed ration(TMR)), tie stalls v. loose housing or open cowshed, space per animal for lying down, space in the manger, length of feeding lane per animal, photoperiod, temperature, humidity. None of the existing food intake models incorporate individual feeding behavior into the evaluating food intake formula, that is, time feeding, number of meals, etc.
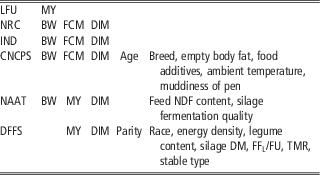
The National Research Council (NRC) predictors (BW, MY and DIM) are frequently applied (Table 1) and were therefore also applied in this study.
Predictors included in several dry matter intake (DMI) models

LFU=feeding recommendations by Lantmännen (Lindgren et al., Reference Lindgren, Murphy and Andersson2001); MY=milk yield; NRC=National Research Council (NRC, 2007); FCM=fat-corrected milk, 4%; DIM=days in milking; IND=model proposed by Halachmi et al. (Reference Halachmi, Edan, Maltz, Peiper, Brukental and Moalem2004 and Reference Halachmi, Edan, Maltz, Peiper, Brukental and Moalem2011); CNCPS=Cornell Net Carbohydrate and Protein System (Fox et al., Reference Fox, Tedeschi, Tylutki, Russell, Van Amburgh, Chase, Pell and Overton2004); NAAT=Norwegian AAT model (Volden, Reference Volden2001); DFFS=Danish Fill Factor System (Hvelplund and Nørgard, Reference Hvelplund and Nørgard2003); DM=dry matter; FFL/FU=fullness factor and Danish feed unit; TMR=total mixed ration.
An interesting attempt to introduce data from another sensor parameter, rumination time, into the DMI prediction equation was presented by Clément et al. (Reference Clément, Guatteo, Delaby, Rouillé, Chanvallon, Philipot and Bareille2014), but they concluded that rumination time had no significant effect on accuracy of the DMI model. In a previous unpublished project, we concluded the same.
As feeding behavior will soon be monitored in commercial farms, the research question of this study was: What is the added value of feeding behavior for prediction of individual DMI in lactating dairy cows? The hypothesis of this study was that incorporating feeding behavior into the DMI model might improve the model by at least 10%. This hypothesis was statistically tested and was not rejected. Hence, the aim of this study was to develop a DMI model for the individual dairy cow that includes feeding behavior.
Material and methods
Animals
The experiment was performed at the ARO research farm in Bet Dagan, with 220 high-yielding Holstein-Friesian cows housed in an open no-stall cowshed and fed a TMR that is commonly used in Israel. Average feed intake was 26.5 DMI/day DM; the diet, TMR, used in this study comprised 21% wheat silage, 8% wheat hay and 2% vetch hay and 69% concentrates. The concentrate mixture contained (% of TMR DM) 29.4 corn grain, 1.9 rolled barley, 8.0 soybean meal, 1.7 Ca salts of long-chain fatty acids, 19.2 corn gluten feed, 2.0 non-linted cotton grains, 3.2% whey, 2.3 minerals+vitamins mix. This TMR contained 63.4% DM, 16.5% CP, 5.25% ether extract, 33.3% NDF, 18.0% forage NDF, and it’s in vitro DM digestibility was 75.3%. Energy level value was 1.68 Mcal/kg. The cows were, on average 187 days in lactation. Milk production was on average 43 l/day: 3.6% fat; 3.2% protein; 4.67% lactose. The individual cows’ voluntary feed intake and feeding behavior were monitored at every meal by a 42-stalls feed intake monitoring system developed by Halachmi et al. (Reference Halachmi, Edan, Moallem and Maltz1996 and Reference Halachmi, Ofir and Miron1998). The following parameters: MY, DIM, BW, neck and leg activity, lying behavior, milk composition and rumination time, were recorded with the farm’s regular herd management software (Noa, Afimilk and SCR). The best correlated parameters were calibrated into a DMI prediction equation and are presented in the Results section. Data used for model development were not used for model validation.
Nomenclature
Feeding behavior is frequency (number of meals and distribution along day and night), and meals’ durations, DMI i is individual cow’s voluntary DMI on day i; FCM (National Research Council (NRC), 1989) is fat-corrected milk, where FCM (4%)=0.4×kg milk+15×kg milk×fat content; BW is also known as ‘live weight.’
 $$Error_{i} ={\rm predicted}\,DMI_{i} -{\rm observed}\,DMI_{i} $$
ME is the mean error, also known as absolute bias=Σ(predicted DMI i −observed DMI i )/N=mean(error).
 $${\rm Relative}\,{\rm bias}={\left[ {\mathop{\sum}{({\rm predicted}\,DMI_{i} -{\rm observed}\,DMI_{i} )} /{\rm N}} \right]\over\left[ {\mathop{\sum}{({\rm observed}\,DMI_{i} )} /{\rm N}} \right]}$$
MAE is the mean absolute error [Σabs (predicted DMI i −observed DMI i )]/N=[Σabs (Error i )]/N=mean (abs (error)).
MSPE is the mean square prediction error=[Σ (predicted DMI i −observed DMI i )2]/N.
STD stands for standard deviation; DM stands for dry matter; TMR stands for total mixed ration (% DM of TMR=0.629); n=100 cows; t test was applied for significance.
Statistics
The new model was based on the NRC function (parameters are FCM, DIM, BW), with the additional parameter of feeding behavior.
NRC equation:
 $$\eqalignno{ & {{\rm DMI (kg}/{\rm day)}=(0.{\rm 372}{\times}{\rm fat{\hbox -}corrected}\,{\rm milk}{\plus}0.0{\rm 968}{\times}{\rm live}\,{\rm weight}^{{0.{\rm 75}}} )}\cr &\qquad \qquad \qquad {\times}({\rm 1}{\minus}e^{{({\minus}0.{\rm 192}{\times}({\rm week}\,{\rm of}\,{\rm lactation}{\plus}{\rm 3}.{\rm 67}))}} )$$
NRC equation with feeding behavior:
 $$\eqalignno{ & {\rm DMI}\,({\rm kg}/{\rm day})= \left( \matrix{ b_{{\rm 1}} {\times}{\rm fat{\hbox -}corrected}\,{\rm milk} \hfill \cr {\plus}b_{{\rm 2}} {\times}{\rm live}\,{\rm weight}^{{0.{\rm 75}}} \hfill \cr {\plus}b_{{\rm 5}} {\times}{\rm feeding}\,{\rm behavior} \hfill \cr} \right)\cr & \qquad \qquad \qquad {\times}({\rm 1}{\minus}e^{{{\rm (}b_{{\rm 3}} {\times}({\rm week}\,{\rm of}\,{\rm lactation }{\plus}b_{{\rm 4}} ))}} )$$
where the coefficients of b i =0.41, 0.052, −0.29, 6.3, 0.0074.
Results
At the individual cow level
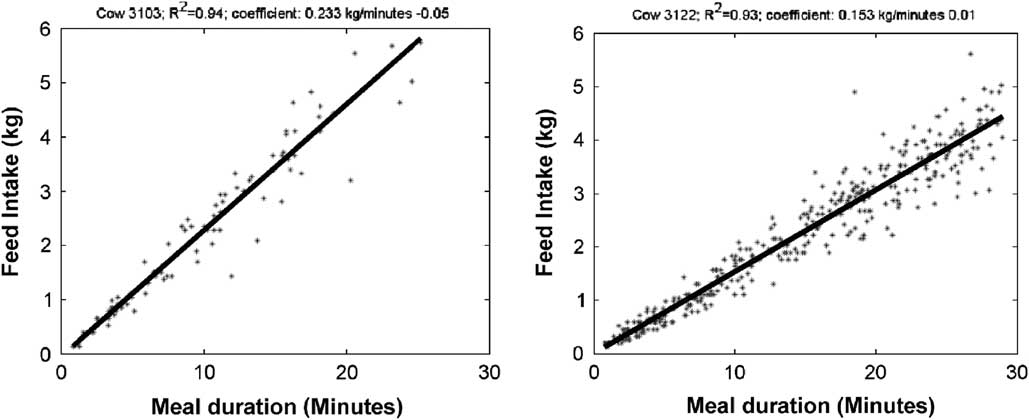
The eating velocity of each individual cow appeared to be correlated with the cow’s feed intake (Figure 1, R 2=0.93 to 0.94). However, each individual cow had its own eating velocity (Figure 1, 230 v. 150 g/min per individual). Consequently, incorporating feeding behavior into a DMI model seems to make sense, but owing to the individuality of the eating velocity, this cannot be the only parameter in the DMI-predicting equation. Other descriptors associated with the individual’s eating velocity should be incorporated.
Mutual relationship between feed intake and time spent in the feeding lane for cow 3103 (R 2=0.94) and cow 3122 (R 2=0.93). The two cows’ eating velocities differed as well, being 230 and 150 g/min, correspondingly.

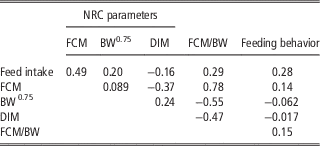
Based on the aforementioned literature, the correlated descriptive parameters in this study were FCM, BW, DIM, FCM/BW and feeding behavior. Table 2 presents the contribution of each parameter to the DMI model and suggests that addition of feeding behavior might improve model accuracy. The contribution of feeding behavior was higher than that of BW and DIM, and similar to the ratio FCM/BW; however, it was less than the contribution of FCM. Other investigated parameters (not shown) contributed considerably less.
Cross-correlation coefficients of feed intake and potential predictors

NRC=National Research Council (NRC, 2007); FCM=fat-corrected milk, 4%; DIM=days in milking.
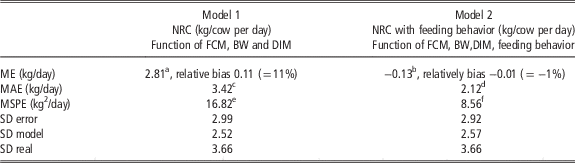
As already noted, incorporation of feeding behavior into the DMI model was performed via the NRC equation. The NRC and NRC+feeding-behavior models are presented in Table 3. The accuracy of the behavior-based model was clearly superior. The standard deviations were not significantly different between the two models.
Accuracy at the individual cow level of NRC v. NRC with feeding behavior model

NRC=National Research Council (NRC, 2007); FCM=fat-corrected milk, 4%; DIM=days in milk; ME=mean error; MAE=mean absolute error; MSPE=mean square prediction error; n=100 cows; % dry matter (DM) of total mixed ration (TMR)=0.629.
a,b,c,d,e,fSignificant difference at α=0.05.
Discussion
Restating the hypothesis
The hypothesis of this study was that incorporating feeding behavior into the DMI model might improve it by 10%. The model accuracy, in terms of MAE, was improved by 38% (2.12 and 3.42 kg/cow per day).
Potential limitations and weaknesses of the implications of the findings
Knowing the accurate individual cow’s DMI has implications for diet composition design in computerized self-feeders that are either located in a milking robot stall or standing alone. However, a group-level statistical model (v. ‘real-time closed-loop controlled dynamic modeling’) cannot accurately handle the extreme cases. A model prediction is more accurate around the average cow, in accordance with the database upon which the model was calibrated. The reason for the inaccuracy in extreme cases is the model’s ‘built-in’ smoothing, regression or lag functions.
Today’s ‘hot trend’ is to address the individual cow’s feed efficiency. The MY or FCM are positively correlated with DMI. Therefore, in the DMI prediction equation, MY or FCM are commonly written in the numerator. The MY or FCM are also the dairy cow economic output, therefore if the feed-efficiency equation is calculated as follows: input/output=feed/[MY or FCM], MY or FCM are written in the denominator. Therefore, if one applies a DMI equation for individual cow efficiency, the MY or FCM will be written in both the numerator and the denominator. Such an equation is not stable, and therefore applying the DMI prediction equations for individual cow feed efficiency is not recommended.
How are the results related to expectations and the literature?
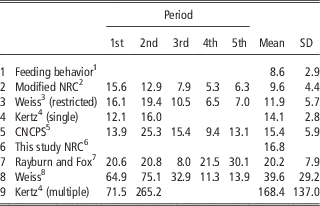
There are quite a few feed intake prediction models in the professional literature: Table 4 presents the four measures used in seven studies. Table 5 presents one measure of performance that was used in the other eight studies.
Comparing the new model (feeding behavior) with earlier published models, modified after (Arnerdal, Reference Arnerdal2005)

DFFS=Danish Fill Factor System (Hvelplund and Nørgard, Reference Hvelplund and Nørgard2003); CNCPS=Cornell Net Carbohydrate and Protein System (Fox et al., Reference Fox, Tedeschi, Tylutki, Russell, Van Amburgh, Chase, Pell and Overton2004); LFU=feeding recommendations by Lantmännen (Lindgren et al., Reference Lindgren, Murphy and Andersson2001); NAAT=Norwegian AAT model (Volden, Reference Volden2001); NRC=National Research Council (NRC, 2007); NRC1 was run on data collected in this study; NRC2 was run on data collected by Arnerdal (Reference Arnerdal2005).
Comparing the new model (feeding behavior) with earlier published models, measures of performance: mean square prediction error (MSPE (kg2/day)), modified after (Roseler et al., Reference Roseler, Fox, Chase, Pell and Stone1997)

MSPE=mean square prediction error.
Multiparous Holstein cows, control group (not treated with bovine somatotropin).
1 This study equation: feeding behavior incorporated into NRC (2007).
2 Roseler et al. (Reference Roseler, Fox, Chase, Pell and Stone1997) modification of National Research Council (NRC, 1989).
3 Equations with or without (restricted) the adjustment factor (Weiss, Reference Weiss1991).
4 Equations for single or multiple equations (Kertz et al., Reference Kertz, Reutzel and Thomson1991).
5 CNCPS=Cornell Net Carbohydrate and Protein System (Fox et al., Reference Fox, Sniffen, O’connor, Russell and Van Soest1992).
6 NRC (2007) run on data from this study.
7 Rayburn and Fox (Reference Rayburn and Fox1993).
8 Where the lactation periods were defined by Roseler et al. (Reference Roseler, Fox, Chase, Pell and Stone1997) as: (1) weeks 1 to 9 of lactation; (2) weeks 10 to 24 of lactation; (3) weeks 25 to 36 of lactation; (4) weeks 37 to 48 of lactation; (5) weeks 49 to 60 of lactation. The equations of Kertz et al. (Reference Kertz, Reutzel and Thomson1991) were designed to predict dry matter intake (DMI) through week 20 of lactation, and were therefore excluded from periods 3, 4 and 5.
The bias (% and kg) in previous reports (Table 4) suggests that the feeding-behavior model does not fall behind any of the earlier models addressed by Arnerdal (Reference Arnerdal2005). However, the other published measures of performance: MSPE and STD (error) are ambivalent, some better (2 to 4) and some worse (5 to 8). This raises a general debate present in every research study: how to select representative measures of performance. Other literature (Table 5) suggests that the feeding-behavior model’s MSPE (kg2/day) does not fall behind all earlier models reviewed byRoseler et al. (Reference Roseler, Fox, Chase, Pell and Stone1997).
However, none of the above studies primarily tackled the individual cow. They were more focused on group-level management. In contrast, Halachmi et al. (Reference Halachmi, Edan, Maltz, Peiper, Brukental and Moalem2004 and 2011) proposed an individual cow feed intake model for Danish reds, Jerseys and Holsteins. In their data for Holstein multiparous cows (Halachmi et al., Reference Halachmi, Edan, Maltz, Peiper, Brukental and Moalem2011), the MAE was 2.71 kg/cow per day (Halachmi et al., Reference Halachmi, Edan, Maltz, Peiper, Brukental and Moalem2004 and Reference Halachmi, Edan, Maltz, Peiper, Brukental and Moalem2011) and the National Research Council (NRC) (2007) reported 2.98 kg/cow per day. In this study, the MAE was 2.12 kg/cow per day. This study, although introducing a simpler model (five coefficients v. (Halachmi et al., Reference Halachmi, Edan, Maltz, Peiper, Brukental and Moalem2004) a few hundred coefficients), gave a comparable or even better prediction.
Relationships shown by major findings and further research
Table 1 suggests that if feeding behavior is not highly cross-correlated with the other descriptive parameters (FCM, BW and DIM) that are already in the model, the value of the feeding behavior is enhanced. In further research, with more cows over longer periods, this question should be addressed.
A sudden divergent feeding behavior also has health, approach calving and TMR quality implications (Urton et al., Reference Urton, von Keyserlingk and Weary2005; Gonzalez et al., Reference Gonzalez, Tolkamp, Coffey, Ferret and Kyriazakis2008). Therefore, low-cost monitoring of feeding behavior will soon be commercially available for use on farms, if not because of the feed intake estimation then because of animal health issues. Implementing new low-cost feeding-behavior sensors is advised in further research.
As one might say: ‘if a direct measured (sensor) cow individual feed-intake will be soon commercially low-cost available on the market, the necessity of a DMI model is questionable.’ This point is often raised up since the first edition of the NRC feed intake model back in the 1980s. The NorFor Scandinavian feed intake model and other models might facing the same justified criticism. As yet the NRC and the other models, although less accurate on cow individual level comparing with direct measurement, are widely applied everywhere. Halachmi (Reference Halachmi2015) book discussed and listed measures that are potentially going to be replaced soon by sensors, but feed intake sensor is not listed among them. After a feed intake sensor will be developed and validated, it will probably not be immediately purchased by all the farms worldwide at once. Like milking robots, tractors, pedometers, electronic milk recording, rumination tags and other developments in agriculture, it will get started with few pioneer farms in advance and intensive production systems and will take decades before the massive number of farms will purchase the feed intake sensors. Right now (2014) the principle author is familiar with only two installation sites here in Israel on commercial conditions that provide feeding-behavior data on cow individual level, the correlation with feed intake (or ‘meal size’) is not available yet.
The feed intake change with time (Halachmi, Reference Halachmi2004, No 63); the NRC takes it into account by means of cow individual factors: MY, BW and DIM those are also changing over time. The feeding behavior does not differ from the other cow individual factors, it changes over time. This paper does not develop a new model, it introduces feeding behavior into existing (NRC) model. In further research, we advise studying how feeing behavior changes with time (age) and environment (cold or heat challenges).
In this study, incorporation of feeding behavior was performed via the NRC feed intake equation. In further research, we advise incorporating feeding behavior into other equations. Equation forms that do not include smoothing or lag functions (e.g. the one developed by Halachmi et al. (Reference Halachmi, Edan, Maltz, Peiper, Brukental and Moalem2004) does not include the lag function) has the potential to be more positively influenced by the new introduction of feeding behavior.
Conclusions
At the individual cow level, eating velocity seemed to be correlated with feed intake (R 2=0.93 to 0.94). The eating velocity coefficient varied among individuals, ranging from 150 to 230 g/min per cow. The contribution of feeding behavior to the DMI model was higher than the contribution of BW, similar to the contribution of FCM/BW and not as large as the contribution of FCM. Incorporating feeding behavior into the DMI model improved its accuracy by 1.3 kg/cow per day (38%, 2.12 and 3.42 kg/cow per day, Table 3). In further DMI model developments, in additional to MY and BW, feeding behavior should be incorporated.
Acknowledgements
The authors would like to thank the farm personnel (led by Shamay Yakobi) and the feed intake monitoring systems research assistants: Mr. Aharon Antler and Mr. Natan Barchilon for data collection and their engineering help. The research was funded by the Israeli Ministry of Agriculture's Chief Scientist Fund, OptiBarn 459-4490-2014; the IDB fund number 0442, and provide preliminary data for Eu-PLF 459 4465.