I. INTRODUCTION
The use of titanium and its alloys in aerospace industry has increased recently because of their superior properties and the improvements made on machining these alloys. Reference Ulutan and Ozel1 Ultra-precision manufacturing technology is one of the most important methods to produce high-quality titanium alloy components with surface precision and roughness in the scale of nanometer. Reference M’Saoubi, Outeiro, Chandrasekaran, Dillon and Jawahir2 However, during ultra-precision cutting, the titanium alloy specimens suffer from a combination of various deformations, which reduces machining precision and surface roughness. In addition, microstructure near the machined surface of component can be significantly changed by the material removal process, which can affect the functional performance of finished components. In-depth understanding of the mechanism of material removal, especially knowing the dynamic characteristics of workpiece and the main factors affecting surface integrity can provide an effective way to improve the machining precision. Although numerous previous studies reported in literature revealed the formation of finished surface, the prediction of material characteristics and microstructural changes in severe plastic deformation layer with existing analytical approaches has not been successful. Reference Jawahir, Brinksmeier, M’Saoubi, Aspinwall, Outeiro, Meyer, Umbrello and Jayal3
In recent years, significant microstructure changes in the primary deformation zone were reported in various materials, such as Inconel alloy, Reference Hadi, Ghani and Haron4 cp-titanium, Reference Shankar, Lee and Chandrasekhar5 iron, Reference Swaminathan, Shankar, Lee, Huang, King, Kezar, Rao, Brown, Chandrasekar, Compton and Trumble6 stainless steel. Reference Brinksmeier, Gläbe and Osmer7 However, these publications were mainly focused on the cutting chips. There were few studies reporting the microstructure of finished surface, which is more important than chips in most situations. Reference Jawahir, Brinksmeier, M’Saoubi, Aspinwall, Outeiro, Meyer, Umbrello and Jayal3 To reveal the influence of continuous impact caused by cutting-force to machined surface, orthogonal cutting experiments were usually conducted to discover the phase decomposition of alloy workpiece surface by using back-scattered electron microscopy. Reference Wang, To, Chan, Cheung and Lee8,Reference Zhang, To, Cheung and Zhu9 The test results showed that the microstructural transformation promotes the uncertainty of surface-topography. In addition, the grain structure changes in machined surface lead to uncertainty about component performance. Tool-wear may also induce the generation of white layer on finished surface, but its effect is yet ambiguous because the contradictory treads still can be recognized in literature studies. Reference Schwach and Guo10,Reference Ramesh, Melkote, Allard, Riester and Watkins11 Although researchers tried to explain above phenomenon, it is difficult to get a common point of view. Reference Fedirko, LukYanenko and Trush12 In essence, as the thickness of white layer is very thin in micro-machining process, the mechanical properties of finished surface depend more on the evolution of surface microstructure.
Recently, scholars have paid more attention on the application of physics-based material models in finite element method (FEM) simulations. Ding et al. Reference Ding and Shin13 studied the evolution of cell structure during micro-cutting process to obtain corresponding grain refinement. However, a key limitation of their constitutive law is that the grain size depends only on the dislocation-based model as d = Kρ0.5, where K is a constant and ρ is the dislocation density. Reference Liu, Salahshoor, Melkote and Marusich14 It means that the grain will take place the continuous evolution even without recrystallization if the shear stress can cause a net increase of total dislocation density. As one of mesoscale simulation methods, dislocation dynamics (DD) can provide new perspectives into some aspects of material behavior heretofore not explained by using continuum approaches, such as the mechanism of material strengthen and the evolution of dislocation configurations. In particular, unlike fully discrete methods such as the molecular dynamics method, DD offers better scalability to solve larger and more complicated problem at the micrometer and submicrometer length scale. Shishvan et al. Reference Shishvan and Van der Giessen15 showed that the simpler two-dimensional DD studies are more successful in a range of applications encompassing microstructure evolution and plastic mechanism. Tarleton et al. Reference Tarleton, Balint, Gong and Wilkinson16 adopted a planar discrete DD model to research the micro-cantilever bending of hexagonal close packed (HCP) crystals for plane strain prismatic slip. The results indicated that the highly localized, inhomogeneous stress changes the hardening mechanisms. Liao et al. Reference Liao, Chang, Gao and Kim17 studied the interaction of dislocations and workpiece substrate structures during warm laser shock peening by multiscale discrete DD. It was found that the impulse load facilitates the generation of highly dense dislocations distribution and reinforces the surface strength of workpiece. The DD method provides a new way to investigate the evolution of surface microstructure and mechanical properties during micro-cutting process.
In this paper, the evolution of surface grain structure of titanium alloy under complex cutting conditions was studied through a two-dimensional climb assisted DD technology. The influence of crystal structure changes on the mechanical properties of machined surface was revealed. The manuscript is organized as follows: Sec. II gives a brief introduction to the coupling algorithm between FEM and DD method. Sec. III presents the results and discussion. Finally, Sec. IV summarizes the paper with some main conclusions.
II. DD SIMULATION FRAMEWORK FOR MICRO-CUTTING
A. Simulation algorithm of DD
In present study, a multiscale simulation framework was developed by coupling the DD code into a finite-element package via python scripting. In this algorithm, the dislocation processes of kinetics, generation, accumulation, recovery, and annihilation were calculated by DD simulation. The FEM solver was used for the solution of applied stress of dislocations during micro-cutting process. The Peach–Koehler (P–K) force on dislocation I can be written as
 $$f_{\rm{g}}^{(I)} = \left( {\sigma + \sum\limits_{J \ne I} {\sigma _{ij}^{(J)}} } \right)b_j^{(I)}{m_i}\quad ,$$
 $$f_{\rm{c}}^{(I)} = - \left( {\sigma + \sum\limits_{J \ne I} {\sigma _{ij}^{(J)}} } \right)b_j^{(I)}{s_i}\quad ,$$
where
 $f_{\rm{g}}^{(I)}$
is dislocation slip force,
 $f_{\rm{c}}^{(I)}$
is dislocation climb force, σ is applied stress on the glide plane, σ
ij
denotes the internal stress field induced by other dislocations,
 $b_j^{(I)}$
is Burger’s vector of dislocation I with unit normal m
i
, and a unit vector s
i
in the slip direction.
Reference Giessen and Needleman18
The glide velocity
 $v_{\rm{g}}^{(I)}$
of dislocation I is governed by the glide component of the P–K force through the following drag law
 $$v_{\rm{g}}^{(I)} = {M_{\rm{g}}}\left( {f_{\rm{g}}^{(I)} - {f_0}} \right)\quad ,$$
where f 0 is friction force, M g = 1/B g, and B g is drag coefficient, which changes with temperature and pressure. Dislocation climb, which is controlled by a drag-type relation similar to slip movement, is a thermal activation process. Its velocity can be written as
 $${v_{\rm{c}}} = {{2\pi {D_{\rm{s}}}{v_{\rm{a}}}\left( {{{{F_{\rm{e}}}} \mathord{\left/ {\vphantom {{{F_{\rm{e}}}} L}} \right. \kern-\nulldelimiterspace} L}} \right)} \over {b_{\rm{e}}^2kT}}\quad ,$$
where D s is self-diffusion coefficient, b e is the magnitude of the Burgers vector, v a is vacancy volume, F e/L is the climb component of P–K force on unit segment of dislocation, k is Boltzmann constant, and T is absolute temperature. Reference Huang, Li and Tong19,Reference Danas and Deshpande20 Dislocation can jump out of the plane only if the climb distance is larger than the minimum width between adjacent slip planes, which is approximately equal to the magnitude of the Burgers vector. The time increment of dislocation climb is usually 100 times larger than that for glide. Reference Ayas, Deshpande and Geers21,Reference Davoudi, Nicola and Vlassak22 In particular, dislocations on the intersectional planes can form the dislocation junctions if they approach closely. These junctions may form new obstacles on their slip planes and pile up the subsequent dislocations.
In DD framework, the nucleation and encounter of dislocations must comply with the special rules. New dislocations are multiplied from the Frank–Read (F–R) sources, which possess the intrinsic nucleation strength. The distribution of F–R sources is a random arrangement on crystal slip systems and the nucleation time t F–R is defined as
 $${t_{{\rm{F}}-{\rm{R}}}} = {\eta \over 2}{{Bl} \over {{\tau _{{\rm{F}} - {\rm{R}}}}b}}F\left( \xi \right)\quad ,$$
where η is a constant, ξ is τ/τF–R, and F(ξ) is a rapidly decaying function. Avoiding activating all of dislocation sources at the same time, the strength of each F–R source follows the Gaussian distribution randomly. The sign of new dislocations separates from each other, and the distance between new multiplication dipoles can be given by
 $${L_{{\rm{F}}-{\rm{R}}}} = {G \over {2\pi \left( {1 - \nu } \right)}}{b \over {{\tau _{F - {\rm{R}}}}}}\quad ,$$
where G is shear modulus, ν is Poisson’s ratio. Like dislocation sources, the position of obstacles which can pin dislocations is also based on stochastic distribution on the slip planes. In addition, the formation of a junction can act as a potential point for F–R source when dislocations glide on two intersecting slip plane within a special distance. Reference Benzerga, Brechet, Needleman and Giessen23 Spontaneous annihilation of two dislocations with opposite signed Burgers vectors can occur if they come within a critical distance 6b.
B. Trans-scale simulation model for micro-cutting
Commercial software Abaqus/Explicit was used to reveal the physical comprehension of surface formation in micro-cutting of titanium alloy. Fully coupled thermos-mechanical analysis was carried out for a time step of 0.5 ns to capture the external stress which is based on the stress distribution in micro-cutting. Then the image stress σNOD at the finite element (FE) nodes can be obtained by subtracting the eigen-stress caused by surrounding dislocations. Finally, the applied stress field of dislocation point I in an element was readily solved by the interpolation of FE nodes. The resultant solution of unit increment step was continuously imported into DD framework, which treats plastic deformation as the evolution of a mass of dislocations. Actually, the evolution of grain structure is mainly concentrated in the surface severe plastic deformation (SSPD) layer, which is the most important part of component surface during micro-cutting process. Therefore, the DD simulation was focused on a representative cell in SSPD layer to improve the computational efficiency.
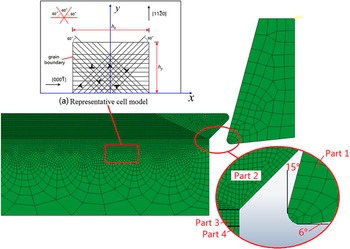
2D orthogonal cutting model is shown in Fig. 1. Planar strain linear quadrilateral element CPE4R was utilized for a temperature–displacement coupled analysis. Reference Zhang, Mabrouki, Nelias and Gong24 The FEM micro-cutting model was typically modeled by four geometrical parts to optimize the contact management, such as, Part 1 was cutting tool, Part 2 was uncut chip thickness, Part 3 was tool passage zone, and Part 4 was workpiece support part. The cutting depth was 40 μm and uncut chip thickness was 300 μm. Diamond tool, which can significantly inhibit the tool-wear, was built with the rank angle and flank angle of 15° and 6°, respectively. The enter angle was 90° and the inclination angle was 0°. The edge radius of diamond tool was 10 μm. The interaction between tool and workpiece was considered in dry cutting.
DD simulation model of the micro-cutting of titanium alloy.

2D representative cell model was created to perform the dislocation evolution in local area of workpiece surface as Fig. 1(a). In the deformed titanium alloy, dislocations only move on the
 $\left\{ {10\bar 10} \right\}$
slip planes and in the
 $\left\langle {11\bar 20} \right\rangle$
slip directions.
Reference Tarleton, Balint, Gong and Wilkinson16
On the base of the x-axis, the reference slip directions are {0°, 60°, 120°}. The h
x
/h
y
of titanium alloy crystal model for DD simulation of monotonic deformation was
 ${\rm{2}}\sqrt {\rm{3}} /3$
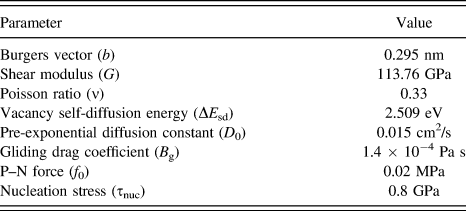
. The pre-existing dislocation density was 6.25 × 10¹² m−2 and the dislocations were randomly placed on slip planes. The dislocation sources density was 4.2 × 10¹³ m−2. As the impurity particles density of titanium alloy outclasses pure metal, the dislocation obstacle density was set to be 2.1 × 10¹³ m−2. Other material constants for titanium alloy can be found in Table I.
Material constants of titanium alloy.

III. RESULTS AND DISCUSSION
A. Grain structure changes during micro-cutting process
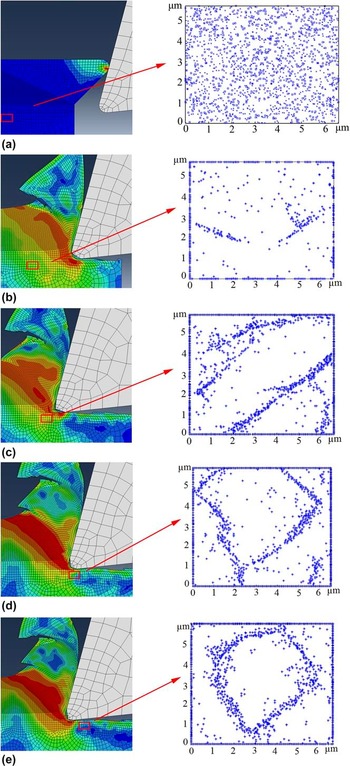
Surface conditions and their modifications caused by complex cutting-force play an important role in micro-cutting process. Figure 2 shows the FEM-DD observations of surface microstructure subjected to external load. Four typical grain structure features are regarded as: dislocation line, dense dislocation band, subgrain boundary, and grain refinement. All of analysis results presented here are obtained by using a static random distribution of F–R sources and obstacles sources as initial condition in Fig. 2(a). A mass of dislocations are generated from the dislocation sources when stress can meet or pass the intrinsic nucleation strength threshold of titanium alloy. In the inception phase, the compression of cutting tool results in the mushrooming of dislocations at the tool-workpiece area. Meanwhile, the combined interaction of feed force and cross force drives the evolution of dislocation organizational structures. As the tool approaches the representative cell, parallel dislocation lines are formed in Fig. 2(b). It is worth mentioning that grain hardening phenomena are induced by dislocation pile-up because the impenetrable grain barriers block dislocation slip.
Surface microstructure evolution during micro-cutting process. (a) the ‘o’ is pre-existing dislocation sources and ‘x’ is pre-existing dislocation obstacles at initial period; (b) surface dislocation structure at 3000 ns during cutting; (c) surface dislocation structure at 3500 ns during cutting; (d) surface dislocation structure at 3750 ns during cutting; (e) surface dislocation structure at 4000 ns during cutting.

In general, the micro-machining process is divided into two stages: shock stage and dynamic recovery stage. In the former, various behaviors are normally activated to accommodate external load, containing dislocation motion, junction, immobilization, interaction, and spatial rearrangement. With the decreasing of the distance between tool tip and the simulation cell, the resolved shear stress in local area increases significantly. Therefore, a growing amount of dislocations are thought to be involved in nucleation and extending. The tool moving and dislocations evolution facilitate the formation of machined surface. The distribution of dislocations has a tendency to be inhomogeneous, and Fig. 2(c) shows the high-density dislocation persistent slip bands (PSBs) are formed when tool tip arrives at the upper right of cell. In essence, the arrangement of dislocations is disorganization without preferable slipping orientations in initial state, but the cutting force prompts the slipping orientations and microstructure to follow the feed direction. In addition, a mass of dislocations may be hampered by local obstacles, such as stacking faults, cluster defects, and junctions. The interaction among dislocation walls, slipping bands, and impurity particles produces the pile-up hardening, which suppresses the plastic deformation. According to Taylor relation, Reference Al-Rub and Voyiadjis25 the high dislocation density brings the stress concentration, which would induce surface grain to take place the local dislocation multiplication.
With the proceeding of cutting, the refined grains are gradually formed by generating individual dislocations cell. As shown in Fig. 2(d) and a twisted grain with a width of about half of original grain is obtained. This boundary of grain is sharper and thinner than dislocation bands, but its misorientation is more serious. The numerical results indicate that dislocation annihilation and rearrangement can transform crystal into independent subgrain structure according to energy minimization mechanism. Reference Lu, Luo, Zhang, Cui, Sun, Zhou, Zhang, You, Chen and Zhong26 With the increase of dislocation density, the inhomogeneous distribution results in the continuous dynamic refinement of surface grain. In particular, the dislocation lines and bands cannot be generated in subgrain with submicron scale. This is due to the fact that the narrow crystal structure impedes the long-range evolution of dislocations. After cutting, the finished surface takes place a recovery process and dislocation climb can be found in this process. The dislocation migration promotes the formation of vacancy defect in the original location of dislocation. Then the stacking fault energy of dislocations leads to the continuous evolution of recrystallization. The process results in a gradually accumulation of boundary disorientation until the high angle boundaries are formed as shown in Fig. 2(e).
The microstructure of machined titanium alloy shown in Fig. 3 was adopted to qualitatively demonstrate the reliability of above simulation results. The observation from both the experimental and simulation results enables us to reasonably conclude that the microstructure of machined surface from top to bottom tends to present plastic deformation and structure alteration. The mean grain size of surface sharply drops from ten microns to several microns. This phenomenon indicated that the micro-cutting process not only offers a route for the manufacture of micro component of titanium alloy but also creates a surface with refine grains structure.
Microstructure alteration beneath the machined surface. (a) initial stage of cutting; (b) later stage of cutting. Reference Ginting and Nouari27

B. The effect of grain size on microscopic deformation field
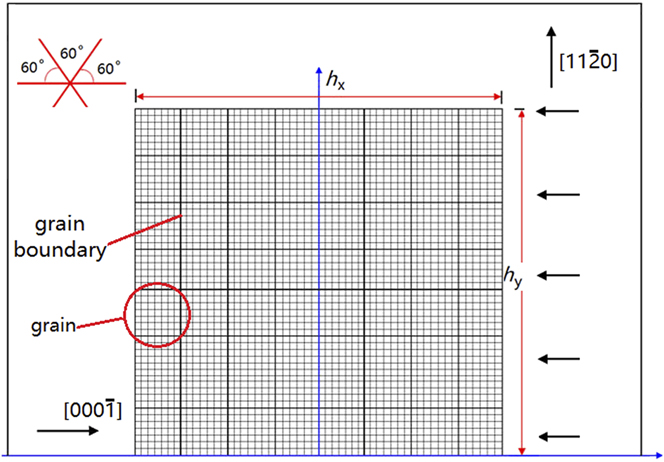
From Sec. III. A, the micro-cutting process promotes the evolution of surface microstructure and results in grain refinement. The structure changes directly lead to an uncertainty of surface properties and severely affect the machining quality. Hall–Petch (H–P) equation is one of the most common ways to reveal the interaction between materials properties and microstructure in machining. Reference Hughes, Smith, Pande, Johnson and Armstrong28,Reference Liu, Salahshoor and Melkote29 Although series of simulations and experiments indicated that the key parameters in H–P equation possess the ultra-sensitivity to size effect, Reference Li, Hou, Huang and Ouyang30 existing researches always neglected this issue. For instance, the H–P sensitivity exponent was roughly defined as 0.5 in physics-based materials model without considering the effect of grain changes in micro-cutting process. Reference Wang, Liu and Wang31,Reference Rotella and Umbrello32 In addition, the present DD models on size effect were mostly based on the scaling of internal grain so that it is difficulty to obtain an accurate correlation mechanism between refined grains and mechanical properties. Reference Ahmed and Hartmaier33 Therefore, in present study, a confining h x = 13.2 μm and a range of crystal lattice number n = {2 × 2, 4 × 4, 8 × 8, 20 × 20} were used to study the plastic behavior of grain structure changes in titanium alloy surface, as shown in Fig. 4.
Sketch of the boundary value problem with various grain structures.

To obtain internal stress responses and stress–strain curves of finished surface microstructure, the relaxed dislocation patterns were subjected to an external load. Specifically, the strain rate was continually monitored to exclude the influence of high strain rate in this simulation. Reference Ahmed and Hartmaier34 The plastic strain can be calculated by
 $${\dot \gamma _{\rm{p}}} = \phi b\rho {{{\rm{d}}\bar l} \over {{\rm{d}}t}} + \phi b\bar l{{{\rm{d}}\rho } \over {{\rm{d}}t}}\quad ,$$
where b is Burgers vector, ϕ is correction factor,
 $\bar l$
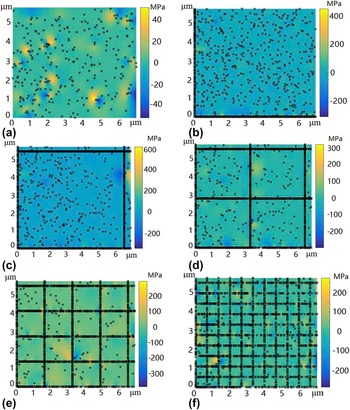
is mean distance traveled by dislocations in an increment step and ρ is mobile dislocation density. Figure 5 shows the local dislocation patterns and internal stress states for various lattice sizes.
Local distribution of σ xx and dislocations of titanium alloy (Ti–6Al–4V). (a) un-relaxed configuration of pre-existing dislocation; (b) gain number is 1 × 1 and grain size is 13.2 × 11.44 μm; (c) grain number is 2 × 2 and grain size is 6.6 × 5.72 μm; (d) grain number is 4 × 4 and grain size is 3.3 × 2.86 μm; (e) grain number is 8 × 8 and grain size is 1.65 × 1.43 μm; (f) grain number is 20 × 20 and grain size is 0.66 × 0.572 μm.

To carry out the size effect simulations within sufficient time durations to obtain a stable state, an adaptive scheme was applied to control the simulation time step proceeding. The initial un-relaxed configurations were achieved by randomly assigning the special dislocation density in Fig. 5(a). Then the dislocations were allowed to relax at zero stress until they have been distributed the quasi-equilibrium positions. The representative cell was discretized into quadrilateral grains with the same dimensions and all of grain boundaries were impenetrable barriers. During the micro-cutting process, the structure of dislocation configurations develops from simpleness to complexity. A large amount of dislocations are blocked by the precipitates and junctions, which interact with dislocations at short ranges and influence local dislocation patterns. Generally, the energy aggregation caused by residual stress can facilitate dislocations nucleation and form continuous slip bands span multiple grains. However, Fig. 5 shows that the evolution of dislocations from one grain to neighboring is prevented by grain boundaries and the number of restricted dislocations increases with the decline of mean lattice size. It is worth emphasizing that almost all of stress concentration regions (SCRs) are focused on the vicinity of grain boundaries. Meanwhile, a mass of dislocations are piled up on the grain boundaries, which result in the surface hardening. Clearly, this observation is in a reasonable agreement with theoretical expectations that a hard grain region has high local dislocation density and a soft grain region has low dislocation density. Reference Sedlacek35,Reference Kim, Kim and Lee36
For Figs. 5(b)–5(d), the inner stress becomes increasingly polarized with the decrease of the size. It is because that the decreasing of grain dimensions brings more severe stress concentration. Then the internal stress distorts the crystal lattice and induces the aberrance of grain boundaries. The squash and stretch among lattice boundaries greatly reduces the fatigue life of titanium alloy and causes the initiation and evolution of microcrack. However, above phenomena are significantly reduced once the grain size drops below 1.65 μm as Figs. 5(e) and 5(f). In essence, the refinement process results in an exponential increase in grain boundary area and relieves the cumulative effect caused by dislocation pile-up. In addition, the back stress induced by pile-up can inhibit the reactivation of F–R sources from which the dislocations generated. For the refined grains, this promotes the multiplication of dislocations from neighboring slip planes within a lower shear stress. Reference Tarleton, Balint, Gong and Wilkinson16
C. The effect of grain size on dislocation evolution and stress–strain response
Since the dislocation density on boundaries is several times larger than other regions, the mean dislocation density can be calculated as
 $$\bar \rho = \phi {\rho _{\rm{w}}} + \left( {1 - \phi } \right){\rho _{\rm{c}}}\quad ,$$
where
 $\bar \rho$
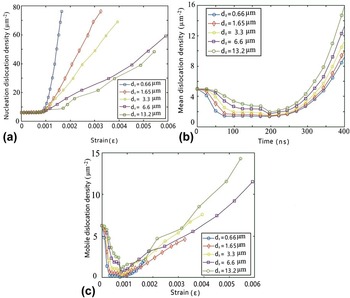
is mean dislocation density, ρw is the dislocation density of grains boundaries, and ρc is the dislocation density of inner lattice, φ is a constant, which is taken 0.2 in present study. To reveal the evolution of dislocations with various lattice sizes, the curves of dislocation density versus plastic strain and time are modeled as in Fig. 6.
The dislocation density of titanium alloy (Ti–6Al–4V) evolutions with various mean lattice sizes. (a) the nucleation dislocation density versus strain; (b) the mean dislocation density versus with time; (c) the mobile dislocation density with stain.

Figure 6(a) shows the dislocation density against the strain. It is found that the nucleation dislocation density was nearly the same when the strain is below 0.0008. With the increasing of strain, new dislocations are constantly produced. Since the dislocations movement is restricted in refine grains, the plastic deformation of fine-grains is small according to Eq. (7). The phenomenon drives the proliferation of dislocation to release the external load. It is worth emphasizing that the slope of curve for d x = 0.66 μm is much higher than others, which indicates the nucleation rate in submicron grain is the fastest. Figure 6(b) shows that the mean dislocation density declines because of the influence from dislocation immobilization and annihilation in initial period. In particular, these curves appear an obvious turning point in halfway, which marks that the external stress is large enough to activate F–R sources. Along with time, the entangled curves disappear and a clear distinction occurs. Originally the quality of movable dislocations gradually declines and then bottoms out as shown in Fig. 6(c). It is noted that the curve of d x = 0.66 μm firstly rebounds. This is mainly due to the fact that mobile dislocation density of refined grains tends to decline relative to coarse grains, and that induces the dislocation starvation effects. Reference Nix, Greer, Feng and Lileodden37 Dislocations leave the initial grains more quickly than their multiplication, which results in the starvation hardening and leads to a rising demand for dislocation dipole during plastic deformation. Therefore, the grain refinement facilitates the weakness nucleation of grain and promotes microstructure hardening in titanium alloy surface. This conclusion is consistent with the dislocation patterns shown in Fig. 5.
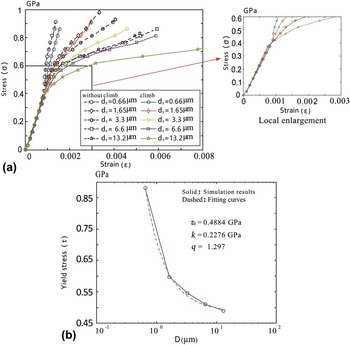
Figure 7 shows the computationally obtained stress–strain curves by considering dislocation climb for selected grain sizes d x = {0.66, 1.65, 3.3, 6.6, 13.2} μm to further investigate the influence of grain refinement on the mechanical properties of workpiece surface during micro-cutting process. The same pre-existing dislocation density, dislocation sources, and obstacles density, and slip system distribution were assigned in all simulations.
Stress–strain curves of titanium alloy (Ti–6Al–4V) with selected grain sizes d x ={0.66, 1.65, 3.3, 6.6, 13.2} μm. (a) stress–strain curve for different grain sizes; (b) grain size dependence of yield strength.

The results show that the slope of stress–strain curves for random dislocation configurations is more dependent on the grain sizes at large strain. A near-ideal plastic response can be found in Fig. 7(a) when grain sizes d x is equal or larger than 6.6 μm. However, the refined grains possess an increased hardening rate because the crystal boundaries of fine-grains inhibit the average sliding length of independent dislocations and limit the movable dislocation density. Thus, the dislocations cannot form sufficiently slip bands that span different grains. It is worth contrasting that the effectiveness of the grain boundaries as barriers is drastically reduced in coarse grain that it can inherently form the dense PSBs to release the external stress. It is worth mentioning that there is a sharp transition in these curves between small scale plastic yielding and large scale plasticity. From the drawing of partial enlargement in Fig. 7(a), the stress–strain curves have a completely opposite evolution process when the plastic strain is below 0.001. The reason for this case is that the dislocation configurations in large grains usually have far more complex microstructure at free external stress relax by forming junctions and locks. By comparison, the small grains provide better mobility feature at small applied stress due to the fewer internal barriers. Both of flow stress and hardening rate are sharply reduced for all of grain sizes if the dislocation climb is considered. Meanwhile, a perfect softening effect has been captured if the mean grain size d x ≥ 1.65 μm, but an inverse effect has been found when the mean grain size d x ≤ 1.65 μm. It can be explained that although dislocation climb can help dislocations move out of the original slip plane to bypass the dislocation obstacles, it also causes the dislocations that are more easily blocked by the impenetrable grain boundaries in small grain because the surface temperature is not enough to improve the penetration of grain boundaries during micro-cutting process.
The stress at strain εP = 0.2% is defined as yield stress and the evolution of yield strength with grain size can be obtained in Fig. 7(b). By comparing with the former stress–strain curves, the yield stress drops sharply with the increase of grain size when climbing is taken into account. For different microstructures, the simulations were repeatedly calculated to exclude the influence of random distributions of pre-existing variables. According to the simulation results, the H–P type scaling of yield stress can be well described by
 $$\tau = {\tau _0} + k{d^{ - q}}\quad ,$$
where τ0 is yield stress with sufficiently large grain size, k is material-specific coefficient, and q is sensitivity exponent of grain size, which is a more dominant parameter. The best fit equation has been shown in Fig. 7(b), parameter τ0 is 488.4 MPa and the value of q is 1.297 which accorded with a series of investigations where the calculated value of q in the range 1–1.5. Reference Tarleton, Balint, Gong and Wilkinson16,Reference Evers, Brekelmans and Geers38–Reference Balint and Deshpande40 The fitting result verifies our original inference that although the H–P relation is useful for size effect, the important parameter in this equation has been permanently changed by the complex cutting environment.
IV. CONCLUSIONS
In this study, the micro-cutting process of titanium alloy was simulated by climb assisted DD method. A special focus was given to the dependency between grain structure and mechanical properties of finished surface. The conclusions are listed as following:
-
(1) The predications of simulations fall within the existing experimental ranges, which demonstrated the feasibility of using the proposed two-dimensional mesoscale analysis method to study the surface microstructure evolution during micro-cutting process.
-
(2) A cutting induced surface grain refinement process has been found in micro-cutting of titanium alloy. The process can be described as follows: the development of dislocation lines in original grains, the formation of dense dislocation bands, the transformation of dislocation bands into subgrain boundaries, and the continuous dynamic recrystallization in subgrain boundaries.
-
(3) The grain boundaries and PSBs in surface bring appreciable scale effect by preventing dislocations moving from one to neighboring grain. In addition, nearly all of SCRs gather around the grain boundaries of Ti–6Al–4V, which can induce the crystal distortion and aberrance.
-
(4) The flow stress and hardening rate decline sharply when considering the influence of dislocation climb. For a sufficiently large surface grain, dislocation climb can result in a perfect softening effect. However, it has an opposite effect for polycrystals with smaller grain size under micro-machining condition.
-
(5) Based on a bottom-up approach, the H–P type scaling of yield stress has been calculated, q = 1.297, in various grain sizes.
ACKNOWLEDGMENTS
This research work was jointly supported by the National Natural Science Foundation of China (Grant No. 51575138) and the State Key Program of National Natural Science Foundation of China (Grant No. 51535003).