Introduction
The stoichiometry, i.e. the atomic proportions, of C, N, and P in the biomass, most commonly in primary producers, has been well documented in the last few decades (Elser et al. Reference Elser, Dobberfuhl, MacKay and Schampel1996, Urabe et al. Reference Urabe, Naeem, Raubenheimer and Elser2010, Yu et al. Reference Yu, Chen, Elser, He, Wu, Zhang, Wu, Bai and Han2010), since Redfield et al. (Reference Redfield, Ketchum and Richards1963) pointed out a general empirical proportion of 106:16:1 (C:N:P) from many different marine phytoplanktonic communities. Studies of terrestrial and freshwater ecosystems have frequently concluded that the stoichiometry of C, N, and P in the environment can influence ecosystem properties, such as biodiversity, nutrient limitation, and food-web dynamics (Sterner & Hessen Reference Sterner and Hessen1994, Elser et al. Reference Elser, Fagan, Denno, Dobberfuhl, Folarin, Huberty, Interlandi, Kilham, McCauley, Schulz, Siemann and Sterner2000). Despite the fact that Antarctic biological communities are controlled by severe physical constraints and the availability of organic matter and nutrient elements, which are often present in low concentrations and/or in proportions outside of the balanced ratio, this appears to be a fundamental paradigm that plays a significant role in the ecosystem processes (Priscu Reference Priscu1995, Nkem et al. Reference Nkem, Virginia, Barrett, Wall and Li2006).
In most of the Antarctic, biological activity is confined by the timing and spatial distribution of available liquid water, rather than nutrients. Aquatic systems are more depressed by the scarcity of nutrients (Priscu Reference Priscu1995) than terrestrial systems because their nutrient load is constrained by the short period of ice-free conditions in which the fixation, mobilization, and transport of nutrients may take place (Chown & Convey Reference Chown and Convey2007). Biological components in the watershed (mosses, lichens, and microbial mats) retain nutrients (C, N, and P) in their biomass, and the flux of nutrients within and between these organic compartments plays a crucial role in controlling the delivery to aquatic elements of the system. The shortage of one element may cause limiting conditions, and thus lower growth rates of primary producers are achieved. This affects the other organisms of food webs. Phosphorus is considered the most important limiting factor in inland aquatic systems from Maritime Antarctica, although N can be limiting in freshwater bodies on some ice-shelves (Fernández-Valiente et al. Reference Fernández-Valiente, Quesada, Howard-Williams and Hawes2001, Reference Fernández-Valiente, Camacho, Rochera, Rico, Vincent and Quesada2007, Toro et al. Reference Toro, Camacho, Rochera, Rico, Bañón, Fernández-Valiente, Marco, Justel, Avendaño, Ariosa, Vincent and Quesada2007). Liquid water is primarily generated via the melting of snow and ice, and a fraction of this liquid water will flow down-slope, washing off nutrients from the ground and terrestrial vegetation, eventually reaching streams and lakes (Woo Reference Woo2000). Organic matter and nutrients can also be transported as particulate matter, or as exudates from vegetation, while a significant proportion remains tied up in terrestrial biological compartments. The balance in nutrient partitioning between various components in Antarctic catchments is an indicator of the balance between various catchment processes during any given period. This balance can be expected to change as the environment changes, but to our knowledge, there are no studies aimed at establishing the baseline to confront the shifts derived from global change in one of the areas on Earth where climate change is more active (Quayle et al. Reference Quayle, Peck, Peat, Ellis-Evans and Harrigan2002).
In this study we examine C:N:P stocks and ratios in different organisms and communities of the Limnopolar Lake watershed on Byers Peninsula. These contents can be used as physiological indicators providing information about nutrient availability, and also as proxies of nutrient inputs to the aquatic systems via organic matter transportation, and thus the potential growth rate and productivity in the aquatic systems. Our working predictions are that biological stoichiometry within the watershed is coupled to availability and movement of liquid water, and that this is affected by upstream organisms. We develop a conceptual model to describe possible hydrological transport of C, N, and P across the landscape of Byers Peninsula.
Materials and methods
Study site
Byers Peninsula, located on the south-west side of Livingston Island in the South Shetland Islands, is an Antarctic Specially Protected Area (ASPA no. 126). The Spanish Polar Research Programme has been investigating the ecology of the Limnopolar Lake watershed since 2001 (Toro et al. Reference Toro, Camacho, Rochera, Rico, Bañón, Fernández-Valiente, Marco, Justel, Avendaño, Ariosa, Vincent and Quesada2007). This is a 0.58 km2 basin with terrain varying from 55 m above sea level (a.s.l.) at the basin outlet to 84 m a.s.l. at the highest location (Fassnacht et al. Reference Fassnacht, Toro, Meiman and Whitt2010). The basin is underlain by permafrost with an active layer of c. 80 cm in depth (data not shown). The vegetation studied from the watershed comprises a small amount of lichens (from the genus Usnea) inhabiting larger rocks. Discrete wet areas are covered with mosses, mainly Brachythecium austro-salebrosum (C. Muell.) Kindb., Campylium polygamum (Schimp.) C.E.O. Jensen, Sanionia uncinata (Hedw.) Loeske, Warnstorfia laculosa (Müll. Hal.) Ochyra & Matteri, and W. sarmentosa (Wahlenberg) Hedenas and cyanobacterial mats, and very few Deschampsia antarctica Desv. plants.
Biomass estimation
Limnopolar watershed biomass estimation was performed during the 2008–09 Antarctic sampling season. The expedition team surveyed the watershed with a GPS, recording the perimeter of all areas of mosses and visible biofilms that were large enough to be compatible with the GPS resolution (≈6 m). Vegetated areas were estimated from GPS data using OziExplorer software, while the area of those patches of biomass that were below the GPS resolution was estimated in situ. In the case of Somero Pond (Fig. 1), the perimeter was traced with GPS, and the area of mosses and biofilms adjacent to the shoreline were quantified based on estimates of percentage of cover taken in the field. Green algal felts in the inflow to Limnopolar Lake were photographed with a measuring tape, and the area occupied was estimated using Image J software. The cover of aquatic mosses was estimated by SCUBA divers’ measurements onto a bathymetric lake map (data not shown). The total area of lichens throughout the watershed was also estimated in situ.
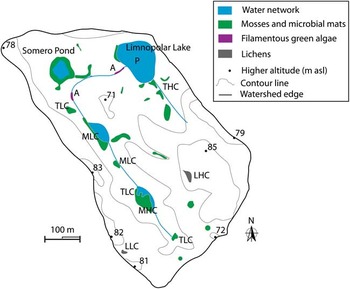
Schematic map of Limnopolar Lake watershed showing the most important biomass patches throughout the landscape. Patches analysed are classified as: THC = microbial mat, high C content; TLC = microbial mat, low C content; MHC = moss carpet, high C content; MLC = moss carpet, low C content; LHC = lichen, high C content; LLC = lichen, low C content; A = filamentous green algae; and P = aquatic mosses. More detailed data are in Table I.

To quantify biomass, core samples from every representative patch of mosses, biofilms, algae, and lichens were collected in triplicate, and all these places were photographed for further analysis. Non-quantitative samples of aquatic mosses were obtained by dragging. Samples were stored at -20°C during shipping to the laboratory in Spain. There, samples were weighed and dried at 65.5°C for 24 h. After grinding, total carbon and nitrogen content was estimated by elemental analyser (LECO CHNS-932) measurements. Total phosphorus content was estimated following the American Public Health Association-American Water Works Association standard methods (APHA, AWWA & WEF 1992). Organic matter contents were estimated by ash-free dry weight measurements, after baking them at 450°C in a muffle furnace for 24 h. Groups within community categories were identified on the basis of mg C (g DW)-1 (DW = dry weight) by calculating K-means clustering using XLSTAT software.
Microscopic study
Samples for microscopic observations and taxonomic determinations were taken with metal core samplers with 15 or 22 mm inner diameter. Stones and gross size sediments were removed from the communities with forceps, and the samples were kept frozen at -20°C for microscopic determination. Observations were carried out using both standard illumination and epifluorescence microscopy at the field camp immediately after collection, then sent to the laboratory in Spain where microscopic study was completed by bright field and epifluorescence, using an Olympus® blue filter set (EF 400–490 nm, DM 570, FB 590) and an Olympus® green filter set (EF 530–545 nm, DM 570, FB 590).
Results
Mosses and microbial mats were found in 21 patches within the watershed (Fig. 1). Only two patches of filamentous green algae were described, although other colonies were present. However, none of these were large enough to be considered as a patch. Aquatic mosses (Drepanocladus longifolius (Mitt.) Paris) covered the bottom of Limnopolar Lake. Microbial mats are abundant in Byers Peninsula, confined to areas where liquid water was present for weeks to months each year. Their main constituents were non-heterocystous filamentous cyanobacteria, identified as morphotypes of Oscillatoriales, corresponding to the genera Phormidium, Oscillatoria, Lyngbya, and Leptolyngbya, with large differences in their relative abundance and mat structure between locations. Diatoms were scarce in this mat, but they are common in others.
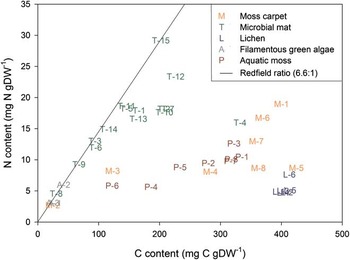
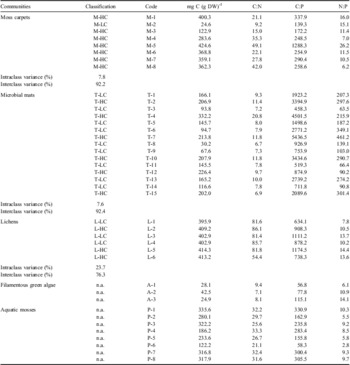
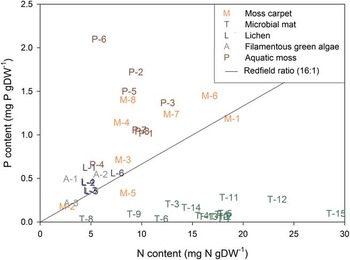
Carbon content for the entire dataset (n = 40) ranged from 24.6–424.6 mg C (g DW)-1. Nitrogen content in the biomass ranged from 2.67–29.13 mg N (g DW)-1 and P from 0.03–2.10 mg P (g DW)-1 (Figs 2 & 3). Biomass C:N gravimetric ratios varied widely over the studied communities from 6.66–86.14, and showed that the microbial mats and the filamentous algal felts were similar in N content to the moss carpets with correspondingly lower C:N ratios (9.6 and 8.2 on average, respectively) due to the relatively high C content in moss carpets. However, lichens had a low N content with high C:N ratios (78.5 on average) (Table I & Fig. 2). The C:P ratios varied from 56.85–5436.55 (Table I) and N:P ratio differentiates microbial mats from the rest of the communities and organisms of the watershed, because they present lower P contents (Table I & Fig. 3) in comparison with the N content (N/P: 209.2 on average on microbial mats, and one order of magnitude lower in the other communities). Mosses, both carpets and sub-aquatic, showed the lowest N:P ratio (7.6 and 12.98 on average, respectively) indicating a relatively high P and low N contents (Table I).
Contents of C and N in the watershed biomass features. Line represents the Redfield ratio.

C:N:P ratios in biomass patches (gravimetric ratio) and their assignation to C content groups. DW = dry weight, LC = low ash-free carbon content, HC = high ash-free carbon content. Classification was performed by k-means analysis (n.a. = not analysed).

Contents of N and P in the watershed biomass features. Line represents the Redfield ratio.

The cyanobacterial mats were typically between 3 and 6 mm thick, and some different communities could be distinguished based on their surface coloration. For example, in a short section of a temporary stream, five different community types were clearly identified, but were dominated by orange and purple coloured communities (identified as T2 in Fig. 1). In slow flowing waters over gentle slopes or flat surfaces, these latter two community types formed expanses of up to several hundred square metres in extent. The orange community typically appeared at the sites where liquid water persisted, such as small pools or ponds, and this was of a leathery consistency with a smooth surface. It was dominated by a Phormidium morphotype of 3–4 μm width, but also contained many diatoms and heterotrophic organisms. In contrast, the purple community was more brittle and of non-uniform surface, following the microtopography of the gravel underneath. Its matrix was formed by narrow cyanobacterial trichomes (< 1 μm) referable to the genus Leptolyngbya, but had a striking diversity of cyanobacteria, containing morphotypes attributable to the genera Schizothrix, Gloeocapsa and Nostoc. Carbon, more precisely ash-free carbon content, was the element that discriminated better among microbial mats. Statistical analysis (k-means) divided them into four different groups. Most of the mats had low C content (denoted as TLC), and belonged to three groups with centroids of 105.3, 157.9, and 164.4 mg C (g DW)-1. The rest of the mats considered had high C content and belonged to one group, whose centroid was 205.3 mg C (g DW)-1, denoted as THC (Table I). The moss carpets in the watershed were also distributed into three groups, according to their average C content. Two of the groups showed high C content (denoted as MHC) with centroids of 311.8 and 381.2 mg C (g DW)-1, and one group had low C content (indicated as MLC) with the group centroid of 24.6 mg C (g DW)-1 (Table I). Lichens were also separated into two different groups, high and low C content. These were denoted as LHC and LLC respectively in Table I. Groups of higher C content of both microbial mats and moss carpets were found at the lowest locations of the basin (Fig. 1).
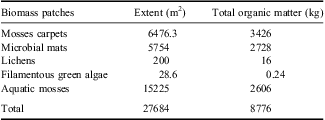
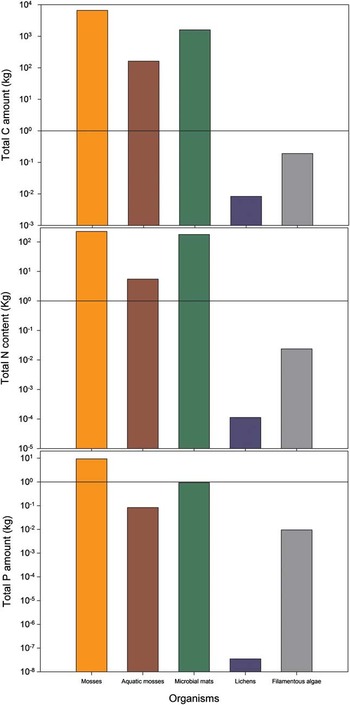
The total area covered by biomass in the catchment is 4.78% (0.028 km2), and this constitutes 8776 kg of ash-free organic matter (Table II). The largest standing stock of biomass in the watershed (as dry weight) is as moss carpets, followed by microbial mats and aquatic mosses (Table II). The terrestrial communities formed by moss carpets, lichens, and cyanobacterial mats represented 70% of the biomass in the watershed, but contained 98% of the total N and P. Microbial mats and terrestrial mosses represented similar biomass content and surface area (both c. 1%). Aquatic mosses covered a larger surface area than the semi-terrestrial communities (Table II), but represented lower proportion of biomass and only 1.3 and 0.8% content of N and P, respectively. By elements, 98% of the biological C in the watershed is associated with mosses and microbial mat structures (79.1 and 19.0% respectively), 98.7% of the N is distributed within moss carpets, microbial mats, and lichens (55.2, 43.5 and 3.37 x 10⁻⁷% respectively), while 90.2% of P is within moss carpets structures. Our data clearly show that C, N, and P vary significantly within different classes of biomass (Fig. 4). The total amount of C, N, and P in the organisms of the watershed is more than 8356.3, 410 and 10.4 kg respectively, distributed as shown in Fig. 4, but areas with no visible vegetation were not analysed.
Total organic matter content and the areas covered by the different communities found in the watershed of Limnopolar Lake.

C, N and P log distribution across the different features sited in the Limnopolar Lake watershed.

Discussion
The moist terrestrial systems from Byers Peninsula often showed thick microbial mats similar to those found in other Maritime Antarctic lakes from King George Island (Vinocur & Pizarro Reference Vinocur and Pizarro2000) and Signy Island (Heywood Reference Heywood1967). Cyanobacteria-dominated microbial mats are thought to be responsible for much of the primary production in extreme polar environments (Tang et al. Reference Tang, Tremblay and Vincent1997, Vincent Reference Vincent2000). In this study, representative samples of all types of macroscopic biomass found in the watershed were analysed to determine distribution of C, N, and P within organic components of the landscape, to provide insights into the nutritional status, and of potential sources and sinks of nutrients to Limnopolar Lake. The biota present in apparently bare soils plays an important role in the elemental cycles within catchments (Yergeau & Kowalchuk Reference Yergeau and Kowalchuk2008), and as this has not been considered here, the results presented in this article should be considered as minimum values.
Moss carpets and microbial mats, both very conspicuous on Byers Peninsula, potentially act as nutrient traps, intercepting flowing water and particles during periods of overland water flow. The extent to which these trapped nutrients are released during the short summers is not known, but in Byers Peninsula, as in other Maritime Antarctic locations, precipitation as snow and rain is relatively high and may wash mosses and mats into the surface and permafrost water networks, finally reaching lakes (authors’ observation), potentially resulting in a nutrients input.
Considering the perennial organisms, lichens represent less than 0.0001% of the CNP total amount contained in biological elements from the watershed. This is negligible compared to the moss carpets and microbial mats that represented 74.8% and 23.8% of the CNP biological compartments. However, at higher latitudes, lichens represent most of the terrestrial biomass when mosses are absent (Hodgson et al. Reference Hodgson, Convey, Verleyen, Vyverman, McInnes, Sands, Fernández-Carazo, Wilmotte, De Wever, Peeters, Tavernier and Willems2010, Green et al. Reference Green, Sancho, Tuerk, Seppelt and Hogg2011).
Organic C concentrations and chemical composition are critical for the bacterial activities in the ecosystems, and particularly relevant for polar ecosystems, where biological activities remain limited to short periods. Some aquatic ecosystems in polar regions seem to be mainly controlled by bacterial activities, based on allocthonous C, because organic C entry by autochthonous primary productivity is extremely low in most ultra-oligotrophic lakes (Camacho Reference Camacho2006). However, bacterial production in some cases does not seem to be limited by the amount of C, but by the environmental conditions (e.g. low temperatures). Consequently, C and other nutrients such as organic N accumulate in solution, reaching concentrations of up to three orders of magnitude higher than the concentrations of the inorganic counterparts (Fernández-Valiente et al. Reference Fernández-Valiente, Quesada, Howard-Williams and Hawes2001). In those cases, the ecological dynamics will depend upon the turnover rates and on the recycling capabilities of the communities. Although the recycling dynamics of organic C, N, and P are subjected to quite different processes, such as respiration, denitrification, or organic phosphorus degradation by alkaline phosphatase, the availability of the most limiting element will be critical for the ecological processes (Lajtha & Schlesinger Reference Lajtha and Schlesinger1988, Sorensen et al. Reference Sorensen, Jonasson and Michelsen2006). On Byers Peninsula, P seems to be the most limiting element because of the extremely low values and high C:N:P ratios in the biomass. The maximum exponent is microbial mats that seem to be extremely poor in P, while N is extremely limiting in lichens and mosses, probably because N2 fixers have limited opportunities to increase available N in the soils with scarce liquid water (Vitousek & Farrington Reference Vitousek and Farrington1997).
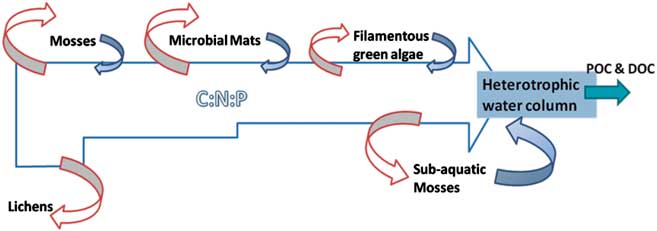
In a black-box approach to the different communities assayed, all elements’ budgets show their relevance as a continuum throughout the watershed. Here, we propose a conceptual model with the possible inputs and outputs from the main features of a Maritime Antarctic watershed (Fig. 5). The model aims to highlight the losses of C, N, and P through the watershed that are assimilated by the organisms in their biological structures, and thus retired from the water network operating on decadal to millennial timescales. Thereafter, rough biomass estimations from the water column of Limnopolar Lake show a total of c. 1 kg of organic matter in the lake, considering a mean chlorophyll a concentration of 0.1 μg l-1 (Toro et al. Reference Toro, Camacho, Rochera, Rico, Bañón, Fernández-Valiente, Marco, Justel, Avendaño, Ariosa, Vincent and Quesada2007). This estimation is in the range of the organic matter amount of the seasonal filamentous green algae (Table II), and thus could represent the same amount of biomass standing stock as the whole water column, excluding the benthos, but occupying a much smaller surface (< 0.1%). Low degradation rates due to low temperatures and the chemical nature of some organic matter and the perennial profile of moss carpets, lichens, and microbial mats may lead to the accumulation of large amounts of different elements that can be slowly liberated and reach the aquatic ecosystems as lakes. That highlights the pivotal role of the temporary filamentous green algae that eventually could reach the lake's outlet, probably acting as a CNP sink, removing large amounts of nutrients from the watershed, in spite of the negligible area that they occupy within the catchment.
Conceptual model of the Limnopolar Lake watershed continuum. It shows the main runoff of C, N, and P that flows through the watershed, and relative amount that is kept as biomass. Red arrows show C, N, and P possible inputs to every feature of the community, and their size represents its estimated relevance. Blue arrows show possible outputs from every feature of the community and their estimated relevance. Here the output from lichens is considered negligible. Partuculate organic carbon (POC) and dissolved organic carbon (DOC) blue arrow is the flow through lake's outlet.
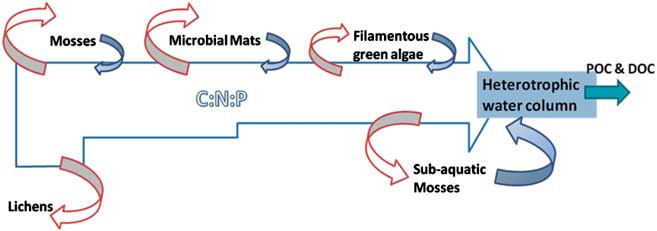
Biomass patches across the watershed are intimately related to the water network (Fig. 1) because, in polar regions, one of the limiting factors is the availability of liquid water. Therefore, it is in the watercourses or water accumulations as snow, ponds, or pools where most biomass accumulates, together with nutrients that have been retained and then released from the biomass. Both this particulate matter and the dissolved matter will eventually be transported, and will reach the higher retention time water bodies (e.g. lakes) influencing its biota, and representing a far from negligible contribution in these ultra-oligotrophic ecosystems (Vincent et al. Reference Vincent, Castenholz, Downes and Howard-Williams1993). This is the first time, to the authors’ knowledge, that the complete biomass and elemental composition has been described at a watershed level in a polar region and compared with the lake standing stock.
Some other nutrient inputs, both wind-driven, particulate matter and aerosols, and nutrients in precipitation have been considered major nutrient contributions for lakes in continental Antarctica (Howard-Williams et al. Reference Howard-Williams, Priscu and Vincent1989), but in Maritime Antarctica the relatively rich terrestrial or semi-terrestrial vegetation can represent an important input of nutrients into the aquatic ecosystems (Davey Reference Davey1993a, Reference Davey1993b). The overall contribution of communities sited near the lakeshore to biogeochemistry of the watershed ecosystem may act as temporary sinks of organic compounds as it has been described for the biogeochemical processes in the McMurdo Dry Valleys (Barrett et al. Reference Barrett, Virginia, Lyons, McKnight, Priscu, Doran, Fountain, Wall and Moorhead2007 and references therein).
In conclusion, C, N, and P concentrations are high across the catchment, considering its polar location, but P is probably the limiting nutrient. A slight increase in P concentration, via bird deposition, for instance, could stimulate primary production and probably overcome the lake trophic status by the legacies from the catchment, mainly by runoff transportation of nutrients. In this way, aquatic ecosystems, including lakes, may act as excellent integrators and sentinels of changes taking place at the catchment level.
Acknowledgements
We are extremely grateful to all the members of the LIMNOPOLAR project. This work was funded by the Ministerio de Ciencia e Innovación (Spain) through the grants CGL2005-06549-C02-01/ANT and CTM2011-12973-E. This project could not have been done without the generous help provided by the Unidad Técnica Marina (UTM) and the Spanish Navy crew of Las Palmas. Also, the authors would like to thank and recognize the work of the two anonymous reviewers to improve the manuscript.