Implications
Carcass weight is increased by the use of sires of higher genetic merit for growth or by delaying slaughter date. These approaches have different effects on feed intake and carcass traits. Increased genetic merit for growth has no effect on feed intake or efficiency, whereas delaying slaughter increases feed intake and reduces efficiency. Carcass and muscle composition are unaffected by genetic merit for growth, whereas delaying slaughter reduces muscle proportion and increases fat proportion in the carcass. Delaying slaughter also reduces moisture proportion and increases lipid proportion in the muscle. Thus, use of sires with higher genetic merit for growth facilitates an increase in carcass weight with no change in carcass or muscle composition.
Introduction
In Ireland, about 50% of all dairy cows are bred to beef bulls (AIM Bovine Statistics Report, 2008). As dairy cross calves do not meet the conformation standard for the high-value live export trade to the continental European Union they are reared to slaughter in Ireland and carcass weight is the main determinant of carcass value.
To assist producers in the selection of sires that will increase the profitability of their enterprise, the Irish Cattle Breeding Federation (ICBF) undertakes and publishes genetic evaluations for a range of performance traits on all the main cattle breeds (including pure dairy breeds) used for beef production in Ireland. Genetic evaluations are carried out on an across-breed basis and production traits are individually weighted by their monetary value to produce a single aggregated economic value for beef genetic merit (Amer et al., Reference Amer, Simm, Keane, Diskin and Wickham2001). Carcass weights for all commercially slaughtered cattle (including culled cows) are captured in a central database and are used in the ICBF genetic evaluation programme as the measure of lifetime growth rate. Breeding value for carcass weight is derived using a multi-trait animal model and expressed as the expected progeny difference for carcass weight (EPDCWT), estimated as a deviation from a common base carcass weight for Holstein–Friesian steers (Campion et al., Reference Campion, Keane, Kenny and Berry2009a). Age at slaughter, among other factors, is adjusted for in the model as a fixed effect. All other EPDs are similarly expressed as deviations from a common base.
Generally, but not universally, the relationship between the EPD for a trait and measured performance for that trait is positive. Basarab et al. (Reference Basarab, Milligan and Stitt1994) found that in straight-bred Herefords a 1 kg change in birth weight EPD corresponded to a 1.06 kg change in actual birth weight, while a 1 kg change in weaning or yearling weight EPD corresponded to 0.45 and 0.78 kg changes in 200-day and 365-day live weights, respectively. Similarly, Nunez-Dominguez et al. (Reference Nunez-Dominguez, Van Vleck and Cundiff1993) reported EPD regressions (kg/kg) on birth, weaning and yearling weights of 1.04, 0.88 and 1.40, respectively. In Ireland, Keane and Diskin (Reference Keane and Diskin2007), using an earlier within-breed genetic evaluation system, found that a change in EPD for carcass weight matched the observed change in carcass weight. They also drew attention to the fact that while EPDCWT is a constant, measured carcass weight differences are a function of overall growth rate and age at slaughter. To date, the ICBF beef genetic index and its components have not been widely evaluated. Clarke et al. (Reference Clarke, Drennan, McGee, Kenny, Evans and Berry2009) compared progeny from beef cows of high and low Beef Carcass Index (BCI). This is an aggregate index comprising weaning weight, feed intake, carcass weight, carcass conformation class and carcass fat class. Dry matter (DM) intake or live weight (LW) gain during finishing did not differ significantly with BCI, but the high BCI calves were heavier at weaning and at slaughter. Regressions of measured traits on the corresponding EPD components of BCI showed that live weight, but not LW gain or carcass weight gain, was positively related to EPD for weaning weight and carcass weight. Feed intake was also related to EPD for intake, but carcass conformation class and carcass fat class were not related to the EPDs for these traits.
In a precursor to this study, Campion et al. (Reference Campion, Keane, Kenny and Berry2009a and 2009Reference Campion, Keane, Kenny and Berryb) compared progeny from Holstein–Friesian dairy cows and early Aberdeen Angus (AA) and late Belgian Blue (BB) maturing beef breed sires of high and low EPDCWT. Pure-bred Friesians and Holsteins were also included. There was a beef sire breed × genetic merit interaction for carcass weight. Across the two beef sire breeds, the measured difference in carcass weight approximated to EPDCWT but the effect was greater than predicted for AA and negligible for BB. It is important that these findings be either confirmed or amended on the basis of additional data.
The overall objective of this study was to further evaluate the ICBF beef genetic evaluation system. The specific objectives were (i) to compare growth, feed intake, slaughter traits and carcass traits of progeny of early and late maturing sire breeds, each of low and high EPDCWT; (ii) to ascertain the effect of slaughter weight on these variables; and (iii) to examine possible interactions of breed type, genetic merit and slaughter weight.
Material and methods
Animal source
Male calves from Holstein–Friesian dams and 20 beef sires (9 AA and 11 BB), of either low (L, 8 sires) or high (H, 12 sires) EPDCWT, were sourced from commercial dairy herds in spring 2007. All the calves were from sires that were available through artificial insemination and had high reliability for EPDCWT based on the number of progeny with carcass records in the ICBF database. In total, 139 calves were sourced from 42 dairy herds and transferred to the Grange Beef Research Centre at 2 to 6 weeks of age. Following genotyping for sire verification (International Society of Animal Genetics, 2008), 14 animals with incorrectly identified sires were removed from this study. In addition, over the course of the study, a further seven animals were lost or removed due to mortality or accidents, leaving 118 animals comprising 29 AAL, 29 AAH, 30 BBL and 30 BBH for which complete data were available.
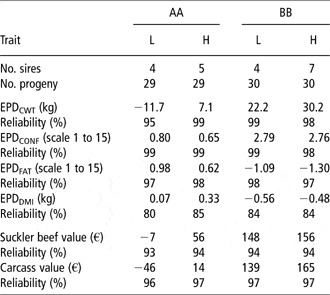
The mean sire EPDs for carcass weight, carcass conformation, carcass fatness, feed intake, suckler beef monetary value and carcass monetary value, together with the corresponding reliabilities, are shown in Table 1. Mean EPDCWT values ranged from −12 kg for AAL to 30 kg for BBH. Within this range, individual bull values ranged from −15 to 52 kg. Mean carcass conformation class varied from 0.80 (AAL) to 2.76 (BBH), whereas mean carcass fat class varied from 0.98 (AAL) to −1.30 (BBH). Other than for feed intake where sire reliabilities were 80% to 85%, sire reliabilities exceeded 95%.
Mean sire estimated genetic merit, expressed as expected progeny difference for carcass weight (EPDCWT), carcass conformation class (EPDCONF), carcass fat class (EPDFAT), daily dry matter intake (EPDDMI), suckler beef value, carcass value, with corresponding reliabilities, weighted by number of progeny per sire for AA and BB bulls of L and H estimated genetic merit for carcass weight

AA = Aberdeen Angus; BB = Belgian Blue; L = low; H = High.
Source: Irish Cattle Breeding Federation genetic evaluations (January, 2008).
Management to start of finishing
After arrival, calves were penned individually and offered a total of 25 kg milk replacer per head over a 56-day period. Calf concentrates (750 g/kg coarsely rolled barley, 170 g/kg soyabean meal, 55 g/kg molasses, 25 g/kg mineral/vitamin pre-mix) were offered up to a maximum of 2 kg per head daily until turnout to pasture on 5 June, and at 1 kg per head daily for 4 weeks afterwards. Each calf received a total concentrate allowance of 100 kg. Hay was continuously available during the indoor rearing period. At pasture, calves preceded yearling steers in a leader/follower rotational grazing system and were treated with ivermectin (Qualimec, Janssen Animal Health, High Wycombe, Buckinghamshire, UK) at 3, 8 and 13 weeks after turnout for the control of gastrointestinal parasites. The calves were castrated on 10 October and were housed for the first winter on 15 November. The duration of the first grazing season was 163 days.
During the first winter, the animals were managed in three groups of 42, 42 and 34, each balanced for breed type, EPDCWT and sire. All were offered grass silage (chemical composition: DM 231 g/kg, in vitro DM digestibility 729 g/kg, crude protein (CP) 149 g/kg, ash 84 g/kg, pH 4.0, Unite Fourragere Viande (UFV, Jarrige, Reference Jarrige1989; O’Mara, Reference O’Mara1996) 0.77) ad libitum and an average of 1.4 kg of cattle concentrates (875 g/kg rolled barley, 65 g/kg soyabean meal, 45 g/kg molasses, 15 g/kg mineral/vitamin pre-mix) per head daily for a 123-day winter period to 18 March when the concentrates were withdrawn. The animals were linear scored (ICBF, 2003) at about 10 months of age by a trained assessor. Skeletal scores (9-point scale) were recorded at three locations and muscular scores (15-point scale) were recorded at four locations. These scores were aggregated to give one overall skeletal and one overall muscular score per animal (Campion et al., Reference Campion, Keane, Kenny and Berry2009a). All animals were turned out to pasture together on 25 March for a second grazing season of 209 days. From early June onwards, they followed calves in a leader/follower rotational grazing system.
Management during finishing
At the end of the second grazing season (20 October), the animals were housed in slatted floor sheds and assigned to one of two slaughter weight groups (560 kg (light) and 620 kg (heavy)) balanced for breed type, genetic merit, previous winter management, LW and sire. Each of these slaughter weight groups were further sub-divided in a ratio of 2 : 1 into animals that were advanced or backwards relative to their target slaughter weight. Those in the advanced category were immediately placed on a finishing diet whereas those in the backwards category were placed on a growing diet until 2 February when they moved to the finishing diet. This was to allow the backward animals a further growing period before finishing. The growing diet consisted of grass silage ad libitum plus 2 kg cattle concentrates per head daily. The finishing diet consisted of a total mixed ration with a grass silage : cattle concentrate ratio of 33 : 67 on a DM basis. It was offered in a slatted floor shed fitted with Calan–Broadbent electronic doors for individual feed recording. The DM intake was recorded daily throughout finishing and feed refusals were discarded twice weekly. The same silage (chemical analysis: DM 204 g/kg, DMD 692 g/kg, CP 133 g/kg, ash 88 g/kg, pH 3.9, UFV 0.73) was used in the growing and finishing diets. The number of animals, mean start of finishing LW, mean slaughter weight and duration of the winter period were 39, 437 kg, 554 kg and 105 days (advanced light), 38, 440 kg, 629 kg and 183 days (advanced heavy), 20, 462 kg, 545 kg and 162 days (backwards light), and 21, 474 kg, 609 kg and 225 days (backwards heavy), respectively.
Slaughter and carcass assessment
Animals were weighed on the day before slaughter and on the morning of slaughter. These weights were averaged to give LW at slaughter (slaughter weight). The animals were transported approximately 130 km to a commercial beef processing plant and slaughtered within 1 h of arrival. Carcasses were dressed according to standard procedures and kill-out proportion was calculated as the proportion of cold carcass weight (hot weight × 0.98) in the slaughter weight. Carcass conformation and fat classes (Commission of the European Communities, 1982) were automatically recorded on a 5-point scale using a video imaging analysis carcass classification machine (VBS2000, E + V, Germany). Within the range ± one-third of a class, this machine had a correspondence with reference panel (three experienced classifiers) values of 100% for conformation class and 97% for fat class (Allen and Finnerty, Reference Allen and Finnerty2000). Perirenal plus retroperitoneal fat weight, together with carcass measurements (DeBoer et al., Reference DeBoer, Dumont, Pomeroy and Weniger1974), were also recorded. Carcass measurements that were taken were carcass length, chest depth, leg length, leg width (maximum width of leg) and leg thickness (width of leg from the medial splitting surface of the symphysis pubis).
After 48 h in the chill at 4°C, the right side of each carcass was quartered between the 5th and 6th ribs into a pistola hind quarter (without the flank) and a fore quarter that included the flank (Keane and Allen, Reference Keane and Allen1998). Both quarters were weighed and the ribs joint (ribs 6 to 10 inclusive) was separated from the pistola by cutting between the 10th and 11th ribs. The musculus longissimus outline at the 10th rib was traced on to translucent paper and the area was subsequently measured using a digital planimeter (Placom KP-90N, Sokkisha, Japan). The ribs joint was weighed and separated into fat, m. longissimus, other muscle, muscle trim and bone (including ligamentum nuchae/supraspinale). A sample of the subcutaneous fat over the 8th rib and a sample (2.5 cm thick) of m. longissimus from the 10th rib were taken for colour measurement. A second sample of m. longissimus was frozen for subsequent chemical analysis.
Colour measurements were carried out using a Hunterlab Ultrascan XE colorimeter (Hunter Associates Laboratory, Inc., Reston, VA, USA). Fat colour measurements were made the day after the samples were taken. The muscle samples were vacuum packaged and stored at 4°C for 12 days (14 days from slaughter). They were then removed from the package, over-wrapped with oxygen-permeable film and permitted to bloom at 4°C for 2 h. Colour measurements were then taken. For both the fat and muscle samples, L (lightness), a (redness) and b (yellowness) values were recorded using a D65 illuminant. Chroma and hue values were calculated and m. longissimus chemical composition was determined according to Dunne et al. (Reference Dunne, Keane, O’Mara, Monahan and Moloney2004).
Statistical analysis
The data were statistically analysed according to the factorial design using mixed model methodology (PROC MIXED) of the Statistical Analysis Systems Institute (SAS, 2008). Up to the start of finishing the fixed effects included in the model were breed type (AA v. BB) and genetic merit (H v. L). For the finishing, slaughter and carcass data, slaughter weight (light v. heavy) was included as a factor, and the model also had a term for the finishing group (backwards or advanced). Management group in the first winter and birth year of dam were included in both models as fixed effects and sire was included as a random effect in both models.
The data are presented as the individual breed type × genetic merit means together with the main effect of slaughter weight as applicable. Where there were interactions with slaughter weight, the individual means are shown in table footnotes. Statistical significance is conventionally indicated (*P < 0.05, **P < 0.01, ***P < 0.001) and where effects approached significance (P > 0.05 but <0.10) the actual P-values are shown.
Results
Live weights and LW gains
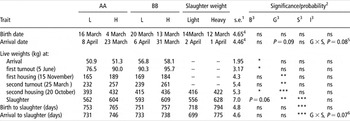
There was no significant difference in birth date between the breed type and genetic merit groups, and neither was there a significant difference between the breed types in date of arrival at the Grange Beef Research Centre (Table 2). However, the low genetic merit animals arrived somewhat (P = 0.09) later than their high merit counterparts (7 April v. 27 March). Arrival weight was not significantly affected by genetic merit, but BB were heavier (P < 0.05) than AA. Thereafter, the BB animals tended to be heavier than AA throughout life but the differences at first housing (187 v. 167 kg) and at the second turnout (259 v. 236 kg) were not statistically significant. There was a LW difference at slaughter of 18 kg (P = 0.06) in favour of BB. From the date of first housing to slaughter, the high-merit animals were significantly heavier than their low-merit comrades. The differences at the first turnout, first housing, second turnout, second housing and slaughter were 9, 21, 24, 30 and 29 kg, respectively. No breed type × genetic merit interaction was detected for any of the live weights. Days from birth to slaughter and days from arrival to slaughter did not differ significantly for the breed types or genetic merits.
Mean birth and arrival dates and mean live weights from arrival to slaughter for steer progeny of Holstein–Friesian dams and AA and BB sires of L and H estimated genetic merit for carcass weight

AA = Aberdeen Angus; BB = Belgian Blue; L = low; H = high.
1Pooled standard error (s.e.) for main effect in this and subsequent tables.
2Where P < 0.1 and >0.05, the P-value is shown, otherwise *P < 0.05, **P < 0.01, ***P < 0.001, ns P > 0.1 in this and subsequent tables.
3In this and subsequent tables B (Breed) = AA v. BB, G (Genetic merit) = L v. H, S (Slaughter weight) = Light v. Heavy, I = Interaction.
4Calculated on the number of days after 1 January.
510 April, 4 April, 25 March and 29 March for L Light, L Heavy, H Light and H Heavy, respectively.
6Values of 691, 773, 707 and 777 for L Light, L Heavy, H Light and H Heavy, respectively.
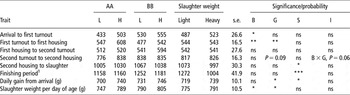
Daily LW gain from arrival to the first turnout was higher (P < 0.05) for BB than AA but the opposite was so (P < 0.01) from first turnout to first housing (Table 3). Thereafter to slaughter, there was no significant difference between the breed types in daily LW gain. However, slaughter weight per day of age was higher (P < 0.05) for BB. Daily LW gain was higher for the high-merit animals in the period from first turnout to first housing (P < 0.01) and from arrival to slaughter (P < 0.05). Slaughter weight per day of age was also higher (P < 0.05) for the high-merit animals. There was a breed type × genetic merit interaction (P = 0.06) for daily gain during the second grazing season because of a higher value for the high-merit AA but not for the high-merit BB. From the second housing to slaughter (P < 0.05) and during the finishing period (P < 0.001), daily LW gains were higher for the light than for the heavy slaughter weight group. However, daily gain from arrival to slaughter was higher (P < 0.05) for the heavy slaughter weight group.
Lifetime live weight gains (g/day) for steer progeny of Holstein–Friesian dams and AA and BB sires of L and H estimated genetic merit for carcass weight

AA = Aberdeen Angus; BB = Belgian Blue; L = low; H = high.
1From start of finishing to slaughter.
See also Table 2 footnotes.
Feed intake during finishing
Feed intake during finishing is shown in Table 4. Total DM intake did not differ between AA and BB, or between L and H, but was greater (P < 0.001) for the heavy than for the light slaughter weight group. UFV intake paralleled DM intake. As there were differences between the groups in mean LW during the finishing period there were differences in DM intake per kg mean LW with BB, H and the heavy slaughter weight categories having lower (P < 0.001) values than AA, L and the light slaughter weight categories, respectively. Efficiency of utilisation of UFV for LW gain (g LW gain per UFV) was not significantly affected by genetic merit but it tended (P = 0.09) to be better for BB than AA (119 v. 111 g/UFV) and was better (P < 0.001) for the light than for the heavy slaughter weight group.
DMI, UFV intake and efficiency of UFV utilisation during finishing for steer progeny of Holstein–Friesian dams and AA and BB sires of L and H estimated genetic merit for carcass weight

DMI = Dry matter intake; UFV = Unite Fourragere Viande (Jarrige, Reference Jarrige1989), values of 1.12 and 0.73 UFV/kg DM for concentrates and silage, respectively; AA = Aberdeen Angus; BB = Belgian Blue; L = low; H = high; LW = Live weight.
See also Table 2 footnotes.
Skeletal and muscular scores
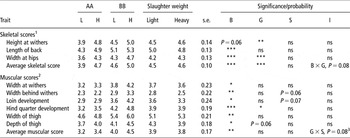
All skeletal and muscular scores were significantly greater (P = 0.06 for height at withers) for BB than AA (Table 5). Other than length of back, which was not different, all skeletal scores were significantly greater for H than L. Muscular scores, other than hind quarter development, which was greater for H, were not significantly affected by genetic merit. There was a breed type × genetic merit interaction (P = 0.08) for average skeletal score due to a greater difference between L and H for AA than BB. There was also a genetic merit × slaughter weight interaction (P = 0.08) for average muscular score due to a greater difference between L and H at the light than at the heavy slaughter weight.
Mean skeletal and muscular scores at 10 months of age for steer progeny of Holstein–Friesian dams and AA and BB sires of L and H estimated genetic merit for carcass weight

AA = Aberdeen Angus; BB = Belgian Blue; L = low; H = high.
1Range 1 (short/narrow) to 9 (long/wide).
2Range 1 (hollow or poorly muscled) to 15 (bulging/thick muscled).
3Values of 3.6, 3.7, 4.1 and 3.8 for L Light, L Heavy, H Light and H Heavy, respectively.
See also Table 2 footnotes.
Slaughter traits
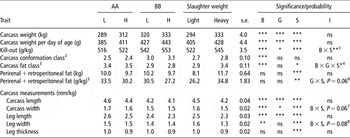
Carcass weight and carcass weight per day of age were significantly affected by breed type, genetic merit and slaughter weight but no interactions were detected (Table 6). Carcass weight of BB was 26 kg heavier (P < 0.001) than for AA, whereas carcass weight of the H animals was 18 kg heavier (P < 0.001) than for the L animals. There were corresponding breed type and genetic merit differences in carcass weight per day of age. The carcass weight difference between the light and heavy slaughter weight groups was 39 kg (P < 0.001). Kill-out proportion was higher for BB than AA (P < 0.001), for H than L genetic merit (P < 0.05), and for the heavy than for the light slaughter weight group (P < 0.001). There was a breed type × slaughter weight interaction (P < 0.01) for kill-out proportion due to a greater difference between the slaughter weight groups for AA than BB. Carcass conformation class was better (P < 0.001) for BB than AA but was unaffected by either genetic merit for carcass weight or slaughter weight. Carcass fat class was lower (P < 0.001) for BB than AA, was unaffected by genetic merit for carcass weight, and was higher (P < 0.05) for the heavy than for the light slaughter weight group. There was a breed type × genetic merit × slaughter weight interaction (P < 0.05) for carcass fat class because of a smaller difference between the light and heavy slaughter weight groups for BBH than for the other groups. Both perirenal plus retroperitoneal fat weight, and its proportion of carcass weight, were unaffected by breed type and genetic merit, but both were significantly greater for the heavy than for the light slaughter weight. There was a genetic merit × slaughter weight interaction (P = 0.06) for perirenal plus retroperitoneal fat proportion because of a greater difference between L and H for the light than for the heavy slaughter weight group.
Slaughter traits and carcass measurements for steer progeny of Holstein–Friesian dams and AA and BB sires of L and H estimated genetic merit for carcass weight

AA = Aberdeen Angus; BB = Belgian Blue; L = low; H = high; EU = European Union.
1Values of 505, 534, 539 and 556 for AA light, AA heavy, BB light and BB heavy, respectively.
2EU beef carcass classification scheme: scale 1 (poorest) to 5 (best).
3EU beef carcass classification scheme: scale 1 (leanest) to 5 (fattest).
4Values of 3.2, 3.6, 3.2, 3.8, 2.5, 3.2, 2.7 and 2.9 for AAL light, AAL heavy, AAH light, AAH heavy, BBL light, BBL heavy, BBH light and BBH heavy, respectively.
5Of carcass.
6Values of 26.5, 37.4 25.8 and 32.2 for L light, L heavy, H light and H heavy, respectively.
7Values of 1.7, 1.5, 1.5 and 1.4 for AA light, AA heavy, BB light and BB heavy, respectively.
8Values of 1.6, 1.3, 1.5 and 1.3 for AA light, AA heavy, BB light and BB heavy, respectively.
See also Table 2 footnotes.
Scaled for carcass weight, all carcass measurements except leg thickness were significantly lower for BB than AA. Similarly, all carcass measurements, except leg width and leg thickness, which were similar, were significantly lower for H than L. All carcass measurements scaled for carcass weight were lower (P < 0.001) for the heavy than for the light slaughter weight group. There were breed type × slaughter weight interactions for both carcass width (P = 0.06) and leg width (P = 0.08) scaled for carcass weight due to a greater decrease from the light to the heavy slaughter weight for AA than BB.
Carcass traits
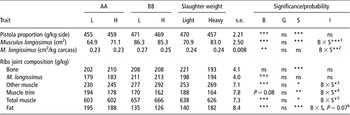
The effects of breed, genetic merit and slaughter weight on hind quarter proportion, m. longissimus area and ribs joint composition are shown in Table 7. Hind quarter proportion was higher (P < 0.001) for BB than AA and for the light than for the heavy slaughter weight group, but there was no effect of genetic merit on hind quarter proportion. The m. longissimus area was greater (P < 0.001) for BB than AA and for the heavy than for the light slaughter weight group but again there was no effect of genetic merit. When m. longissimus area was scaled for carcass weight, breed effect persisted but slaughter weight effect disappeared. There were significant breed × slaughter weight interactions for both m. longissimus area (P < 0.001) and m. longissimus area scaled for carcass weight (P < 0.01) due to a greater increase from the light to the heavy slaughter weight for BB than AA.
Carcass traits and ribs joint composition for steer progeny of Holstein–Friesian dams and AA and BB sires of L and H estimated genetic merit for carcass weight

AA = Aberdeen Angus; BB = Belgian Blue; L = low; H = high.
1Values of 65.1, 70.9, 76.6 and 95.0 for AA light, AA heavy, BB light and BB heavy, respectively.
2Values of 0.24, 0.22, 0.25 and 0.27 for AA Light, AA Heavy, BB Light and BB Heavy, respectively.
3Values of 223, 251, 283 and 287 for AA Light, AA Heavy, BB Light and BB Heavy, respectively.
4Values of 206, 165, 170 and 162 for AA Light, AA Heavy, BB Light and BB Heavy, respectively.
5Values of 614, 591, 662 and 661 for AA Light, AA Heavy, BB Light and BB Heavy, respectively.
6Values of 166, 218, 115 and 146 for AA Light, AA Heavy, BB Light and BB Heavy, respectively.
See Table 2 footnotes.
Ribs joint bone proportion was not significantly affected by breed type but m. longissimus, other muscle and total muscle proportions were higher (P < 0.001), and fat proportion was lower (P < 0.001) for BB than AA. Ribs joint composition was not affected by genetic merit but bone (P < 0.001), muscle trim (P < 0.01) and total muscle (P < 0.05) proportions were lower, and fat proportion was higher (P < 0.001), for the heavy than for the light slaughter weight group. There were breed type × slaughter weight interactions for proportions of other muscle, muscle trim, total muscle and fat. The muscle proportion interactions (P < 0.05) were due to greater decreases with increasing slaughter weight for AA than BB, whereas the fat proportion interaction (P = 0.07) was due to a greater increase with increasing slaughter weight for AA than BB.
Muscle traits
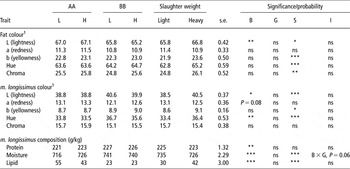
Subcutaneous fat and m. longissimus colour data, together with m. longissimus chemical composition, are shown in Table 8. Other than L (lightness) value, which was lower (P < 0.01) for BB, there was no effect of breed type or genetic merit on subcutaneous fat colour values. However, slaughter weight did affect subcutaneous fat colour values with significantly higher L (lightness), b (yellowness), chroma and hue values for the heavy than for the light slaughter weight group. M. longissimus had higher L (lightness; P < 0.05) and hue (P < 0.01) values for BB than AA and tended (P = 0.08) to have a lower a (redness) value. L (lightness; P < 0.001), b (yellowness; P < 0.05) and hue (P < 0.001) values for m. longissimus were also higher for the heavy than for the light slaughter weight group but were unaffected by genetic merit. There were no statistically significant interactions between the main effects for any colour traits measured.
Subcutaneous fat colour and m. longissimus colour and chemical composition for steer progeny of Holstein–Friesian dams and AA and BB sires of L and H estimated genetic merit for carcass weight

AA = Aberdeen Angus; BB = Belgian Blue; L = low; H = high.
1Hunterlab values; L (lightness) scale 0 (black) to 100 (white), a (redness) scale+(red) to – (green), b (yellowness) scale+(yellow) to – (blue), Hue = [tan−1 (b/a)] × [180/ π], Chroma (saturation/colour intensity) = √(a2 + b2).
See also Table 2 footnotes.
M. longissimus chemical composition was significantly affected by both breed type and slaughter weight but not by genetic merit. BB had higher protein (P < 0.01) and moisture (P < 0.001) concentrations, and a lower (P < 0.001) lipid concentration, than AA, whereas the heavy slaughter weight animals had a lower (P < 0.001) moisture concentration and a higher (P < 0.001) lipid concentration than the light slaughter weight animals. There was a breed type × genetic merit interaction (P = 0.06) for moisture concentration, which was higher for AAH than AAL but not for BBH compared with BBL.
Discussion
Context of study
This study was comparable with those of Campion et al. (Reference Campion, Keane, Kenny and Berry2009a and Reference Campion, Keane, Kenny and Berry2009b) insofar as it evaluated the effects of sire estimated genetic merit for carcass weight on a range of production and carcass traits. However, it differs from those of Campion et al. (Reference Campion, Keane, Kenny and Berry2009a and Reference Campion, Keane, Kenny and Berry2009b) in that it did not include dairy strains, carcasses were not completely dissected and m. longissimus chemical composition was measured. Twelve of the 20 sires used in this study were common to the studies of Campion et al. (Reference Campion, Keane, Kenny and Berry2009aand Reference Campion, Keane, Kenny and Berry2009b).
The AA and BB sire breeds were specifically chosen for the study because they represent extremes in fatness (at a fixed age/weight), carcass conformation and muscling (Kempster et al., Reference Kempster, Cooke and Southgate1982; Keane, Reference Keane2002). These traits may be differentially affected by changes in EPDCWT. Progeny of these sire breeds are readily available from Irish dairy farms as AA is the beef breed of choice for crossing on dairy cows, whereas BB is the second most common late maturing beef breed used in dairy herds (AIM Bovine Statistics Report, 2008). Within both sire breeds, available EPD values for traits other than carcass weight were similar so the measured effects can reasonably be attributed to the difference in EPDCWT.
Live weights and LW gains
As there were no significant differences between the breed types or genetic merit groups in birth or arrival dates these can be eliminated as affecting subsequent production traits. BB were heavier than AA at arrival even though they were on average 4 days younger suggesting heavier birth weights. A similar conclusion can be inferred from the literature. Mee and Dings (Reference Mee and Dings1989) reported that BB sired calves had heavier birth weights than Friesian sired calves, while both Carter (Reference Carter1975) and Everitt et al. (Reference Everitt, Jury, Dalton and Ward1978) showed that Friesian calves were heavier than AA cross calves. The absence of differences between the genetic merit groups in arrival weight suggests no effect of EPDCWT on birth weight. The differences between the breed types in live weights and slaughter weight were similar to these observed by Keane and Drennan (Reference Keane and Drennan2008) and Keane and Moloney (Reference Keane and Moloney2009). From arrival, when the mean LW difference was just 1 kg, live weights of the two genetic merit groups diverged consistently up to 30 kg at the time of the second housing. There was no further divergence during the second winter. This pattern of LW change over time is almost identical to that observed by Campion et al. (Reference Campion, Keane, Kenny and Berry2009a) and similar to that reported by Clarke et al. (Reference Clarke, Drennan, McGee, Kenny, Evans and Berry2009), who studied progeny from Irish beef cows. Unlike previously (Campion et al., Reference Campion, Keane, Kenny and Berry2009a), where breed type by genetic merit interactions for live weights were detected no such interactions were detected in this study, indicating that EPDCWT effects were consistent across the two breed types. The 72 kg greater slaughter weight for the heavy compared with the light slaughter weight group was commensurate with their 76 days greater age.
The absence of significant LW gain differences between AA and BB but the generally higher numerical values for BB, supports previous findings (Keane and Drennan, Reference Keane and Drennan2008; Keane and Moloney, Reference Keane and Moloney2009; Campion et al., Reference Campion, Keane, Kenny and Berry2009a) as does the higher value for slaughter weight per day of age for BB (Keane and Moloney Reference Keane and Moloney2009; Campion et al., Reference Campion, Keane, Kenny and Berry2009a). Although from the end of the first grazing season LW was significantly greater for H than L, significant LW gain differences were not detectable in this period. However, slaughter weight per day of age was significantly greater for H. Campion et al. (Reference Campion, Keane, Kenny and Berry2009a) also found that slaughter weight per day of age was greater for high EPDCWT animals even though the only significant difference in LW gain was during the first grazing season. Thus, the results of all three studies (Clarke et al., Reference Clarke, Drennan, McGee, Kenny, Evans and Berry2009; Campion et al., Reference Campion, Keane, Kenny and Berry2009a and this study) that have evaluated the Irish beef genetic evaluation system agree that genetic merit for growth, as measured by EPDCWT, is more strongly expressed early in life than during finishing.
The lower LW gain during finishing for the heavy than for the light slaughter weight group reflects the decline in LW gain that occurs with increasing length of finishing period (Keane et al., Reference Keane, Drennan and Moloney2006). Campion et al. (Reference Campion, Keane, Kenny and Berry2009a) also reported a lower finishing LW gain for animals taken to a heavier slaughter weight. The higher daily gain from arrival to slaughter for the heavy slaughter weight group may appear at variance with their lower LW gain during finishing compared with the light slaughter weight group. This is explained by the fact that LW gain during finishing was higher than observed in earlier production phases. Thus, the longer finishing period of higher LW gain for the heavy slaughter weight group, when averaged over the entire period from arrival to slaughter, more than offset the higher LW gain over the shorter finishing period for the light slaughter weight group.
Feed intake
The absence of any difference between AA and BB in daily DM intake, together with the lower DM intake per kg LW for BB, agrees with the findings of Campion et al. (Reference Campion, Keane, Kenny and Berry2009a). However, while the latter observed no significant effect of genetic merit on DM intake, in this study, H had a lower DM intake per kg LW than L. The decrease in DM intake per kg LW with increasing slaughter weight has been reported previously (Keane et al., Reference Keane, Drennan and Moloney2006; Campion et al., Reference Campion, Keane, Kenny and Berry2009a) as has the decrease in efficiency of net energy utilisation for LW gain (Andersen, Reference Andersen1975; Bailey et al., Reference Bailey, Liboriussen, Andersen and Bech Andersen1985). Measured mean daily DM intake did not closely reflect the mean EPDDMI value for the breed effect but did for the genetic merit effect. The measured mean breed effect was 0.17 kg DM/day compared with a mean EPDDMI value of 0.72 kg/day, and the measured mean genetic merit effect was 0.06 kg/day compared with a mean EPDDMI value of 0.17 kg/day. Similar findings were reported by Campion et al. (Reference Campion, Keane, Kenny and Berry2009a). As feed intake is a function of LW it would seem that EPDDMI value should either be scaled for LW or specified to a LW range.
Skeletal and muscular scores
The greater skeletal and muscular linear scores of BB compared with AA would be expected given the well-documented greater muscularity of the BB breed (Cuvelier et al., Reference Cuvelier, Cabaraux, Dufrasne, Clinquart, Hocquette, Istasse and Hornick2006) and they were also heavier. Campion et al. (Reference Campion, Keane, Kenny and Berry2009a) evaluated various body measurements together with linear scores. Both skeletal and muscular scores were generally greater for BB than AA, whereas body measurements per kilogram LW were greater for AA. The differences between the genetic merit groups in skeletal scores paralleled the breed differences, in that the high genetic merit animals were heavier and had higher scores. Campion et al. (Reference Campion, Keane, Kenny and Berry2009a) also found a genetic merit effect for average skeletal score but not for muscular score. The absence of differences between the genetic merit groups in muscular scores (other than hind quarter development) contrasts with the clearly evident breed differences.
Slaughter traits
The 26 kg extra carcass weight for BB over AA is mid-way between the values of 30 kg (Keane and Drennan, Reference Keane and Drennan2008) and 22 kg (Keane and Moloney, Reference Keane and Moloney2009) reported previously for the same breed types. Campion et al. (Reference Campion, Keane, Kenny and Berry2009a) reported differences between AA and BB of 20 and 50 kg for high and low EPDCWT animals, respectively. The 29 g/kg difference between AA and BB in kill-out proportion is identical to that observed by Campion et al. (Reference Campion, Keane, Kenny and Berry2009a) and similar to the values of 24 g/kg (Keane and Drennan, Reference Keane and Drennan2008), 19 g/kg (Keane and Moloney, Reference Keane and Moloney2009) and 24 g/kg (Keane and Drennan, Reference Keane and Drennan2009) reported previously. The differences between AA and BB in carcass conformation and fat classes are also similar to values reported previously (Keane and Drennan, Reference Keane and Drennan2008 and Reference Keane and Drennan2009; Keane and Moloney, Reference Keane and Moloney2009). The lower values for all carcass measurements except leg thickness for BB compared with AA, indicate greater carcass compactness for BB and support earlier findings (Keane and Drennan, Reference Keane and Drennan2008 and Reference Keane and Drennan2009; Keane and Moloney, Reference Keane and Moloney2009; Campion et al., Reference Campion, Keane, Kenny and Berry2009a).
The carcass weight superiority for H over L of 23 kg for AA and 13 kg for BB compare with corresponding EPDCWT values of 19 and 8 kg, respectively. When carcass weight is the measure of life-time growth rate (as in the ICBF beef genetic index), it is theoretically possible that all of the difference in carcass weight arising from a difference in EPDCWT, could be due to a difference in kill-out proportion. Keane and Diskin (Reference Keane and Diskin2007) estimated that about one-third of the extra carcass weight from higher sire EPDCWT was due to a higher kill-out proportion and Campion et al. (Reference Campion, Keane, Kenny and Berry2009a) reported a superior (P = 0.06) kill-out proportion for higher EPDCWT animals. These findings suggest that animals of higher genetic merit for carcass weight may have a higher kill-out proportion, and that the entire EPDCWT effect may not be reflected in live weight. The proportions of the carcass weight differences between L and H due to differences in kill-out proportion in this study were about 15% for AA and 55% for BB.
The absence of differences between H and L in carcass conformation and fat classes suggests that EPDCWT has no effect on carcass classification grades. Although this would be expected at constant carcass weight, it is of interest to compare the effects of an increase in carcass weight attributable to higher EPDCWT with that due to later slaughter. Within breed type, carcass conformation class normally increases with increasing carcass weight (Steen and Kilpatrick, Reference Steen and Kilpatrick1995; Keane et al., Reference Keane, Drennan and Moloney2006). Although in this study the increase (0.16 class) in carcass conformation class from the light to the heavy slaughter weight was not statistically significant, the numerical increase for a fixed increment of carcass weight was greater for the slaughter weight effect than for the genetic merit effect (0.041 v. 0.028 class per 10 kg carcass weight).
In contrast to carcass conformation class, carcass fat class did differ significantly for the light and heavy slaughter weight groups. Across the two breed types, the carcass fat class increase per 10 kg increase in carcass weight was 0.118 due to heavier slaughter weight compared with 0.022 due to higher EPDCWT. This suggests that the onset and/or rate of fattening were retarded (relative to carcass weight) in the higher genetic merit animals, and that both genetic groups were of similar fatness at similar ages rather than at similar slaughter weights. For both AA and BB, perirenal plus retroperitoneal fat weight was marginally lower for the H animals even though carcass weight was 18 kg higher. This also suggests delayed fat deposition relative to carcass weight.
Carcass traits
The 13 g/kg greater hind quarter proportion for BB over AA compares with previous values of 18 g/kg (Keane and Drennan, Reference Keane and Drennan2008), 17 g/kg (Keane and Drennan, Reference Keane and Drennan2009), 20 g/kg (Keane and Moloney, Reference Keane and Moloney2009) and 17 g/kg (Campion et al., Reference Campion, Keane, Kenny and Berry2009b). The absence of a difference between the breeds in ribs joint bone proportion also agrees with previous findings (Keane and Drennan, Reference Keane and Drennan2008; Keane and Moloney, Reference Keane and Moloney2009), whereas the higher m. longissimus, other muscle and total muscle proportions, together with the lower fat proportion of BB compared with AA, have been documented previously (Keane and Drennan, Reference Keane and Drennan2008; Keane and Moloney, Reference Keane and Moloney2009; Campion et al., Reference Campion, Keane, Kenny and Berry2009b). It is noteworthy that even though all other muscle proportions were higher for BB, muscle trim proportion tended (P = 0.08) to be higher for AA. This may reflect the greater fragmentation of the AA muscle associated with the removal of the higher proportion of fat, resulting in muscle portions categorised as other muscle for BB being included as trim for AA. The absence of significant effects of genetic merit on pistola proportion, m. longissimus area, ribs joint composition or m. longissimus chemical composition supports the findings of Keane and Diskin (Reference Keane and Diskin2007) and Campion et al. (Reference Campion, Keane, Kenny and Berry2009b).
There are inconsistencies in the literature on whether genetic differences in growth rate should be accompanied by differences in carcass or muscle composition. As the rate of protein accretion is a function of the relative rates of protein synthesis and degradation, more rapidly growing animals should have a higher ratio of synthesis to degradation than slower growing animals (Castro Bulle et al., Reference Castro Bulle, Paulino, Sanches and Sainz2007). However, this would not necessarily result in a higher muscle protein concentration or muscle proportion in the carcass if the higher protein synthesis was matched by higher rates of lipid and mineral deposition in faster growing animals. Castro Bulle et al. (Reference Castro Bulle, Paulino, Sanches and Sainz2007) confirmed a higher rate of protein gain in animals selected for higher growth rate but as fat gain was even higher, the high growth rate animals were actually fatter as indicated by carcass back fat thickness. In contrast, Oddy et al. (Reference Oddy, Herd, McDonagh, Woodgate, Quinn and Zirkler1998) observed that cattle selected for high growth rate had lower rates of both protein synthesis and degradation than those selected for low growth rate. However, both the high and low growth rate lines had similar subcutaneous fatness levels.
As the H animals in this study had heavier carcasses, a difference in carcass composition would be expected due to its association with carcass weight (Keane et al., Reference Keane, Drennan and Moloney2006). Compared with L, the H carcasses were 18 kg heavier, and compared with the light slaughter weight, the heavy slaughter weight carcasses were 39 kg heavier. Thus, if the association of carcass weight and compositional traits was independent of the reason for the carcass weight difference, then the genetic merit effects on carcass composition would be proportional to the slaughter weight effects. This was not so; the effects of an increase in slaughter weight due to later slaughter were much greater than those due to higher EPDCWT. From the light to the heavy slaughter weight, pistola proportion decreased by 13 g/kg. On this basis, a 6 g/kg decrease would be expected due to the higher EPDCWT but there was actually an increase of 1 g/kg. Similarly, ribs joint bone proportion decreased by 28 g/kg from the light to the heavy slaughter weight but increased by 4 g/kg from the L to H genetic merit. Total muscle proportion decreased by 12 g/kg from the light to the heavy slaughter weight but increased by 4 g/kg from the L to H genetic merit, and fat proportion increased by 42 g/kg from the light to the heavy slaughter weight but decreased by 8 g/kg from the L to the H genetic merit. Taken together these data indicate that an increment of carcass weight due to higher EPDCWT had less effect on carcass composition than a comparable increment due to delayed slaughter. Thus, animals of higher EPDCWT can be taken to the carcass weight commensurate with their growth genetic potential without affecting carcass composition.
Fat and muscle colour and muscle composition
There are few published reports on fat colour with which the present data can be directly compared. Dunne et al. (Reference Dunne, Keane, O’Mara, Monahan and Moloney2004) measured the fat colour of BB (but not AA) and two strains of Holstein–Friesians and found little difference in L (lightness) value. The increases in fat yellowness, hue and chroma values with increasing slaughter weight reflect either the longer finishing period or the greater age of the animals at slaughter (Dunne et al., Reference Dunne, Monahan, O’Mara and Moloney2009). As the finishing diet contained grass silage the heavy slaughter weight animals received carotenoids for a longer period. Assuming only a small or negligible turnover of these carotenoids, once deposited in the fat, their extended accumulation in the heavy slaughter weight group would have accounted for the increased yellowness. That the heavy slaughter weight animals were fatter than their light slaughter weight counterparts indicates ongoing triacylglycerol accumulation in their adipose tissue, and β-carotene, which is responsible for much of the variation in yellowness of bovine fat (Dunne et al., Reference Dunne, O’Mara, Monahan and Moloney2006), can be simultaneously incorporated into the adipose tissue with triacylglycerols (Arias et al., Reference Arias, González, Shimada, Varela-Echavarria, Ruiz-López, During and Mora2009). The greater yellowness, hue and chroma values for the heavy slaughter weight group suggest that carotenoid accumulation matched that of triacylglycerols.
The higher m. longissimus L (lightness) value for BB compared with AA agrees with the findings of Campion et al. (Reference Campion, Keane, Kenny and Berry2009b). Although the BB animals did not exhibit muscular hypertrophy phenotypically, their higher L (lightness) value may have been associated with this condition as such animals have lower myoglobin content (Fiems et al., Reference Fiems, VanHoof, Uytterhaegen, Boucque and Demeyer1995) and a higher muscle L (lightness) value (Van Eenaeme et al., Reference Van Eenaeme, Minet, Raskin, Dufrasne, Clinquart, Hornick, Diez, Mayombo, Baldwin and Istasse1997). Dunne et al. (Reference Dunne, Keane, O’Mara, Monahan and Moloney2004) also observed that the progeny of BB bulls had a higher muscle L (lightness) value than progeny of Holstein–Friesian bulls whereas Cuvelier et al. (Reference Cuvelier, Cabaraux, Dufrasne, Clinquart, Hocquette, Istasse and Hornick2006) reported a significantly higher L (lightness) value for BB than for AA bulls. The lower a (redness) value for BB compared with AA agrees with the findings of Cuvelier et al. (Reference Cuvelier, Cabaraux, Dufrasne, Clinquart, Hocquette, Istasse and Hornick2006) but is at variance with the findings of both Dunne et al. (Reference Dunne, Keane, O’Mara, Monahan and Moloney2004) and Campion et al. (Reference Campion, Keane, Kenny and Berry2009b). The difference in hue value reflects the differences in the a (redness) and b (yellowness) values from which it was calculated.
That there were no genetic merit effects on m. longissimus colour traits is consistent with there being no compositional effects, but it is at variance with the findings of Campion et al. (Reference Campion, Keane, Kenny and Berry2009b) who did observe a lower L (lightness) value for higher EPDCWT animals. The available data on the effects of slaughter weight on muscle colour traits are inconsistent. Campion et al. (Reference Campion, Keane, Kenny and Berry2009b) found that both L (lightness) and hue values decreased with increasing slaughter weight, whereas Dunne et al. (Reference Dunne, Keane, O’Mara, Monahan and Moloney2004) found no consistent effect of slaughter weight. Differences between experiments in growth to any particular slaughter weight mean that animals reach similar slaughter weights at different ages (Shorthose and Harris, Reference Shorthose and Harris1991). Thus, anomalies or inconsistencies in colour values are not surprising as muscle surface colour may reflect intramuscular lipid (Muir et al., Reference Muir, Smith, Wallace, Cruickshank and Smith1998) and pigment (Boccard et al., Reference Boccard, Naude, Cronje, Smit, Venter and Rossouw1979) contents as well as the type and distribution of muscle fibres (Lefaucheur Reference Lefaucheur2010), all of which change with age and growth rate.
M. longissimus chemical compositional differences are consistent with the physical composition of the ribs joint. The higher protein and moisture, and lower lipid concentrations of BB compared with AA reflect the higher muscle and lower fat proportions in the ribs joint of BB. Similarly, the absence of any significant effect of genetic merit on chemical composition is consistent with the absence of a genetic merit effect on ribs joint composition. The lower moisture and higher lipid concentration of m. longissimus from the heavy slaughter weight animals would be expected from their lower ribs joint muscle and higher ribs joint fat proportions. A close relationship between muscle chemical composition and carcass physical composition has been widely documented (Berg and Butterfield, Reference Berg and Butterfield1976; Keane et al., Reference Keane, Allen, Connolly and More O’Ferrall1990 and Reference Keane, More O’Ferrall, Connolly and Allen1991; Robelin and Tulloh, Reference Robelin and Tulloh1992).
Conclusions
It is concluded that differences in growth rate of AA and BB were small, particularly in animals of high genetic merit for carcass weight. However, because of a higher kill-out proportion, BB had heavier carcasses, which were of better conformation and lower fatness. All skeletal and muscular scores were superior for BB, and carcass measurements scaled for carcass weight were lower, indicating greater carcass compactness. Animals of higher genetic merit generally had higher LW gains resulting in a higher slaughter weight per day of age. They also had a higher kill-out proportion but there was no difference in carcass conformation or carcass fatness. The EPDCWT difference between the L and H genetic groups was 19 kg for AA and 8 kg for BB. The measured carcass weight differences were 23 kg for AA and 13 kg for BB. A greater proportion of the extra carcass weight attributable to higher EPDCWT was due to a higher kill-out proportion for BB than AA. Although breed × genetic merit interactions were not significant, the differences between the breeds in growth rate and slaughter weight tended to be greater for L than for H. For example, the differences between AA and BB for L were 43 g slaughter weight per day of age and 31 kg slaughter weight. The corresponding differences for H were 16 g slaughter weight per day of age and 5 kg slaughter weight.
Daily feed DM intake was not affected by breed type or genetic merit but DM intake per kg LW was lower for BB and H than for AA and L, respectively. While DM intake increased with increasing slaughter weight, it did so more slowly and as a result DM intake per kg LW decreased. Efficiency of net energy utilisation for LW gain was 18% poorer for the heavy than for the light slaughter weight group.
Delaying slaughter date increased slaughter weight, carcass weight and carcass fatness. It also reduced the proportion of pistola in the carcass, the proportions of bone and muscle in the ribs joint and the proportions of moisture and protein in m. longissimus. It increased the proportion of fat in the ribs joint and the proportion of lipid in m. longissimus. None of these effects were associated with the increase in carcass weight attributable to higher EPDCWT. Thus, an increment of carcass weight due to higher EPDCWT is more valuable than a similar increment due to a delay in slaughter because it comprises higher proportions of pistola and muscle and a lower proportion of fat. As carcass conformation improves with increasing carcass weight due to delayed slaughter but not due to higher EPDCWT, it follows that where carcass payment is based on conformation, the better-conformed carcasses from delayed slaughter receive a premium even though they have lower proportions of pistola and muscle. In contrast, the higher pistola and muscle proportions of higher EPDCWT carcasses go unrewarded because conformation is not correspondingly improved.
Acknowledgements
The authors acknowledge Mr J. Farrell for skilled technical assistance, Mr B. Duffy and Mr P. McGovern for care and management of the animals, the staff of Grange Laboratories for feed analyses, the management and staff of Meadow Meats, Rathdowney for facilitating the slaughter measurements and ribs joint dissection, and Ms Sinead Caffrey and Ms Mary Weldon for layout and typing the manuscript.