Introduction
Recent decades have seen vast changes in patterns of transitions from education to work, and into adulthood, across European countries (Yates et al., Reference Yates, Harris, Sabates and Staff2011). The traditional linear route from education to stable employment has increasingly been replaced with more volatile and interrupted trajectories, with the process of establishing oneself in the labour market extending over many years, even decades. ‘Fractured’ (Yates et al., Reference Yates, Harris, Sabates and Staff2011) or ‘dislocated’ (Fergusson, Reference Fergusson2004) transitions describe the situation for an increasing number of contemporary young adults. In the context of these changing youth transitions, a new social problem – NEETs (‘Not in Education, Employment, or Training’) – has emerged as a priority among European policy makers (Yates et al., Reference Yates, Harris, Sabates and Staff2011).
Simultaneously, and against the background of rapid structural changes in the economy, a turn towards an activation and social investment paradigm has occurred in European youth policy (van Berkel and van der Aa, Reference van Berkel and van der Aa2015). The combination of high youth unemployment and NEET rates, and an increasing pace at which skills become obsolete, has put education at the top of the policy agenda (Ellison, Reference Ellison2017). Consequently, the European Union launched the ‘EU Youth Employment Initiative’ in 2013, directed towards Europeans below 25 or 30 years who are not in education, employment or training, in which access to education is placed centre stage (European Commission, 2016). The initiative aims to offer every unemployed European employment, traineeship or education within four months of becoming unemployed. Moreover, the unemployed are identified by the European Commission as one of the target groups for the EU strategy for lifelong learning (CEC, 2001).
A large amount of research has documented the importance of education for positive labour market outcomes. Crucially, recent research shows that re-entering formal education after entering the labour market is associated with various positive labour market outcomes (Hällsten, Reference Hällsten2011; Blanden et al., Reference Blanden, Buscha, Sturgis and Urwin2012; Kilpi-Jakonen et al., Reference Kilpi-Jakonen, Vono de Vilhena, Kosyakova, Stenberg and Blossfeld2012), including higher employment probabilities for the unemployed (Nordlund et al., Reference Nordlund, Stehlik and Strandh2013, Reference Nordlund, Bonfanti and Strandh2015; Stenberg and Westerlund, Reference Stenberg and Westerlund2008). However, we know next to nothing regarding the success or not of European countries in helping unemployed young adults and NEETs back into education, nor which policies might be advantageous in this regard. National institutions raise barriers in the education system, and many unemployed people are constrained in their opportunities to re-enter education. In some countries, further education enhances rather than reduces inequalities between individuals with strong labour market positions and high education and those, such as the unemployed and those with lower levels of education, who are in greatest need of further education (Bukodi, Reference Bukodi2017; Kilpi-Jakonen et al., Reference Kilpi-Jakonen, Buchholz, Dämmrich, McMullin, Blossfeld, Blossfeld, Kilpi-Jakonen, Vono De Vilhena and Buchholz2014). The aim of this study is to investigate cross-country variability in transition rates from unemployment to education among young adults, how the inclusiveness of educational policies affects these transition rates, and if low-educated unemployed are more dependent on inclusive policies.
The paper extends the school-to-work transitions literature by investigating the role of policies for transitions into education. Moreover, it contributes to the literature on further education (and lifelong learning) in four respects. First, previous comparative research has often been carried out on cross-sectional data, studying participation in education at any given time point (e.g. Groenez et al., Reference Groenez, Destemdt and Nicaise2007; Wozny and Schneider, Reference Wozny and Schneider2014). This study is the first to use harmonised longitudinal data on a large set of countries, thus allowing a more dynamic analysis of transition patterns. Second, the use of longitudinal data enables controlling for potential crowding out effects of education: that is, whether transition into education comes at the expense of employment. Investigating these potential trade-offs and opportunity costs is important from a policy perspective.
Third, while the relation of further education to social and gender inequality has been a central issue in the research field (Bukodi, Reference Bukodi2017), the unemployed have largely been neglected, despite the great need of further education among this group, and despite the unemployed being a prioritised group in EU lifelong learning policy (CEC, 2001). Fourth, previous studies have largely lacked a policy focus, and have not linked cross-country differences in participation to variations in educational policies. By simultaneously focusing on unemployed young people, and on the role of policies, the paper addresses both of these gaps. ‘Further education’ is – in this paper – understood as any type of education, regardless of level, that individuals re-enter after having completed their initial education and entered the labour market (Bukodi, Reference Bukodi2017).
Previous research
As stated, little research has studied transitions into further education. However, with regard to the participation of the unemployed, some studies have found that the unemployed are under-represented (Eurydice, 2015a), while others suggest that they are over-represented (Bukodi, Reference Bukodi2017; Hällsten, Reference Hällsten2011; Jenkins et al., Reference Jenkins, Vignoles, Wolf and Galindo-Rueda2003) among participants in further education. The diverging patterns might reflect different conceptualisations of education, or differences in participation patterns across countries (Kilpi-Jakonen et al., Reference Kilpi-Jakonen, Vono de Vilhena, Kosyakova, Stenberg and Blossfeld2012).
Several studies have documented a rather clear cross-country pattern concerning the prevalence of further education in the general population. The Nordic countries are consistently at the top among European countries, while southern, central and eastern Europe are typically at the bottom (Rubenson, Reference Rubenson2006; Tuijnman and Hellström, Reference Tuijnman and Hellström2001; Desjardins and Rubenson, Reference Desjardins and Rubenson2013; Eurydice 2015a; Dämmrich et al., Reference Dämmrich, Vono de Vilhena, Reichart, Blossfeld, Kilpi-Jakonen, Vono De Vilhena and Buchholz2014). In the cases where these patterns have been broken down by subgroups, the Nordic countries have had the highest participation among otherwise disadvantaged groups, such as the low-skilled, poorly educated, and those with weak labour market status (Rubenson, Reference Rubenson2006; Tuijnman and Hellström, Reference Tuijnman and Hellström2001). A rare comparative study on transitions out of unemployment found that unemployed young adults were three to five times more likely to move into education in Finland and Sweden as compared to Spain and Scotland (Furlong and Cartmel, Reference Furlong, Cartmel and Hammer2003). Kilpi-Jakonen et al. (Reference Kilpi-Jakonen, Vono de Vilhena, Kosyakova, Stenberg and Blossfeld2012) found similar results in a comparative study including Sweden, Russia, Spain and the UK, where Sweden was the only country where being unemployed increased the probabilities of undertaking further education.
Theoretical framework and hypotheses
Kilpi-Jakonen et al. (Reference Kilpi-Jakonen, Buchholz, Dämmrich, McMullin, Blossfeld, Blossfeld, Kilpi-Jakonen, Vono De Vilhena and Buchholz2014) propose a theoretical framework for analysing how micro- and macro-level processes interactively shape patterns of participation in adult further education, which is utilised for deriving specific hypotheses to be tested in this study. The framework describes how the social demand for skills, and thus individual demand for further education, is filtered by national institutions. On the micro-level, individuals, in this case unemployed young adults, seek to improve their labour market positions through, among other things, education. Studies show that the subjective belief that education will improve labour market prospects are among the most important motivations for entering education (Callender and Jackson, Reference Callender and Jackson2005). However, individuals also face various barriers when trying to access education, and macro-level institutions can constrain (e.g. restricted access to education through demands for formal qualifications) as well as enable (e.g. government support for education) educational choices. Thus, educational participation is not only a question of individual preferences or ambition, but is also related to institutional incentives and constraints (Kilpi-Jakonen et al., Reference Kilpi-Jakonen, Buchholz, Dämmrich, McMullin, Blossfeld, Blossfeld, Kilpi-Jakonen, Vono De Vilhena and Buchholz2014). Moreover, incentives as well as constraints are heterogeneous, in the sense that they are experienced differently depending on the resources available to individuals and groups. In this way, national institutions, by reinforcing or counteracting processes of cumulative advantage, can shape inequalities in further education (Bukodi, Reference Bukodi2017).
On the basis of the assumption that unemployed individuals believe that further education will improve their labour market prospects (Callender and Jackson, Reference Callender and Jackson2005), but face various constraints in their opportunities to enter education, we can derive hypotheses regarding how educational policies affect the opportunities of the unemployed to re-enter education. The relevant policies in this regard are policies which lower the barriers (or constraints) faced by unemployed young adults (Boeren et al., Reference Boeren, Nicaise and Baert2010). All educational systems have sorting mechanisms and barriers at various levels, but the strictness of the barriers, the level at which they operate, and their impacts on different social groups, differ between countries. In other words, the focus of this section will be on the inclusiveness, in the sense of low barriers, of educational policies: more inclusive policies are hypothesized to increase access opportunities (Eurydice, 2015a; Kilpi-Jakonen et al., Reference Kilpi-Jakonen, Vono de Vilhena and Blossfeld2015). Two dimensions of inclusiveness will be discussed. First, barriers facing prospective students that relate to their prior academic achievements; and second, barriers with regard to the affordability of education. Most of the barriers can in principle exist at any educational level, though the actual policies analysed primarily relate to either higher education (ISCED 5; abbreviated as ‘HE’) or adult education at secondary levels (ISCED 2 to 3; abbreviated as ‘ASE’).
The first dimension, relating to prior academic achievements, is of relevance since low education is often the root cause of unemployment in the first place. Unemployed individuals would, thus, benefit from educational systems that facilitate access also for students with poor prior academic achievements. Since positions in education for adult re-entrants are often limited, and since the demand for positions in further, not least higher, education tend to exceed supply, previous academic achievements are often used as a sorting mechanism (Shavit et al., Reference Shavit, Arum and Gamoran2007; OECD, 2017). One way to lower barriers for low achievement students is, thus, to increase the supply: that is, to increase the number of positions at relevant levels of the education system. A larger supply of positions increases access opportunities and makes education more inclusive (Shavit et al., Reference Shavit, Arum and Gamoran2007).
Hypothesis 1: More positions in further education will be positively associated with transitions from unemployment to education.
Another aspect of relevance with regard to prior academic achievements is second chance opportunities: that is, alternative access routes to higher levels of the education system. In many education systems, transition to higher levels (i.e. from lower to upper secondary, or to tertiary/higher education) requires a successful completion of the lower stages as a formal qualification for entering this educational level. For example, eligibility to higher education normally requires successful completion of upper secondary education, and sometimes also that this secondary education is within a specific educational track. Since the unemployed more often than the average lack adequate formal qualifications, they stand to benefit from alternative access routes at all levels of the education system (Eurydice, 2015a).
Hypothesis 2: More extensive second chance opportunities will be positively associated with transitions from unemployment to education.
In relation to this first dimension of inclusiveness, stratification of educational institutions should also be highlighted. Many education systems sort pupils into separate groups, classes or streams based on ability, a sorting that can be more informal and subtle (e.g. the UK), or highly formalised and explicit, such that pupils are placed in different vertically stratified schools with different curricula (e.g. Germany) (Blossfeld et al., Reference Blossfeld, Buchholz, Skopek and Triventi2016). However, it is primarily the latter (formal between-school tracking) form of stratification that creates formal barriers to students, both with regard to their opportunities to move between tracks, and with regard to their opportunities to enter higher education (Shavit et al., Reference Shavit, Arum and Gamoran2007; Orr et al., Reference Orr, Usher, Haj, Atherton and Geanta2017). Lower tracks typically do not provide eligibility to higher education and, if movement between tracks is difficult, this creates a double barrier for students in lower tracks. Consequently, enrolment in higher education tends to be lower in stratified systems, and stratified educational systems are less inclusive (Groenez et al., Reference Groenez, Destemdt and Nicaise2007; West and Nikolai, Reference West and Nikolai2013). Stratification primarily affects inclusiveness with regard to higher education, since this is where the barriers raised are most prominent, but it can also be relevant with regard to other types of further education.
Hypothesis 3: Highly stratified educational systems will be negatively associated with transitions from unemployment to education.
The second dimension of inclusiveness relates to affordability of education. Education implies both direct and indirect costs. Since the unemployed typically have limited financial resources at their disposal, high costs of education, including inadequate financial support, would thus imply a greater barrier for them (Boeren et al., Reference Boeren, Nicaise and Baert2010; Eurydice, 2015a). Studies show that affordability is more important for educational participation among socially disadvantaged groups (Callender and Jackson, Reference Callender and Jackson2005). The problem for the unemployed is aggravated by credit constraint, because banks are less willing to provide loans to jobless individuals (Crossley and Low, Reference Crossley and Low2014), and the financial stress caused by unemployment creates pressure to get a job immediately rather than prioritise long-term human-capital formation (Micklewright et al., Reference Micklewright, Pearson and Smith1990).
Hypothesis 4: Greater affordability of further education will be positively associated with transitions from unemployment to education.
Previous research moreover shows that highly educated individuals are typically more likely to participate in further education (Bukodi, Reference Bukodi2017), but that these differences are heterogeneous across countries (Tuijnman and Hellström, Reference Tuijnman and Hellström2001). It is likely that the effects of inclusive policies also differ depending on the education level of the unemployed (Kilpi-Jakonen et al., Reference Kilpi-Jakonen, Vono de Vilhena and Blossfeld2015). More specifically, the effect of inclusive policies related to prior academic achievements should be strongest for unemployed people whose highest achieved education level is lower than the level of education for which the barrier applies. For instance, in many education systems, access to higher levels (e.g. from lower to upper secondary, or to tertiary/higher education) requires successful completion of the lower stage as a formal qualification for entering this educational level. Unemployed people whose highest achieved education level is lower than this should benefit most from more inclusive access regulations, or from more positions at this level (which attenuates competition). Since affordability, the second dimension of inclusiveness, is related to income rather than previously attained educational qualifications, we do not expect differential effects for these policies.
Hypothesis 5: There will be a cross-level interaction effect between educational level and educational policies related to prior academic achievement, such that inclusive policies are more strongly related to transitions to education among unemployed people with lower levels of education.
Data and methods
Individual-level data used for this study are from the European Union Statistics on Income and Living Conditions (EU-SILC). EU-SILC provides comparable micro data on individuals and households in all EU member states, as well as in many non-EU European countries. It is coordinated by Eurostat but the data is provided by the member states. The coordination is based on the idea of a common framework for data collection, meaning that states are free to use existing surveys, but coordinate these in terms of variables and classifications in order to maximise comparability. EU-SILC is a rotational panel survey in which each individual is followed yearly for a maximum of four years. The rotational design means that the total sample consists of four overlapping panels, where each panel is included for four years, after which this panel is dropped and replaced by a fresh one so that the total sample size is held fixed.
For the purpose of this study, EU-SILC offers a number of advantages. First, it provides high-quality micro data, collected through probability sampling, on a range of variables pertaining to labour market status and living conditions. Second, large sample sizes enable analysis even of rare events such as labour market transitions. Third, it is the largest survey providing harmonised individual level panel data from the great majority of European countries, thus simultaneously enabling analysis over time and between countries (Iacovou et al., Reference Iacovou, Kaminska and Levy2012). Since transitions from unemployment to education are very rare in some countries, this study makes use of a combined dataset, covering the period 2006 to 2013, and including individuals from 29 countries. The analysis is restricted to unemployed individuals aged 19 to 30, resulting in a dataset with between 18 109 and 21 637 individuals, depending on the model. The lower age limit is set at 19 years, as many young adults are still in upper secondary school until that age, and the upper age limit is set at 30 years, as this is the age ceiling for the ‘EU Youth Employment Initiative’ (European Commission, 2016).
Dependent variable
The study investigates transitions between activity states. The dependent variable is, therefore, being in a certain activity status at the next measurement occasion (year). Since there are many pathways out of unemployment, the dependent variable is multinomial, with remaining unemployed as the reference category. The focal activity status is being in education (defined in EU-SILC as ‘student, pupil, in training or in unpaid work experience’), but the model also includes transitions from unemployment into employment, and transitions from unemployment into various forms of inactivity (early retirement, disability, domestic work or other forms of inactivity). This is important in order to control for potential crowding-out effects from employment. Activity status is self-defined and captures the respondent’s own perception of their main activity.
Independent variables at the individual level
The models control for age (in years), gender and education level (using International Standard Classification of Education – ISCED – levels).
Independent variables at the country level
With the exception of stratification (hypothesis 3), the hypotheses in principle refer to barriers at any type of education level. However, different specific policies are of relevance depending on the level of education and, empirically, the educational policies analysed refer to either higher education (ISCED 5) or adult secondary education (ISCED 2 to 3). Country-values for all indicators are presented in Table 3 in the Appendix – see online supplementary material.
Positions in further education (hypothesis 1)
The number of positions in higher education is operationalised as the share of the population aged 20 to 29 years who are enrolled in higher education (ISCED 5 or higher), which, since positions in higher education are typically rationed in European public higher education systems, provides a good proxy for the ‘supply side’ of higher education. Data are from Eurostat (2017a), and are only available from 2013 onwards, which is the year used here. Positions in adult secondary education are operationalised in a similar way. Eurydice (2015b) – a European Union network with the task of providing comparable data on European education systems – has country data on the total (not age-specific) number of participants in adult secondary education programmes, which has been divided by the country population size. Participants in training programmes financed or organised by employment services are excluded from this data.
Second-chance opportunities (hypothesis 2)
Two indicators of second-chance opportunities are used, one related to secondary and one to higher education, with both taken from Eurydice. Regarding secondary education, the degree of second-chance opportunities is defined as ‘completion of lower secondary education [being] a necessary condition for adults to enter upper secondary [ISCED 3] programmes’ (Eurydice, 2015a: 86). Eurydice groups countries according to whether this is the case for all upper secondary programmes (‘generous second chances’), for some programmes (‘intermediate second chance’), or not at all (the reference category). Regarding higher education, Eurydice defines second-chance opportunities as ‘access to higher education based on the recognition of prior non-formal and/or informal learning’ (Eurydice, 2013: 3). The target groups are young adults with insufficient educational credentials, and the policies are often explicitly directed towards the unemployed (Eurydice, 2015a). Eurydice (2012) ranks countries on a five-point scale, which is based on whether alternative access routes exist, as well as the extent to which they are actually used. The lowest value (0) means that the country has not systematically implemented recognition of prior learning, while the highest value (4) means that ‘recognition of prior learning is a standard practice in the majority of higher education institutions’ (Eurydice, 2012: 143).
Stratification (hypothesis 3)
The most commonly used indicator of formal between-school tracking is the age of first selection into different educational tracks (Bol and van de Werfhorst, Reference Bol and van de Werfhorst2013), which is here measured as a continuous variable, ranging from age 10 to 16 (OECD, 2007).
Affordability of education (hypothesis 4)
Affordability refers to the private costs of education for the individual, net of tuition fees and financial support. Concerning adult secondary education, affordability is operationalised as a dummy variable indicating the existence of public funding and support for adult secondary education, targeted towards individuals in specific need, such as the unemployed or low qualified (Eurydice, 2015a). No targeted support is the reference category. Regarding higher education, Eurydice (2012) has data on the share of total expenditure on higher education (in 2008) that comes from private households, which gives a good summary measure of tuition fees and financial support.
As a control variable at the country level we use the country youth unemployment rate (for each year 2006 to 2013; Eurostat, 2017b), since youth unemployment affects the incentives of young people in terms of whether to study or not (Micklewright et al., Reference Micklewright, Pearson and Smith1990). More control variables – GDP per capita, expenditure on active labour market policies (ALMPs), the wage premium of higher education, and employment protection legislation (Dämmrich et al., Reference Dämmrich, Vono de Vilhena, Reichart, Blossfeld, Kilpi-Jakonen, Vono De Vilhena and Buchholz2014) – are included in sensitivity analyses (see below).
Seven empirical indicators of educational policies are used, three of which concern adult secondary education (enrolment, second-chance opportunities and targeted support in ASE), three concerning higher education (enrolment, second-chance opportunities and private share of expenditure in HE), and one concerning regular compulsory education, which is of relevance for access to higher education (tracking age). Since the policies concern different educational states, they are of relevance for different groups depending on initial educational level. Therefore, the empirical models with indicators of adult secondary education exclude all individuals with higher education (ISCED 5). While someone with higher education can certainly enrol in education at lower educational levels, this type of educational downgrading is probably rather uncommon, and to the extent that it exists, educational downgraders are probably not very dependent on inclusive policies, since they are (evidently) already eligible for education at the higher (tertiary) level. Likewise, the models with indicators of higher education exclude all individuals with only primary education (ISCED 0 or 1), since secondary education is the first destination for this group. The group with ISCED 0 or 1 is in any case very small, and accounts for less than 3 per cent of the observed transitions into education in the sample as a whole.
Strategy of analysis
Since the dependent variable takes on four nominal values, multinomial logistic regression models are warranted. Multinomial regression controls for potential crowding-out effects of the educational policies: that is, whether transition into education comes at the expense of transition to employment. The first step of the analysis is descriptive, to establish the extent of cross-country differences in transitions. This is done using country-specific multinomial models, estimating the odds of making a transition to education in each country separately. In a second step, we attempt to explain these cross-country differences by linking them to the already described country-specific educational policies, using multilevel (random intercept) models. EU-SILC data is hierarchically ordered, with observations (level 1) nested in individuals (level 2) nested in countries (level 3). Hierarchically ordered data imply that the observations are dependent, but multilevel models account for the hierarchical structure by including random intercepts at all higher levels. In the models presented here, there are thus separate random intercepts at the individual and country level (Rabe-Hesketh and Skrondal, Reference Rabe-Hesketh and Skrondal2012).
Multinomial regression estimates several odds ratios, one for each category of the dependent variable, and since each category is compared with the reference category (staying unemployed), the analysis involves several pairs of categories. In the context of this paper, this means that, for every independent variable, separate odds ratios are estimated for each activity status (inactivity, employment and education; with unemployed as reference category). Thus, we estimate the ‘effect’ of a policy or individual characteristic on the odds of making a certain transition, as compared to staying unemployed.
Simulation studies suggest that 29 countries (level 3 observations) is enough for reliable estimates of country-level effects in multilevel models (Stegmueller, Reference Stegmueller2013). However, 29 countries implies a low number of degrees of freedom at the country-level. Therefore, each policy variable is first analysed separately (together with the control variables) and only in a second step included in the same model (cf. Wozny and Schneider, Reference Wozny and Schneider2014).
Results
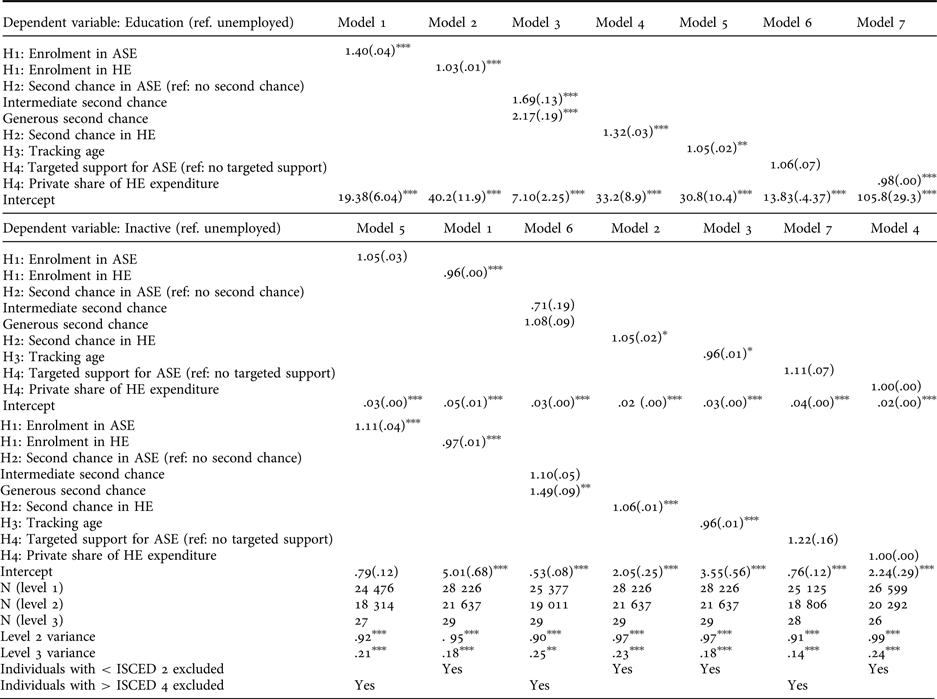
We begin with the descriptive part, by presenting estimates of country-specific odds ratios for making the transition into education (with unemployment as reference category) in Figure 1. Hypotheses 1–4 are tested in Tables 1 and 2, with the policies analysed separately in Table 1, and together in Table 2. Hypothesis 5, regarding cross-level interaction effects, is tested in Figure 2(a)–(e).
Country specific odds ratios for transition into education. Remain unemployed as reference category. From country-specific multinomial models. Controlled for age, gender and individual-level education. Country abbreviations in Table 3 in the online supplementary material

Multinomial models displaying odds ratios for transitions into inactivity, employment or education

Source: EU-SILC data.
Note: * = p < 0.05 ** = p < 0.01 *** = p < 0.001, standard errors in parantheses.
All models controlled for respondent age, gender and education level, and for country youth unemployment rate.
All data on adult secondary education (ASE) from Eurydice (2015a, 2015b). Data on HE enrolment rate from Eurostat (2017a); second chance opportunities in HE from Eurydice (2012); tracking age from OECD (2007); private share of costs in HE from Eurydice (2012).
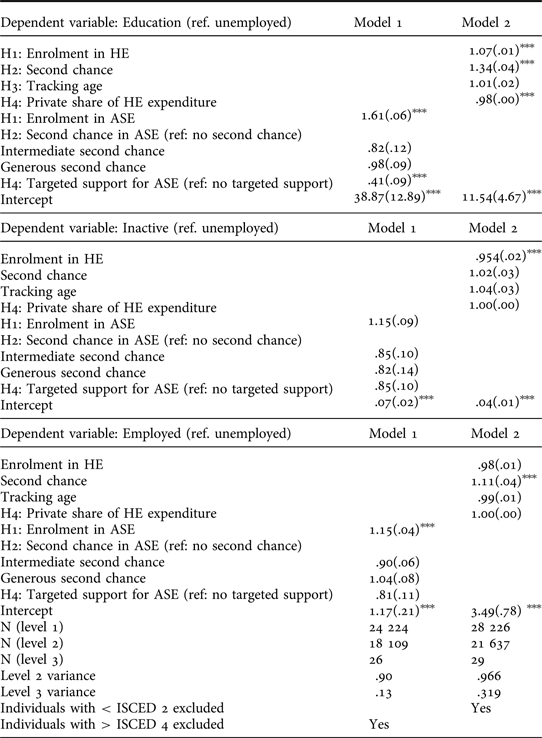
Multinomial models displaying odds ratios for transitions into inactivity, employment or education

Source: EU-SILC data.
Note: * = p < 0.05 ** = p < 0.01 *** = p < 0.001, standard errors in parantheses.
All models controlled for respondent age, gender and education level, and for country youth unemployment rate.
All data on adult secondary education (ASE) from Eurydice (2015a, 2015b). Data on HE enrolment rate from Eurostat (2017a); second chance opportunities in HE from Eurydice (2012); tracking age from OECD (2007); private share of costs in HE from Eurydice (2012).
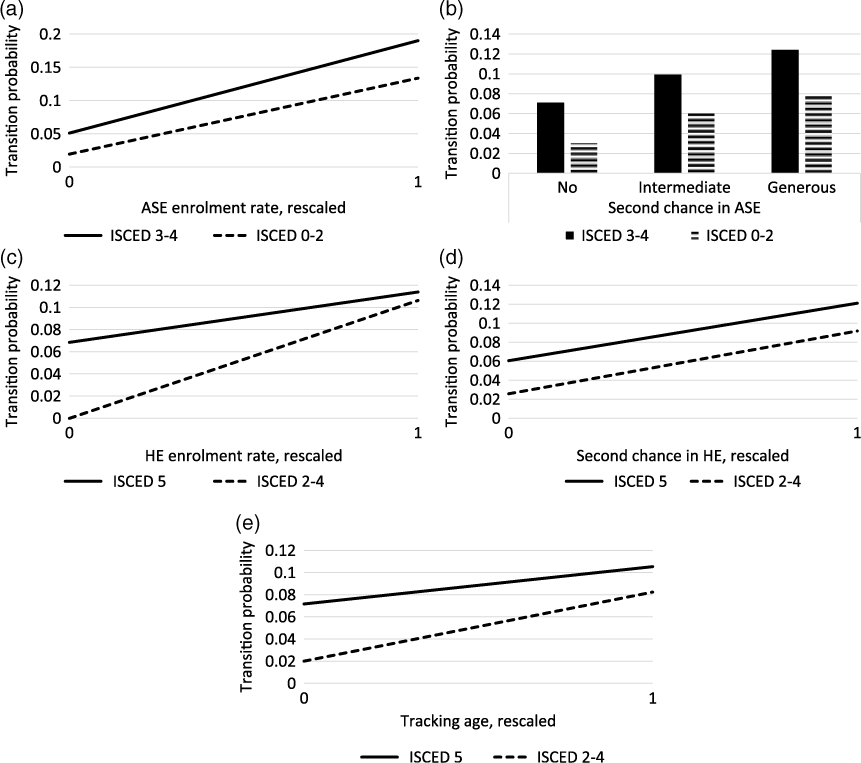
Predicted probabilities of transition from unemployment to education. Cross-level interaction effects between individual education and educational policies. Calculated from Table 4 in the Appendix – see online supplementary material

Figure 1 makes it evident that considerable cross-country variability exists with regard to transitions from unemployment to education. The largest odds ratios are found in Sweden and Norway at slightly higher than 0.6, meaning that the odds of transition to education is around 40 per cent lower than the odds of staying unemployed. The lowest odds ratios are found in Bulgaria, only 0.03, meaning that the odds of transition to education is 97 per cent lower than the odds of staying unemployed. Transition rates are clearly highest in all five Nordic countries, as well as in the Netherlands. The bottom consists of a rather heterogeneous group of largely eastern and central European countries.
We next turn to the analytical part and attempt to explain these differences. Since all hypotheses concern transitions to education, estimates for transitions to inactivity or employment are only commented upon when they are of specific interest. Models 1 to 7 include individual-level covariates (gender, age and education), the youth unemployment rate, and the educational policies, which are included one by one. Models 1 and 2 test hypothesis 1, regarding enrolment rate in further (adult secondary or higher) education. Regarding enrolment in adult secondary education (model 1), a one percentage point increase in enrolment is associated with an increase in the odds of transition to education of around 40 per cent, while an equivalent increase in higher education enrolment (model 2) increases the odds with around three per cent. The difference in the size of the odds ratios reflect the fact that the observed country values for the ASE enrolment rate are concentrated around one per cent, while the equivalent for the HE enrolment rate are concentrated around 20 per cent or more. There seems to be a crowding-out effect of higher HE enrolment, indicating that HE enrolment is also associated with a decrease in the odds of transition to employment.
Hypothesis 2, regarding second chance opportunities, is tested in models 3 and 4. The dummy for inclusive second chances in ASE (model 3) shows that transition odds are more than two times higher in this country group than in countries with no second-chance opportunities. Moving up one ‘step’ on the indicator of HE second-chance opportunities is associated with a more than 30 per cent increase in the odds of transition to education. No evidence of crowding out from employment is found for either indicator. Model 5 presents results for tracking age (hypothesis 3). The results, which corroborate the hypothesis, show that a one-year postponed age of first selection is associated with five per cent higher odds of transitioning to education, although it also reduces transitions to employment. Hypothesis 4, concerning affordability of further education, is tested in models 6 and 7. The dummy indicator for targeted support for ASE is close to zero and not significant (model 6), while the coefficient for private share of HE expenditure is highly significant (p < 0.001) and shows that a one percentage point higher share of costs is associated with two per cent lower odds for transition into education.
In the next step (Table 2), the policies are included together in order to control whether the effects of the policies cancel each other out. The policies are correlated to various degrees, and the coefficients in Table 1 might therefore pick up ‘effects’ of other policies. Table 2 displays two models: in model 1, all three indicators relating to ASE are included together, while in model 2 all indicators relating to HE are included. A note of caution is called for here. In logistic regression, the size of estimated odds is influenced by unobserved heterogeneity, and this unobserved heterogeneity varies across samples, groups or models with different covariates. Since the coefficients are thus confounded with the unobserved heterogeneity, direct comparisons of effect sizes and strength of associations across logistic models are problematic. Differences across models might reflect differences in unobserved heterogeneity rather than changes of substantial interest (Allison, Reference Allison1999). Thus, the focus here is on qualitative interpretations of the signs and significance of the coefficients.
Concerning the indicators relating to ASE (model 1), only enrolment rate in ASE remains positive and statistically significant (p < .001) when all ASE variables are analysed together, while the dummy variable for targeted support actually turns negative. Model 2, concerning the indicators relating to HE, shows that the results for tracking age from Table 1 might be spurious, as the variable is not positively associated with transitions into education when the other HE-variables are included simultaneously. The coefficients for enrolment in HE, second-chance opportunities in HE, and private share of HE expenditure are of similar size as compared to Table 1 and remain highly statistically significant (p < 0.001). No indications of crowding-out effects from employment are evident from Table 2.
Hypothesis 5 concerns cross-level interactions effects between country-level educational policies related to prior academic achievements and individual-level educational attainment. For the same reason as previously – coefficients in logistic models are influenced by unobserved heterogeneity, which varies across groups and models – comparison of odds ratios across groups can be problematic (Allison, Reference Allison1999). Following Mood (Reference Mood2010), we estimate the interaction coefficients using linear probability models, in which coefficients are comparable across groups, and which directly show the estimated probability of transitions. The results are presented graphically as predicted probabilities (calculated from the linear probability models presented in Table 4 in the Appendix – see online supplementary material) to facilitate interpretation. The figures show the predicted probability of transition to education for unemployed people with different educational levels, and how this depends on the inclusiveness of educational policies related to prior academic achievements. The educational policy indicators have been rescaled so that the figures show transition probabilities when they are at the lowest (least inclusive; left-hand side) and highest (most inclusive; right-hand side) observed values. Figures with adult secondary policy indicators separate upper secondary and post-secondary non-tertiary (ISCED 3-4; solid line) from lower education (ISCED 0-2; dashed line), while figures with higher education indicators separate higher/tertiary (ISCED 5; solid line) from secondary and post-secondary non-tertiary education (ISCED 2-4; long dashed line).
The results in Figure 2(a)–(e) offer only partial support for hypothesis 5. Regarding adult secondary education (Figure 2(a) and (b)), there is no indication of stronger effects for unemployed people with lower education (< ISCED 3), and none of the interaction terms are statistically significant at the 5 per cent level (see Table 4 in the Appendix). Regarding higher education, there is a clear and significant interaction effect between education and enrolment level, such that unemployed people with intermediate education gain more from higher enrolment (Figure 2(c)), and an indication of an equivalent pattern with regard to tracking (Figure 2(e)), but the latter interaction term is not as strong and only significant at the 10 per cent level. No support for stronger effects for unemployed people with intermediate education is found for second-chance opportunities (Figure 2(d)). Thus, the support for differential effects is stronger with regard to transitions to higher than to adult secondary education.
While odds ratios can be difficult to interpret in a more substantial way, a benefit of presenting results of linear probability models graphically is that they directly show the change in probabilities of transitions associated with the educational policies. For instance, the estimated transition probability is close to zero for unemployed people with a low level of education (ISCED 0-2) when enrolment in ASE is at its lowest observed value, but almost 15 per cent when it is at its highest (Figure 2(a)). Likewise, estimated transition rates for unemployed people with secondary and post-secondary non-tertiary education (ISCED 2-4) is around zero when enrolment in higher education is at its lowest observed value, but around 10 per cent when it is at its highest (Figure 2(c)).
Last, results of sensitivity analyses are commented upon, though this is not shown in tables due to space limitations. First, the hypotheses have been tested with alternative indicators of the relevant dimension of educational inclusiveness (see results and description of indicators in Table 5 in the Appendix). The results for the alternative indicators are very similar to those presented in Table 1, corroborating the validity of the hypotheses. Second, in order to reduce the risk of omitted variable bias, the models have been tested with other control variables (described above). However, with the exception of GDP per capita, these controls are not available for all 29 countries, which is why they are not included in the main analysis. The coefficients for the educational policy variables were hardly affected by these additional controls, the exception being the coefficient for tracking age, which was strongly reduced and turned insignificant together with expenditure on ALMPs.
Third, the influence of outliers has been controlled for by deleting each country on a one-by-one basis, and then re-estimating the models without this country. Tracking age proved to be sensitive to exclusions of several countries, but all other indicators were robust to this procedure. Fourth, misclassification between different states, especially between unemployed and inactive, is a potential problem in self-reported data. The models have, therefore, been re-estimated with these two categories merged into one baseline category, with stable results. Results for sensitivity analyses are available upon request.
Conclusions
This study has investigated how educational policies affect transitions from unemployment to further education. It was hypothesized that more inclusive policies, by lowering barriers for access to further education, are associated with a higher likelihood that unemployed individuals leave unemployment and re-enter education, and that this association should be strongest for unemployed people with lower levels of education.
Three broad conclusions can be drawn from the analyses presented here. First, the variation across European countries concerning the rate at which unemployed young adults re-enter further education, as compared to staying unemployed, is very large. Especially in the Nordic countries, entering education is a common way of leaving unemployment, while in parts of eastern and central Europe, it is a very marginal phenomenon. Thus, the patterns of ‘dislocated’ transitions (Fergusson, Reference Fergusson2004) vary across countries, and are conditional on institutional contexts. Second, this variation across countries is associated with educational policies. Although causal claims are inadvisable with these cross-sectional data, the results support the proposition that inclusive educational policies – that is, policies which lower entry barriers – increase access opportunities for unemployed young adults. Thus, inclusive educational policies might be an important component of the ‘EU Youth Employment Initiative’, as they can be a successful way to prevent high NEET rates. On the basis of these results, one can hypothesize that the inclusive policies in the Nordic countries might be one explanation of the low NEET-rates there. However, the results also indicate that crowding out from employment might be a side effect of higher HE enrolment and higher tracking age. Third, the importance of inclusive educational policies seems – to a limited extent, and only in relation to higher education – to be greatest for unemployed young adults with low levels of education. Only higher HE enrolment rates seem to have the capacity to reduce inequalities in opportunities between educational groups. This indicates that processes of ‘cumulative advantage’ (Bukodi, Reference Bukodi2017) are also present when it comes to educational inequalities in further education for the unemployed, though it is to some extent context-dependent, and can be partly countered by inclusive policies.
Hypotheses 1 to 4 were supported by all empirical indicators (save for targeted support for ASE). However, when these were analysed one by one, the models where they were included simultaneously showed that this was partly because some inclusive policies tend to cluster together in the same educational systems, and second-chance opportunities in ASE and tracking age were not associated with higher transition rates net of the other policies. However, it should be noted that the reason that inclusive policies cluster together is partly because they enable each other. For instance, highly tracked countries tend to have lower enrolment in higher education precisely because lower tracks do not provide eligibility (Shavit et al., Reference Shavit, Arum and Gamoran2007). Likewise, affordable education can be expected to raise overall enrolment rates, particularly among disadvantaged groups. In this sense, the correlation between policies should perhaps not be seen as a source of confounding, but as an indication of ‘configurational effects’. Research into (higher) education policies has shown that countries tend to cluster and form distinctive higher education ‘regimes’ (West and Nikolai, Reference West and Nikolai2013), and it is possible that it is the combined effect of the policies that is of importance, rather than the individual policies taken separately.
Limitations of the study should be highlighted. Causal inferences are inadvisable with cross-sectional observational data, though the inclusion of a wide set of country-level control variables reduces the risk of omitted variable bias. While not small in the context of comparative research, the number of countries included (29) makes it difficult to control for all possible country-level confounders. Also, as is the case with most cross-country comparative research, the countries included do not constitute a random sample, which makes standard hypothesis testing less valid. Regarding policy implications, it should be noted that, while much research shows that further education, on average, does indeed improve labour market prospects of individual participants (Stenberg and Westerlund, Reference Stenberg and Westerlund2008; Hällsten, Reference Hällsten2011; Blanden et al., Reference Blanden, Buscha, Sturgis and Urwin2012; Kilpi-Jakonen et al., Reference Kilpi-Jakonen, Vono de Vilhena, Kosyakova, Stenberg and Blossfeld2012; Nordlund et al., Reference Nordlund, Stehlik and Strandh2013, Reference Nordlund, Bonfanti and Strandh2015), the macro-level effects can be different, and concerns regarding over-education have been raised in many countries. Concerning the educational policy indicators, macro-data on adult secondary education policies are rather scarce; consequently, two out of three indicators related to adult secondary education are arguably of slightly lower quality than their higher education level counterparts. The indicator of positions in adult secondary education was calculated manually, and excluded Belgium and the UK due to low-quality data, while the indicator of targeted support for adult secondary education was a simple binary indicator, which does not take more fine-grained differences, nor the degree of implementation, into account. In addition, activity status in EU-SILC does not distinguish between different types of education, making it difficult to firmly conclude that all transitions are indeed to the educational level to which the focal policy relates. This was dealt with by excluding all individuals for which the focal policy should not apply: that is, individuals with ISCED 5 when analysing policies related to adult secondary education, and individuals with ISCED 0-1 when analysing policies related to higher education. However, the fact that EU-SILC data does not distinguish between different types of education means that we cannot know whether the specific educational transitions observed will have beneficial labour market consequences for the individuals. Even though, as stated, much research shows that further education, on average, does indeed improve the labour market prospects of participants, this might not be true of all educational programmes and courses, and countries with high transition rates might invest more in less effective educational policies.
The study also has a number of strengths. First, it adds additional insights to research on educational policies and further education, and is the first large-scale comparative study to use longitudinal data, enabling analysis of transitions to education. Second, while the number of countries does not enable simultaneously controlling for all possible confounders, it is larger than most previous studies, and large enough for reliable estimates of country-effects in multilevel models. Third, the results (with the exception of tracking age) are remarkably robust across a wide range of sensitivity tests. Fourth, the large number of participants in EU-SILC enables comparative analysis even of rare events such as transitions between unemployment and education.
Supplementary material
To view supplementary material for this article, please visit https://doi.org/10.1017/S0047279418000788