Introduction
The ways children respond to stressful events in their daily lives is implicated in the development of psychopathology (e.g., depression; Grant et al., Reference Grant, Compas, Stuhlmacher, Thurm, McMahon and Halpert2003; Zimmer-Gembeck & Skinner, Reference Zimmer-Gembeck, Skinner and Cicchetti2016). Goal orientation theory suggests that the adaptiveness of a particular way of responding to stress in academic settings is determined in part by the kinds of goals (i.e., motivating reason) children adopt (Kaplan & Maehr, Reference Kaplan and Maehr2007). That is, children's responses to stressors and vulnerability to depressive problems may have less to do with what they are trying to achieve in academic settings and more to do with why (Dweck, Reference Dweck1999; Dykman, Reference Dykman1998). Evidence that goals and individual differences therein contribute to depressive problems for preadolescents (hereafter referred to as “children”) is, however, limited. If children's goals increase vulnerability to depression, then this should be observable at levels of analysis (Cacioppo et al., Reference Cacioppo, Berntson, Sheridan and McClintock2000) with established links to depressotypic functioning (e.g., Cicchetti, Reference Cicchetti and Frodl2016; Hankin, Reference Hankin2012). However, studies of this phenomenon are scarce and tend to examine different scales of goal-based vulnerability in isolation (cf. Sideridis, Reference Sideridis2007). Research integrating information across levels of analysis (e.g., subjective experience, objective behavior, physiologic reactivity) may illustrate if and how such motivational vulnerability colors children's stress perceptions, manifests in despressotypic behavior, or takes hold in arousal function. Thus, the current study adopted a multiple-levels-of-analysis approach (Cicchetti, Reference Cicchetti, Beauchaine and Hinshaw2010) to test Dykman's (Reference Dykman1998) goal orientation model of depression vulnerability in a community sample of children.
Performance goals and vulnerability to depression
Children's behavior in academic settings is driven by different goals, or higher-order motivating reasons that help guide behavioral efforts to manage stressors in education settings (Elliot & Thrash, Reference Elliot and Thrash2002; Maehr & Zusho, Reference Maehr, Zusho, Wentzel and Wigfield2009). Some children are driven by mastery goals, or the desire to develop competence and improve ability by learning new skills. Other children are driven by performance goals, or the desire to demonstrate competence and prove ability by showing others their aptitude. Dykman (Reference Dykman1998) proposes that depression proneness associated with performance goalsFootnote 1 stems from the fundamental need to validate one's basic self-worth. Goal strivings of this sort are argued to result from excessively critical or conditionally approving caregiving experiences that contribute to a sense of uncertainty about one's self-worth. Performance goals are, thus, thought to be a compensatory attempt to solidify this fractured self-worth by striving to perform well in domains that hold promise for direct or symbolic praise or approval from others. For children in educational settings, these domains are often academic and social in nature. Attempts to validate self-worth take the form of seeking out external indicators of achievement (e.g., grades) and acceptance from others (e.g., friendships), indicators reflective of ability that forms the basis of self-worth (e.g., intelligence, likeability). To protect self-worth, children with performance goals narrow the focus of these attempts to arenas where success is likely (e.g., well-versed subjects, old friendships) and avoid situations or self-handicap (e.g., less persistence, withdraw effort) in arenas where success is uncertain (e.g., unfamiliar classwork, new friendships). As children with performance goals often feel their ability in a domain reflects their self-worth, they concern themselves with convincing others they are capable and avoid looking like they are incapable (Hong, Chiu, Dweck, Lin, & Wan, Reference Hong, Chiu, Dweck, Lin and Wan1999).
Preadolescence may be a particularly ripe age for examining performance-goal-based vulnerabilities to depression. As students advance through grade school, they are increasingly exposed to new curricular content and classmates. As such, children are not always able to restrict performance to well-versed domains or familiar settings. Doubts about ability and, thus, self-worth are at times unavoidable. Preadolescence is a developmental window where this may particularly be the case, given that children typically face a litany of new academic and interpersonal stressors during this period (Spear, Reference Spear2000). For children with performance goals, the prospect of experiencing academic or interpersonal setbacks may be particularly daunting. Evidence that performance-oriented individuals tend to experience internalizing problems (e.g., low self-esteem, sense of inadequacy) following novel stressors supports this claim (Dweck & Leggett, Reference Dweck and Leggett1988; Lindsay & Scott, Reference Lindsay and Scott2005; Robins & Pals, Reference Robins and Pals2002; Turner, Thorpe, & Meyer, Reference Turner, Thorpe and Meyer1998).
Dykman's (Reference Dykman1998) model is not unlike cognitive vulnerability models (e.g., Hankin & Abramson, Reference Hankin and Abramson2001). As noted by Rothbaum, Morling, and Rusk (Reference Rothbaum, Morling and Rusk2009), each propose a set of vulnerable self-beliefs (e.g., stable/fixed views, self-worth implications) that give rise to involuntary stress responses (e.g., self-deprecating thoughts, rumination) in the wake of stressors with negative outcomes. There are, however, notable points of divergence. First, unlike cognitive vulnerability, performance goal vulnerability is reinforced (e.g., “I am valuable”) by stressors with positive outcomes (e.g., passing a test), making it particularly insidious and pernicious in educational settings. That is, stressors with positive outcomes inadvertently strengthen the tie between ability and self-worth. Thus, while successes help children with performance goals appear healthy to others, they also covertly render them more vulnerable to depression when eventual difficulties navigating novel academic and interpersonal stressors arise. Second, cognitive vulnerability lies latent until triggered by stressors, while performance goal vulnerability is operative (i.e., “in motion”) prior to stressors (Dykman, Reference Dykman1998). Thus, early identification may inform prevention efforts and support the design of more effective interventions for these vulnerable children.
Performance-goal-based vulnerability at multiple levels of analysis
If performance goals contribute to depression vulnerability, then this should be evident across levels of analysis with demonstrated links to depression in children (Cummings, El-Sheikh, Kouros, & Keller, Reference Cummings, El-Sheikh, Kouros and Keller2007; Greaven, Santor, Thompson, & Zuroff, Reference Greaven, Santor, Thompson and Zuroff2000; Lopez-Duran, Kovacs, & George, Reference Lopez-Duran, Kovacs and George2009; Owens et al., Reference Owens, Helms, Rudolph, Hastings, Nock and Prinstein2019). Objective behavioral evidence in support of this claim suggests that performance goals are associated with observed helpless responses (e.g., withdrawal of effort, less persistence, self-handicapping) to academic tasks (Anderman, Griesinger, & Westerfield, Reference Anderman, Griesinger and Westerfield1998; Elliot & Dweck, Reference Elliot and Dweck1988; Grant & Dweck, Reference Grant and Dweck2003; ; Urdan, Reference Urdan2004; Urdan, Midgley & Anderman, Reference Urdan, Midgley and Anderman1998). However, despite theoretical premise (Dykman, Reference Dykman1998; Sideridis, Reference Sideridis2005), evidence that performance goals contribute to physiologic hyperarousal in response to stressors in academic settings is limited. Such information could help identify mechanisms by which performance goals contribute to vulnerability, given the well-established role stressor-induced physiologic dysregulation plays in risk for depression. Indeed, studies utilizing salivary cortisol and skin conductance level as indices of hypothalamic–pituitary–adrenal axis (HPA) and sympathetic nervous system (SNS) activity implicate hyper-reactivity in children's risk for depression (Cummings et al., Reference Cummings, El-Sheikh, Kouros and Keller2007; Lopez-Duran et al., Reference Lopez-Duran, Kovacs and George2009).
The Trier Social Stress Test (TSST; Kudielka, Hellhammer, & Kirschbaum, Reference Kudielka, Hellhammer, Kirschbaum, Harmon-Jones and Winkielman2007) is a laboratory-based stressor that may be useful in examining performance goals at multiple levels. The TSST resembles a school-based task that challenges children to show their academic (i.e., how smart they are) and social (i.e., how good a friend they are) skills in a novel context, ostensibly evaluating abilities that children with performance goals hold to be the basis of self-worth (e.g., intelligence, likeability). Second, in line with theory and the limited adult evidence that normative (i.e., “do better than the others”) goals exert the most debilitating effects on physiologic arousal and performance (Grant & Dweck, Reference Grant and Dweck2003, Sideridis, Reference Sideridis2008; Sideridis, Antoniou, & Simos, Reference Sideridis, Antoniou and Simos2013), children are informed that a “panel of experts” (i.e., confederates unknown to the child) will judge how well they do relative to others in their grade. Being judged induces socio-evaluative threat (e.g., concern that some self-aspect could be negatively viewed), which elicits physiologic responses for children in general (Gunnar, Talge, & Herrera, Reference Gunnar, Talge and Herrera2009). For those with performance goals, knowing that this judgement (i.e., key to self-worth) will be made relative to others in their grade (i.e., normative goal induction) could contribute to dysregulated responses beyond socio-evaluative threat alone. Third, in line with views about uncertainty (i.e., not knowing how well one is doing relative to others) as a central feature of normative goal debilitating effects (Darnon, Harackiewicz, Butera, Mugny, & Quiamzade, Reference Darnon, Harackiewicz, Butera, Mugny and Quiamzade2007; Lambird & Mann, Reference Lambird and Mann2006; Sideridis et al., Reference Sideridis, Antoniou and Simos2013), children are not given any evaluation criteria or feedback. That confederates withhold reassurance helps create the uncontrollability (e.g., cannot sway evaluation) element known to produce physiologic responses for the average child (Gunnar et al., Reference Gunnar, Talge and Herrera2009). For those with performance goals, not knowing how to sway the judges or how well they perform relative to others may particularly hinder engagement and increase arousal.
As per Dykman (Reference Dykman1998), in the face of a stressor that casts doubt on ability to perform at desired levels, individuals with performance goals display cognitive (e.g., rumination), behavioral (e.g., withdraw effort), emotional (e.g., negative affect), and physiological (e.g., hyperarousal) responses to stressFootnote 2 associated with risk for depression. Thus, we anticipated that children with performance goals would exhibit depressotypic function across similar levels of analysis. At the subjective experience level, we expected children with performance goals to report greater internalizing problems and more predominant involuntary stress responses. We also expected that children with performance goals would view the TSST as more stressful and distressing and, thus, report greater subjective stress and negative affect in response to the TSST. At the objective behavior level, we expected children with performance goals to exhibit helpless responses to the TSST (i.e., withdrawing effort) in the form of less behavioral persistenceFootnote 3 (i.e., less time speaking, fewer math responses). At the physiologic arousal level, we expected that performance goal driven concerns about demonstrating ability would manifest as HPA (i.e., salivary cortisol) and SNS (i.e., skin conductance level) hyperreactivity to the TSST.
Regulatory fit
Following a stressor, children rely on effortful coping (i.e., voluntary emotional, cognitive, and behavioral responses) to help them feel better (Connor-Smith et al., Reference Connor-Smith, Compas, Wadsworth, Thomsen and Saltzman2000). Children vulnerable to depression tend to use fewer engagement (e.g., active, approach-related) coping skills and rely more on disengagement (e.g., passive, avoidance-related) coping for this purpose (Compas et al., Reference Compas, Connor-Smith, Saltzman, Thomsen and Wadsworth2001). Yet, research suggests that engagement coping skills, like distraction, help children re-engage attention away from the source of stress towards productive or soothing activities, while disengagement coping strategies, like avoidance, inadvertently refocus their attention to the source of stress and contribute to negative thoughts and rumination that exacerbate and prolong (i.e., protracted recovery) rather than alleviate (i.e., efficient recovery) stress (Connor-Smith et al., Reference Connor-Smith, Compas, Wadsworth, Thomsen and Saltzman2000; Wenzlaff & Wegner, Reference Wenzlaff and Wegner2000). Indeed, negative thoughts and rumination are known to contribute to protracted physiologic recovery (Shull et al., Reference Shull, Mayer, McGinnis, Geiss, Vargas and Lopez-Duran2016; Zoccola & Dickerson, Reference Zoccola and Dickerson2012), a pattern implicated in children's risk for depression (Ji, Negriff, Kim, & Susman, Reference Ji, Negriff, Kim and Susman2016; Lopez-Duran et al., Reference Lopez-Duran, McGinnis, Kuhlman, Geiss, Vargas and Mayer2015).
If the above postulation is true, why do children vulnerable to depression tend to rely more on avoidance and less so on distraction? Several theories and programs of research implicate regulatory fit between children's goals, the vulnerable self-beliefs that back them, and resulting strategies (Higgins, Reference Higgins2005; Rothbaum et al., Reference Rothbaum, Morling and Rusk2009). As per Dykman (Reference Dykman1998), individuals with performance goals attempt to prove self-worth (e.g., show ability) when they are certain they are able and choose to protect self-worth (e.g., avoid showing inability) when they are uncertain if they are able. Thus, following stressors that cast doubt on their abilities, avoidance may provide optimal regulatory fit for children with performance goals. By helping these children evade potential demonstrations of incompetence, avoidance may help sustain, satisfy, and serve their motivation to protect self-worth. Avoidance for these children may also be egosyntonic and, thus, self-affirming because it aligns with the vulnerable self-beliefs that undergird their performance goals: ability is fixed, key to self-worth, and must be guarded in times of uncertainty. Still further, avoidance-related, inadvertent refocusing of attention towards the source of stress (e.g., negative thoughts, rumination) may also present certain benefits to these children. Specifically, avoidance-related rumination in the context of performance goals has been conceptualized a defensive form of self-handicapping that aligns with vulnerable self-beliefs and serves goals to protect self-worth (Higgins, Snyder, & Berglas, Reference Higgins, Snyder and Berglas1990; Rhodewalt & Vohs, Reference Rhodewalt, Vohs, Elliot and Dweck2005; Rothbaum et al., Reference Rothbaum, Morling and Rusk2009). That is, rumination may permit children with performance goals to build a “mountain of evidence” that justifies the cessation of additional action and affirms how unlikely it is that further action will help prove self-worth (Nolen-Hoeksema, Wisco, & Lyubomirsky, Reference Nolen-Hoeksema, Wisco and Lyubomirsky2008).
Conversely, following a stressor that brings ability into question, distraction may provide poor regulatory fit for children with performance goals. Distraction requires additional approach-related effort and engagement in productive or soothing activities in order to be effective and may, therefore, be at odds with these children's goals to avoid potentially showing any additional inabilities or further ineptitude (i.e., protect self-worth). Distraction may also be egodystonic, and, thus, self-alienating because it invalidates real concerns about appearing incompetent and feeling worthless. Additionally, distraction may limit how consumed these children may become in rumination (i.e., distraction's intended purpose) and ironically interfere with rumination's self-protective functions. Alternatively, rumination may hamper how subsumed these children may become in productive and soothing distraction activities (i.e., regulatory interference; Bendezú, Perzow, & Wadsworth, Reference Bendezú, Perzow and Wadsworth2016) and inadvertently contribute to “backfire” effects (e.g., guilt, sense of failure) following difficulties with distraction (Compas et al., Reference Compas, Connor, Saltzman, Thomsen, Wadsworth, Lewis and Ramsey1999; Kelly & Kahn, Reference Kelly and Kahn1994).
If avoidance and distraction make differential contributions to regulatory fit as described, then this should be evident in the rate at which children's stress biomarkers return towards baseline (i.e., physiologic recovery). Wadsworth et al. (Reference Wadsworth, Bendezú, Loughlin-Presnal, Ahlkvist, Tilghman-Osborne, Bianco and Hurwich-Reiss2018) extended the TSST methodology to test this proposition. According to Responses to Stress (RTS) theory (Connor-Smith et al., Reference Connor-Smith, Compas, Wadsworth, Thomsen and Saltzman2000), children's coping manifests in the recovery period following stressor exposure and influences physiological recovery efficiency. Relatedly, if performance goals are cognitive forms of regulation involved in the generation of overt behavior beyond biologically based responding (Elliot &Thrash, Reference Elliot and Thrash2002), they may provide focus to children's effortful coping, guide attempts to manage involuntary stress reactivity, and therefor also be relevant to physiologic recovery. In the current study, children were primed with either distraction (e.g., engaging with toys, art supplies) or avoidance (e.g., children told to “Try your best not to think about your performance”) coping immediately after the TSST. Given their tendency to ruminate and question self-worth in the wake of stressors that call ability into question (Grant & Dweck, Reference Grant and Dweck2003), we expected children with performance goals to display HPA (i.e., salivary cortisol) and SNS (i.e., skin conductance level) protracted recovery following the TSST. However, we also expected that their rates of recovery would vary by coping condition, with avoidance contributing to optimal regulatory fit and efficient physiologic recovery and distraction contributing to poor regulatory fit and protracted physiologic recovery.
The moderating role of attachment security
Attachment theory may lend developmentally sensitive insight into performance-goal-based vulnerability and individual differences therein. Stressful events activate children's attachment system and trigger mental representations of themselves (i.e., internal working models; Vaughn et al., Reference Vaughn, Coppola, Verissimo, Monteiro, Santos, Posada and McBride2007) as worthy of being cared for by their attachment figures (Bowlby, Reference Bowlby1973). Although each is independently associated with depression, it is possible that performance goals and attachment security synergistically contribute to depression vulnerability vis-à-vis their shared links to beliefs about self-worth (Lee & Hankin, Reference Lee and Hankin2009; Park, Crocker, & Mickelson, Reference Park, Crocker and Mickelson2004). For children with performance goals and insecure attachment, demonstrating ability may function as regulatory attempts to seek reassurance of their self-worth and worthiness of care while concomitantly defending against an internalized sense of being worthless and unworthy of care. These children may also lack a secure base (i.e., responsive caregiver support) to fall back on to help repair damage to self-worth resulting from difficulties demonstrating competence.
Attachment theory may also help clarify why performance goals at times predict salutary outcomes in academic settings (Church, Elliot, & Gable, Reference Church, Elliot and Gable2001; Elliot & McGregor, Reference Elliot and McGregor1999; Harackiewicz, Barron, Carter, Lehto, & Elliot, Reference Harackiewicz, Barron, Carter, Lehto and Elliot1997). When children receive the unconditional acceptance and care associated with secure attachment, their self-worth is generally less contingent across domains; i.e., noncontingent self-worth (Cassidy & Shaver, Reference Cassidy and Shaver2008; Crocker & Park, Reference Crocker and Park2004). Thus, secure attachment may buffer performance-goal-related vulnerability by loosening the cognitive tie between ability and self-worth. Integrating Bowlby's (Reference Bowlby1979) and Dykman's (Reference Dykman1998) positions, children with performance goals and secure attachment may be less susceptible to depression because demonstrations of competence are less reflective of their basic self-worth but also because they feel worthy of care when questions about competence rise.
The current study
The following aims and hypotheses are organized by level of analysis examined. Aim 1 examined performance goal to subjective experience associations. H1a: Performance goals will be positively associated with self- and parent-reported internalizing problems and involuntary stress responses. H1b: Performance goals will be positively associated with subjective stress and negative affect response to the TSST. H1c: Aim 1 associations will be weaker and stronger in the presence of secure and insecure attachment, respectively. Aim 2 examined performance goal to objective behavior associations. H2a: Performance goals will be negatively associated with behavioral persistence (operationalized as the length of time speaking and number of numeric responses given). H2b: Aim 2 associations will be weaker and stronger in the presence of secure and insecure attachment, respectively. Aim 3 examined performance goal to physiologic (i.e., HPA, salivary cortisol; SNS, skin conductance level) arousal associations. H3a: Performance goals will be positively associated with physiologic hyperreactivity (operationalized as strong positive linear change) to the TSST, and that this association would be weaker and stronger in the presence of secure and insecure attachment, respectively. H3b: Performance goals will be positively associated with physiologic protracted recovery (operationalized as weak negative linear change) after the TSST, and that this association would be weaker and stronger in the context of secure and insecure attachment, respectively. H3c: Children with performance goals will display more protracted (i.e., weaker negative) recovery in distraction and less protracted (i.e., stronger negative) recovery in avoidance, with weaker (i.e., less protracted in distraction, more protracted in avoidance) and stronger (i.e., more protracted in distraction, less protracted in avoidance) associations found in the context of secure and insecure attachment, respectively.
Methods
Participants
Fourth and fifth grade children (N = 121, Mage = 10.56 years, SD = 0.68, Min = 9.08, Max = 12.00, 51.6% male) and a parent (90.1% mothers) were recruited from suburban schools in the northeastern US. Median annual household income was $66,000.00; Min = $13,638.84, Max = $245,000.00. Most children (90.1%) and parents (92.6%) identified as White. The rest of the sample either identified as Asian (child = 2.5%, parent = 1.7%), American Indian/Alaska Native (child = 1.7%, parent = 0.0%), African American (child = 0.8%, parent = 0.0%), Other (child = 1.7%, parent = 0.0%), or declined to respond (child = 3.3%, parent = 5.8%).
Procedures
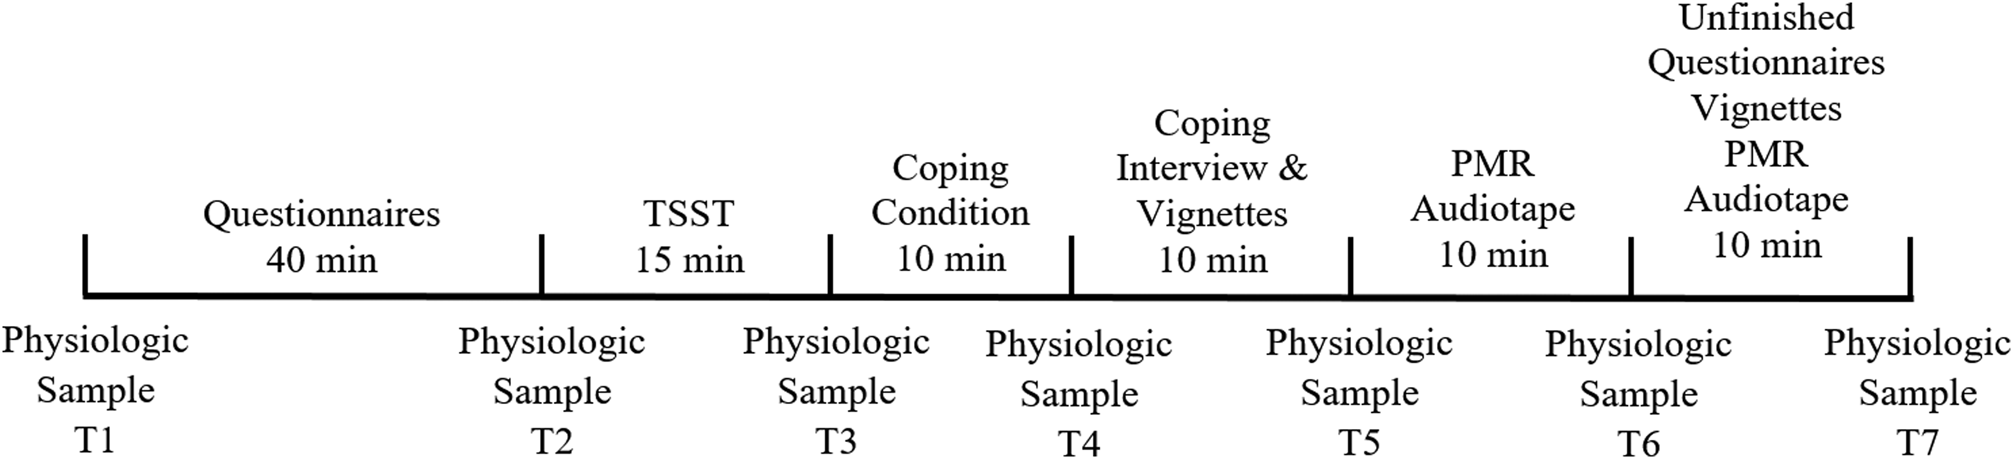
As outlined in Wadsworth et al. (Reference Wadsworth, Bendezú, Loughlin-Presnal, Ahlkvist, Tilghman-Osborne, Bianco and Hurwich-Reiss2018), interested parents enrolled their child, provided consent, and completed questionnaires online: e.g., Behavior Assessment System for Children, 2nd Edition (BASC-2; Reynolds & Kamphaus, Reference Reynolds and Kamphaus2004), Pubertal Development Scale (PDS; Petersen, Crockett, Richards, & Boxer, Reference Petersen, Crockett, Richards and Boxer1988), Early Adolescent Temperament Questionnaire (EAT-Q; Capaldi & Rothbart, Reference Capaldi and Rothbart1992). Children were then scheduled for their 95 min in-person experiment which took place one to two weeks following parents’ online enrollment, consent, and questionnaire completion. Parents were instructed to arrive five minutes early for assenting procedures and to have their children refrain from brushing their teeth, consuming a large meal, dairy, or sugary and acidic foods within an hour of their scheduled arrival time. Parents were reminded of these instructions via phone call and email the day before their appointment. To minimize time-of-day effects and related diurnal variation in cortisol (e.g., Perry, Donzella, Parentau, Desjardins, & Gunnar, Reference Perry, Donzella, Parenteau, Desjardins and Gunnar2019), appointments were scheduled in the afternoon within 30 min of each other (i.e., 3:30 pm, 4:00 pm, 4:30 pm). A timeline of the experimental procedure is depicted in Figure 1. At each of seven time points (T1–T7), saliva samples were collected via passive drool into vials and electrodermal activity (EDA) time stamps were created via button press on a wireless sensor. Upon arrival, families were greeted by an experimenter (i.e., doctoral student of child clinical psychology) assigned to work with the child for the duration of the protocol. This experimenter escorted family to a “home base” data collection room. The child briefly rinsed their mouth with bottled water and provided assent while the parent reviewed the online consent. Afterward, the parent walked to the lobby and remained there for the duration of the visit. Then, the experimenter placed a wireless sensor on the child's nondominant ankle, collected a saliva sample, and created a time stamp (T1). Next, the experimenter administered questionnaires to the child in the following order: BASC-2 (Reynolds & Kamphaus, Reference Reynolds and Kamphaus2004), Responses to Stress Questionnaire (RSQ; Connor-Smith et al., Reference Connor-Smith, Compas, Wadsworth, Thomsen and Saltzman2000), Security Scale (Kerns, Klepac, & Cole, Reference Kerns, Klepac and Cole1996), and Patterns of Adaptive Learning Survey (PALS, Midgley et al., Reference Midgley, Maehr, Hruda, Anderman, Anderman, Freeman and Urdan2000). Afterward, the experimenter collected/ created a second sample/time stamp (T2). Children were then escorted by the experimenter to a separate room (15 s) to complete a videotaped TSST, where children were instructed to prepare (5 min) and verbally deliver (5 min) a speech (i.e., describing themselves and why they should be liked to an imaginary audience of new teachers and classmates on the first day of school) as well as count backwards by 3 from 301 (5 min) in front of a “panel of experts” (i.e., confederates unknown to participants and unaware of coping condition). As recommended (Kudielka et al., Reference Kudielka, Hellhammer, Kirschbaum, Harmon-Jones and Winkielman2007), confederates remained unresponsive (i.e., maintained neutral affect, no facial or verbal feedback) and limited interactions to (a) prompting the child if their speech ended before 5 min (e.g., after 20 s of silence, “Please continue your speech as there is still time left”) and (b) interrupting the child each time they made a math error (e.g., “That's incorrect. Please start at 301”). Afterward, children walked back to home base with their experimenter (15 s). A third sample/time stamp was collected/created (T3). Children were then escorted (15 s) to one of two rooms (10 min): a distraction room (n = 62) with musical instruments, art supplies, and toys placed on a table where they were asked to sit and invited to play with the materials if they wished, and an avoidance room (n = 59) free of distractions where they were prompted to sit at a table and try not to think about their performance.Footnote 4 Children were randomized to coping condition within gender.Footnote 5 Study staff were not privy to the results of this process. After the coping condition, children walked back to home base with their experimenter (15 s) and a fourth sample/time stamp was collected/created (T4). Children were then interviewed (i.e., 10 Likert-type items, six free response questions) by the experimenter about their TSST and coping experiences (5 min) and responded to three coping vignettes (5 min). A fifth sample/time stamp was collected/created (T5). Next, children and their experimenter sat, listened, and moved to a progressive muscle relaxation (PMR) audio tape (10 min).Footnote 6 A sixth sample/time stamp was collected/created (T6). Next, the experimenter administered remaining questionnaires or vignettes,Footnote 7 after which the child was invited to listen to the PMR tape (10 min). Then, a seventh saliva sample/time stamp was collected/recorded (T7). Children were debriefed and families received $50 for participating.
Annotated timeline of the 95 min experimental protocol. TSST denotes the Trier Social Stress Test. PMR denotes the audiotaped progressive muscle relaxation exercise.

Measures
Child performance goal orientation
Children completed selected subscales (n items = 14) of the PALS (Midgley et al., Reference Midgley, Maehr, Hruda, Anderman, Anderman, Freeman and Urdan2000). The measure contains scales for performance-approach (e.g. “One of my goals is to look smart in comparison to the other students in my class”) and performance-avoidance goal orientation (e.g. “One of my goals is to keep others from thinking I'm not smart in class”) with items measured on a 1 (not at all true) to 5 (very true) scale. Performance-approach and performance-avoidance factor scores were strong positively correlated (r = .57). In keeping with study aims and theoretical premise (Dykman, Reference Dykman1998), we created a robust index of performance orientation by aggregating both performance factor scores (Mesa, Reference Mesa2012; Murdock, Miller, & Goetzinger, Reference Murdock, Miller and Goetzinger2007).Footnote 8 The resulting performance goal orientation factor demonstrated adequate internal consistency (α = 0.83).
Child attachment security
Children completed the Security Scale (Kerns et al., Reference Kerns, Klepac and Cole1996), a 15-item measure assessing children's perceptions of (a) their mother as responsive and available, (b) their tendency to rely on her for help in the face of stress, and (c) their ease of communicating thoughts and feelings to her. For each item, children rated one of two statements (e.g., “Some kids find it easy to trust their mom BUT other kids are not sure if they can trust their mom”) as either sort of true or really true. Items scores (1–4) were averaged, with higher scores indicating greater secure attachment. This composite demonstrated adequate internal consistency (α = 0.88).
Child internalizing problems
The BASC-2 (Reynolds & Kamphaus, Reference Reynolds and Kamphaus2004) was used to assess child depressive problems. The BASC-2 is a multidimensional assessment that measures both clinical and adaptive aspects of behavior and personality. Children completed the Self Report of Personality—Child (SRP-C, ages 8–11 years, n items = 139) and parents completed the Parent Rating Scales—Child (PRS-C, ages 6–11 years, n items = 160).Footnote 9 The SRP and PRS are reliable and valid measures of psychopathology and problem behavior with internal consistency ranging from 0.83 to 0.90 and 0.76 to 0.95 for the SRP and PRS, respectively. In an effort to use multiple informants and reduce the number of tests performed, the SRP and PRS Internalizing broadband scales were used as robust indices of depressotypic function of interest to the current investigation (e.g., depression, low self-esteem, inadequacy). T-scores with combined gender norms were used to ensure the scale integrity.
Child involuntary engagement stress responses
Children (i.e., self-report) and parents (i.e., parent-report of child) completed the RSQ—Social Stress (Connor-Smith et al., Reference Connor-Smith, Compas, Wadsworth, Thomsen and Saltzman2000). The RSQ has 57 items and 19 subscales, which are often combined to form three effortful coping and two involuntary stress response factors. In an effort to use multiple informants and reduce the number of tests performed, the child- (α = 0.92) and parent-reported (α = 0.88) involuntary engagement stress response factors were used as robust indices of depressotypic involuntary stress responses: rumination (e.g., “I can't stop thinking about how I feel or what happened”), intrusive thoughts (e.g., “I keep remembering what happened”), emotional (e.g., “I feel upset right away, my thoughts start racing”) and physiologic arousal (e.g., “Heart races, breathing speeds up, muscles get tight”). Connor-Smith et al. (Reference Connor-Smith, Compas, Wadsworth, Thomsen and Saltzman2000) noted that children often endorse either high or low overall levels across items. To control for this variation in item endorsement base rates, factor scores were divided by the sum of all five factors (Connor-Smith et al., Reference Connor-Smith, Compas, Wadsworth, Thomsen and Saltzman2000), with final ratio scores reflecting the proportion of children's responses to social stress allocated to involuntary engagement stress responses.
TSST negative affect
Prior to (T2) and following (T3) the TSST, subjective emotion ratings were collected to assess whether the TSST successfully induced negative affect. Children were asked to rate the extent to which they presently identified with six feeling items (i.e., Nervous, Sad, Angry, Happy, Excited, Surprised) using a scale ranging from 1 (not at all) (1) to 5 (very). Negative affect scores were computed by aggregating nervous, sad, and angry ratings (α = 0.70). A difference score was computed by subtracting T2 from T3 negative affect scores.
TSST perceived stressfulness
During the coping interview, three items were used to assess children's perceptions of the stressfulness the TSST: “How stressful was it to prepare the speech, knowing that you then had to give it in front of an audience?”, “How stressful was it to be giving the speech in front of the video camera and panel of experts?”, “How stressful was it to be doing subtraction in front of the video camera and panel of experts?”. Children rated perceived stress on 5-point scale from 1 (not at all stressful) to 5 (very stressful). TSST total perceived stressfulness was captured with a composite formed by aggregating scores on all three items.
TSST behavioral persistence
Children's behavior during the TSST was video-recorded. Subsequently, children's speech delivery was coded in 5-s epochs (e.g., 0 = criteria not met, 1 = criteria met). Children's numeric responses when completing the mental subtraction task were also coded. The total time spent delivering the speech as well as total number of numeric responses to the subtraction task were considered indices of behavioral persistence.
Salivary cortisol
Seven saliva samples were collected via passive drool (Davis, Bruce, & Gunnar, Reference Davis, Bruce and Gunnar2002), stored at −20o C in a medical grade ultra-low temperature freezer, and transported on dry ice to the Biomarker Core Lab at Penn State University (Biobehavioral Health Department). Cortisol levels were determined using a commercial expanded-range high-sensitivity enzyme immunosorbent assay kit. Cortisol extraction was run in duplicate and batched in the same order as random assignment. The intra-assay and inter-assay coefficients of variation were 2.0% and 10.2%, respectively.
Skin conductance level
EDA was assessed during the experimental procedure using Affectiva technology (Q Sensor, Affectiva Inc., Waltham, MA). The Q Sensor is a wireless sensor designed to continuously assess EDA in naturalistic settings. As an ambulatory assessment tool, the Q Sensor also collects continuous motor movement (tri-axial accelerometer) data permitting adequate statistical control. The Q Sensor sample rate was 8 Hz and results are provided in microSiemens (mS). Tonic skin conductance level was calculated using Mindware EDA 3.1, with rolling filter (block size = 16) applied, for seven phases: T1 to T1 + 1 min, T1 + 1 min to T2, T2 to T3, T3 to T4, T4 to T5, T5 to T6, T6 to T7.
Covariates
Child gender (0 = male, 1 = female) and family income-to-needs ratio (INR) were included as covariates in all analyses. INR is an index of annual household income relative to national poverty norms. INR between 2.0 and 4.0 and an INR of 1.0 indicates middle-income and poverty, respectively (Evans & Marcynyszyn, Reference Evans and Marcynyszyn2004). In this sample, median INR was 3.01. Given their established associations with HPA and SNS function, pubertal status (Susman et al., Reference Susman, Dockray, Granger, Blades, Randazzo, Heaton and Dorn2010; van den Bos, de Rooij, Miers, Bokhorst, & Westenberg, Reference van den Bos, de Rooij, Miers, Bokhorst and Westenberg2014) and medication use (Granger, Hibel, Fortunato, & Kapelewski, Reference Granger, Hibel, Fortunato and Kapelewski2009; Rohleder & Nater, Reference Rohleder and Nater2009) were included as covariates in Aim 3 analyses. Pubertal status was assessed with the Pubertal Development Scale—Parent (Petersen et al., Reference Petersen, Crockett, Richards and Boxer1988). Girls’ status was indexed by menarche, height, body hair growth, and breast growth (α = 0.71). Boys’ status was indexed by voice changes, height, body and facial hair growth (α = 0.34).Footnote 10 As suggested (Granger et al., Reference Granger, Hibel, Fortunato and Kapelewski2009; Rohleder & Nater, Reference Rohleder and Nater2009), medications were rated (e.g., 0 = not plausible, 1 = plausible, 2 = very plausible) across a series of identified pathways by which they may have influenced the HPA, SNS, and/or their assessment. The total score across all medication ratings was used.Footnote 11 For SNS analyses, movement (i.e., sum of absolute values of change in tri-axial motion over the course of the experimental protocol; O'Haire, McKenzie, Beck, & Slaughter, Reference O'Haire, McKenzie, Beck and Slaughter2015) was also covaried. To maintain consistency across models within their respective study aims and given their conceptual and empirical associations with outcome variables of interest, covariates were retained despite statistical nonsignificance.
Data preparation
Preprocessing
Of the 1,694 possible physiologic samples (i.e., 121 participants with up to seven samples each across two physiologic variables), 35 values (cortisol, n = 17; skin conductance level, n = 18) were ± 3 SDs from the sample mean, removed, and set to missing (Hill-Soderlund et al., Reference Hill-Soderlund, Mills-Koonce, Propper, Calkins, Granger, Moore and Cox2008; van den Bos et al., Reference van den Bos, de Rooij, Miers, Bokhorst and Westenberg2014). Children missing greater than 85% data on a given physiologic indicator (cortisol, n = 3; skin conductance level, n = 8) were excluded from analyses. Excluded children did not significantly differ from the final analysis sample (N = 110) on any study variables (all p > 0.05). Of the 110 participants, 104 had complete cortisol data, three with five samples, and three with four samples. Also, 102 participants had complete skin conductance level data, two with six samples, three with five samples, and one with four samples. Physiologic variable values remained positively skewed and fourth-root transformations helped normalize that data (Miller & Plessow, Reference Miller and Plessow2013). Log10 or ln transformations were used to normalize skewed subjective experience and objective behavior data (Mosteller & Tukey, Reference Mosteller and Tukey1977).
Manipulation check
During the coping interview, children were asked eight open-ended questions about what they did in their coping rooms to make the situation or themselves feel better, even if they felt it did not work. Using the Responses to Stress Coding Manual for In Vivo Coping (Wadsworth, Reference Wadsworth2013), raters masked to coping condition coded the free responses (yes/no) for distraction (e.g., “I drew a tiger and colored”, “I played with the keyboard and Legos”) and avoidance (and/or associated intrusive thoughts) strategies (e.g., “Tried to get the speech out my head”, “Tried not to think about how I did but I kind of did anyways”). Two raters’ coding of 20% of these responses were used to establish reliability (κ = 0.91). The relationship between children's coping condition and reported strategies was significant, χ 2 (1, 109) = 52.52, p < 0.05, suggesting that children complied with the distraction (91%) and avoidance (78%) prompts.
Missing data
Missing value analysis was conducted for all key demographic and study variables in the final sample. Little's (Reference Little1988) missing completely at random (MCAR) test was nonsignificant; χ 2(888) = 938.27 p = 0.12. Thus, the data could be MCAR. Markov Chain Monte Carlo (MCMC) multiple imputation methods (PROC MI, SAS 9.4) were used to avoid power loss related to listwise deletion and maintain consistency of both missing data methods and the analysis sample across the study aims.Footnote 12 As only 2.22% of total data values were missing, the standard five imputations were performed which included all variables used across the three study aims. Pooled parameter estimates were generated using PROC MIANALYZE (SAS 9.4).
Overview of analyses
Aims 1 and 2
Fisher's Z-adjusted partial correlations (PROC CORR, SAS 9.4) were used to examine performance goals, subjective experience (H1a, H1b), and objective behavior (H2a) bivariate effects. Multiple regression (PROC REG, SAS 9.4) was used to test performance goal by attachment security interactive effects on subjective experience (H1c) and observed behavior (H2b). Interactions were computed and probed (Johnson–Neyman technique) as per Hayes (Reference Hayes2013).
Aim 3
Fisher's Z-adjusted partial correlations (PROC CORR, SAS 9.4) were used to examine bivariate associations between performance goals and physiologic arousal indices. Physiologic reactivity (H3a) and recovery (H3b) patterning were analyzed with piecewise growth (i.e., linear reactivity–linear recovery) multilevel models (MLM) (PROC MIXED, SAS 9.4). Baseline indices for SNS (T1) and HPA (T2) biomarkers differed as SCL reactivity can be observed within moments of stress exposure, whereas the appearance of SC in saliva is typically delayed by 15–20 min (De Kloet, Joëls, & Holsboer, Reference De Kloet, Joëls and Holsboer2005). For this reason, T3 SCL (15 min after the TSST start time—hence, indexing SNS reactivity during the 15 m TSST) and T4 SC (25 min after the TSST start time—hence, indexing HPA reactivity 5–10 min into the TSST) indexed peak reactivity, whereas T3-T7 SCL and T4-T7 SC reflect recovery and children's coping efforts (De Kloet et al., Reference De Kloet, Joëls and Holsboer2005). First, within-child variation in Level 1 physiologic response was modeled as a function of intercept, linear reactivity phase sample time, linear recovery phase sample time, and error variance. Second, likelihood ratio chi-square difference tests comparing random intercept, random intercept and linear reactivity slopes, and random intercept and linear reactivity and recovery slopes models were conducted in order to determine the significance of person-specific variation in within-person physiologic response patterns. Third, identified significant between-child variation in Level 1 intercept, linear reactivity, and linear recovery (i.e., cross-level interactions) for the physiological variable of interest was modeled as a function of Level 2 covariates, performance goals, attachment security, performance goals by attachment security interaction, and residual unexplained person-specific deviations (i.e., random effects). To test regulatory fit predictions (H3c), between-child variation in Level 1 linear recovery was modeled as a function of Level 2 coping condition, performance goal by coping condition, attachment security by coping condition, and performance goal by attachment security by coping condition terms. Models were conducted with Kenward–Rogers corrected degrees of freedom. Covariates and predictors (except coping condition) in the cross-level interactions were grand-mean centered. Nonsignificant higher order interaction terms (e.g., for reactivity, performance goals by attachment security; for recovery, performance goal by attachment security by coping condition) were trimmed to examine lower order main and interactive effects that may have been masked.
Results
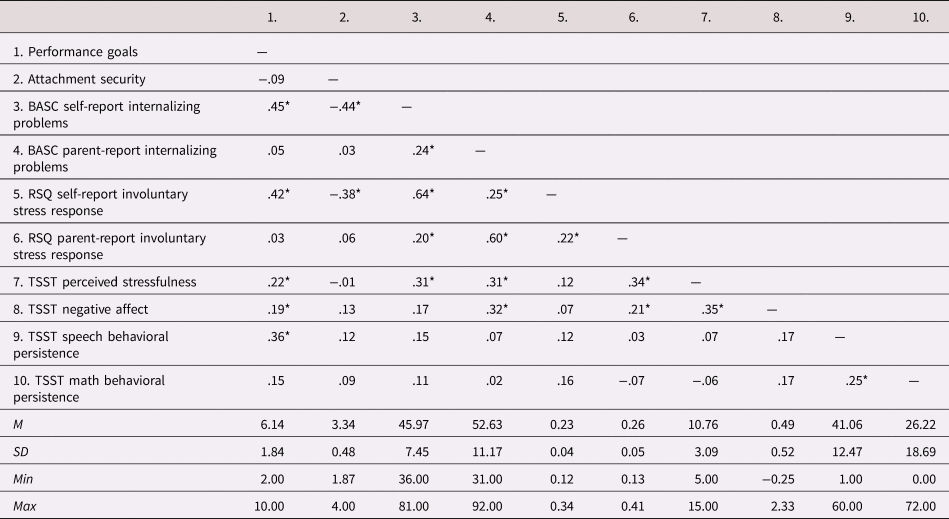
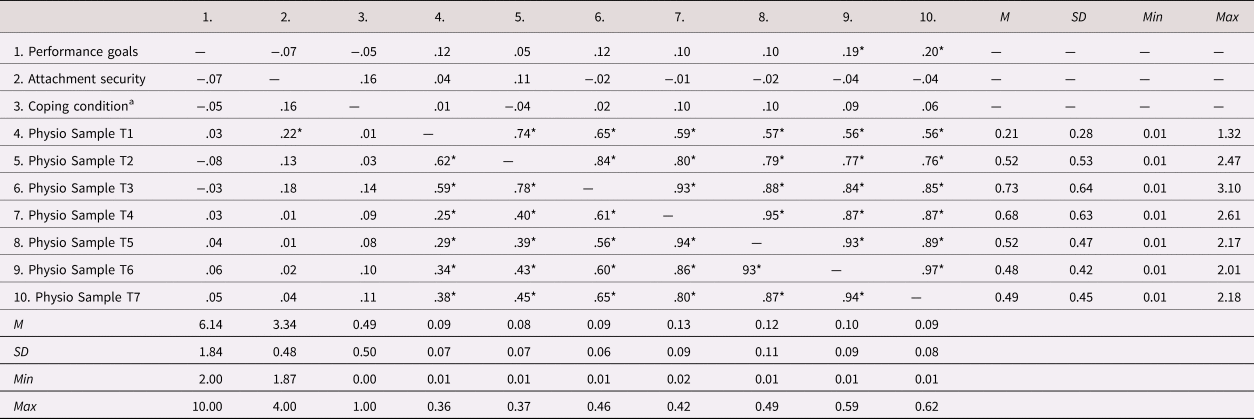
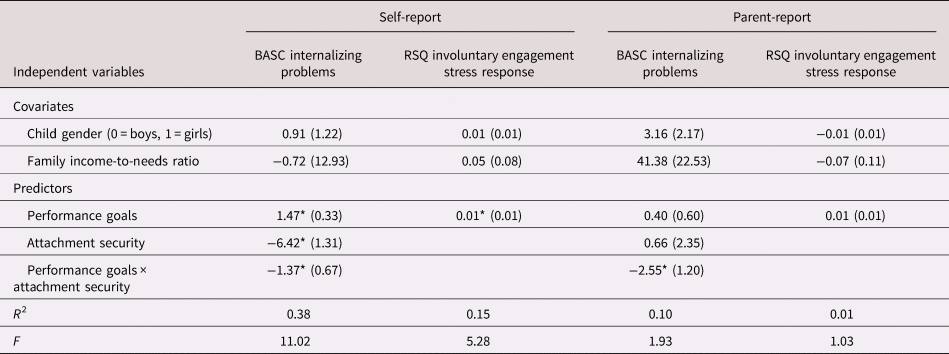
Results are ordered by the study aims and hypotheses. Descriptive statistics and bivariate associations are presented in Tables 1 and 2. Multiple regression results are presented in Tables 3 and 4. MLM results are presented in Tables 5 and 6. When performance goals, attachment security, and/or coping condition interacted to predict the outcome of interest, we interpreted the contribution of lower order effects within the context of the significant higher-order interaction.
Descriptives and partial correlations for performance goals, subjective experience, and objective behavior

Note. N = 110; BASC = Behavior Assessment System for Children; RSQ = Responses to Stress Questionnaire, TSST = Trier Social Stress Test.
* p < .05.
Descriptives and partial correlations for performance goals and physiologic arousal

Note. N = 110; Coping condition coded 0 (avoidance) and 1 (distraction). T = Time. Coefficients above the diagonal reflect correlations for skin conductance level. Coefficients below the diagonal reflect correlations for cortisol. Descriptives to the right of the correlation matrix correspond to skin conductance level. Descriptives underneath the correlation matrix correspond to cortisol.
a = Spearman's rho.
* p < .05.
Parameter estimates (standard errors) for multiple regressions predicting subjective experience of internalizing problems and involuntary engagement stress responses

Note. N = 110; BASC = Behavior Assessment System for Children; RSQ = Responses to Stress Questionnaire.
* p < .05.
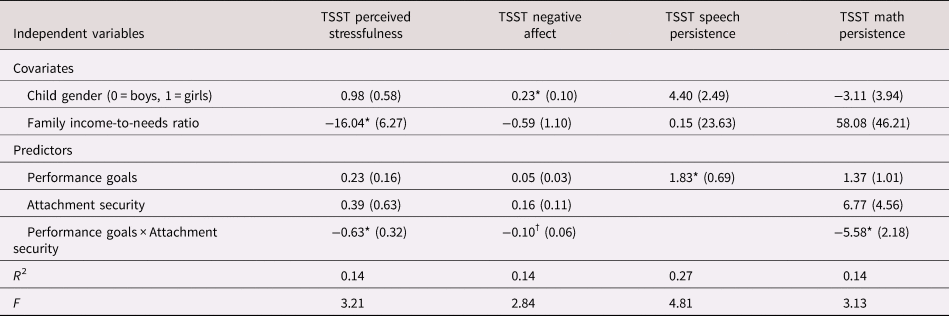
Parameter estimates (standard errors) for multiple regressions predicting subjective experience of and objective behavior in response to the Trier Social Stress Test (TSST)

Note. N = 110; TSST = Trier Social Stress Test.
* p < .05. † p = .08.
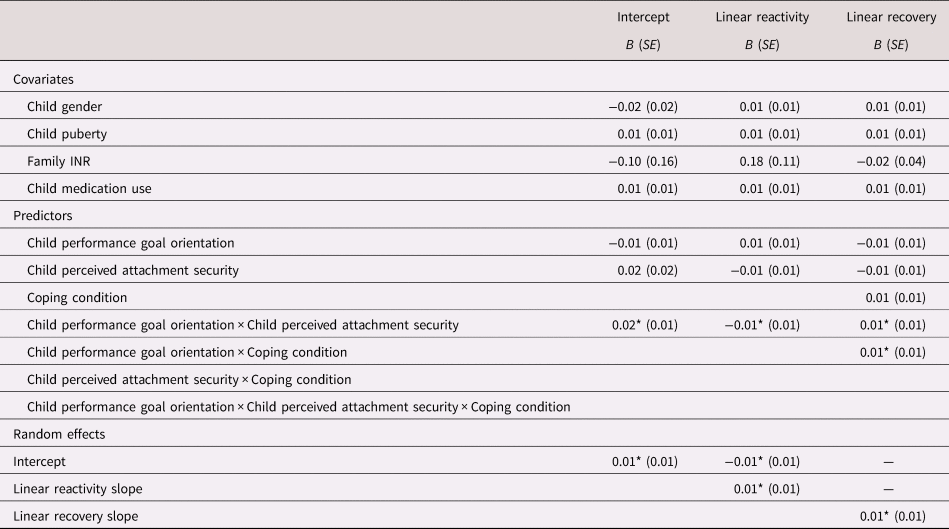
Parameter estimates (standard errors) for piecewise growth multilevel models predicting physiologic arousal via salivary cortisol concentrations

Note. N = 110; INR = income-to-needs ratio. Child gender coded 0 (boys) and 1 (girls). Coping condition coded 0 (avoidance) and 1 (distraction).
* p < .05.
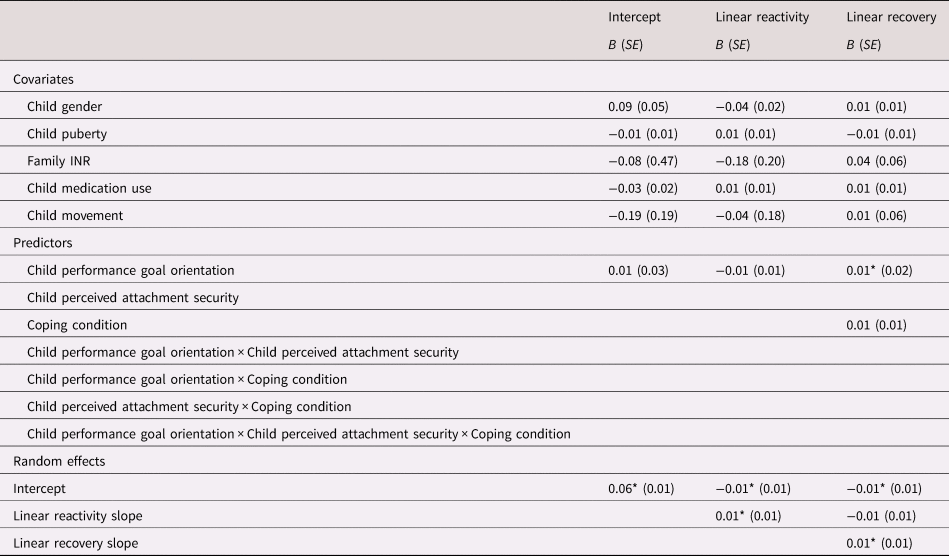
Parameter estimates (standard errors) for piecewise growth multilevel models predicting physiologic arousal via skin conductance levels

Note. N = 110; INR = income-to-needs ratio. Child gender coded 0 (boys) and 1 (girls). Coping condition coded 0 (avoidance) and 1 (distraction).
* p < .05.
Aim 1: Performance goals and subjective experience
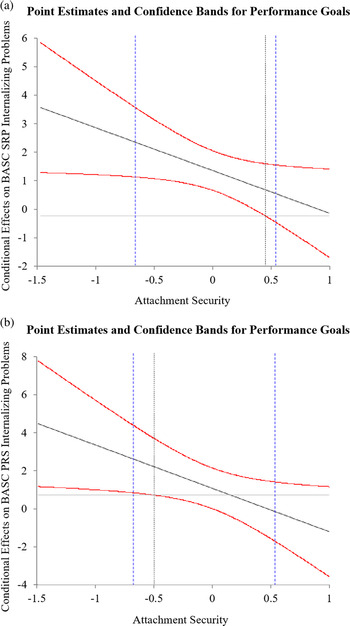
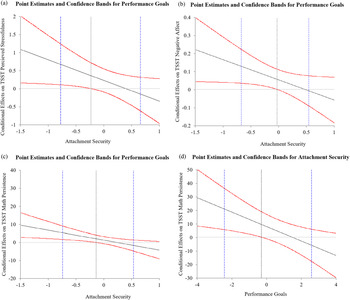
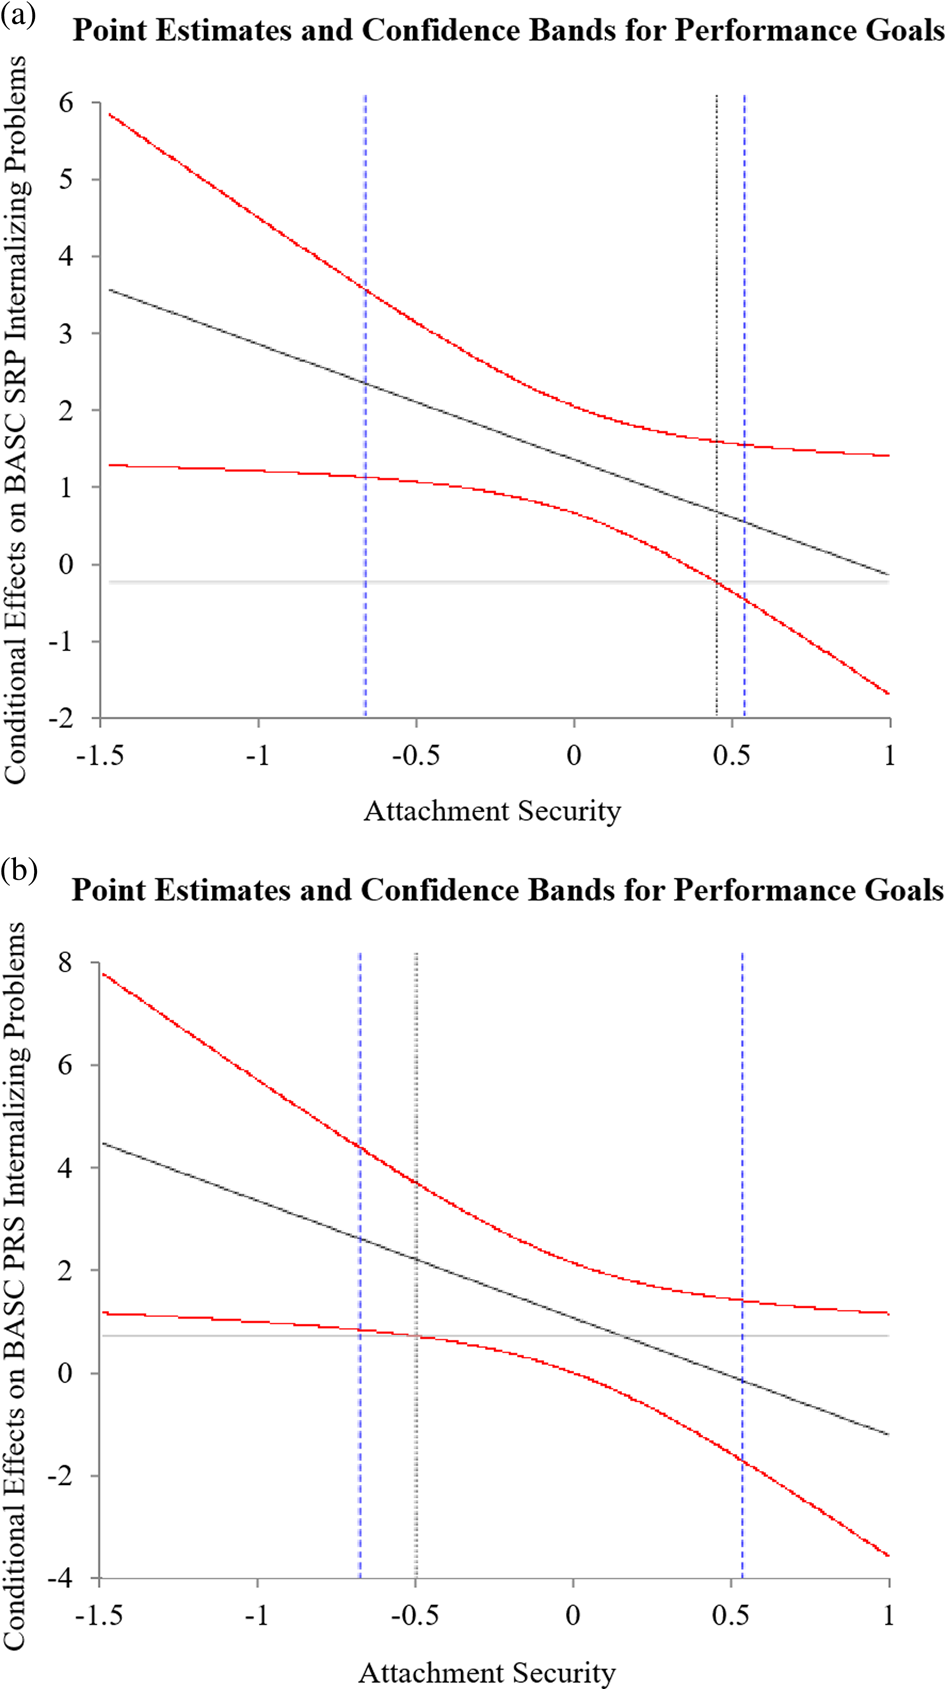
H1a: As expected, performance goals were positively associated with self-reported internalizing problems, r = .45, p < .05, and involuntary engagement stress responses, r = .42, p < .05 (Table 1). Contrary to expectation, no significant bivariate performance goal to parent reported internalizing problems and involuntary engagement stress responses emerged. H1b: As expected, performance goals were positively associated with subjective stress, r = .22, p < .05, and negative affect, r = .19, p < .05, in response to the TSST (Table 1). H1c: As expected, performance goal by attachment security interactions predicting subjective experience indices were significant or trended towards significance (Tables 3 and 4): self-reported internalizing problems, B = −1.37, SE = 0.67, p < .05, parent-reported internalizing problems, B = −2.55, SE = 1.20, p < .05, TSST perceived stressfulness, B = −0.63, SE = 0.32, p < .05, TSST negative affect, B = −0.10, SE = 0.06, p = .08. Johnson–Neyman (J–N) plots (Hayes, Reference Hayes2013) revealed a similar pattern for each interaction (Figures 2 and 3). Specifically, increases in the strength of the positive association between performance goals and subjective experience indices were observed at incrementally lower levels of attachment security. At higher levels of attachment security, the association between performance goals and subjective experience indices became nonsignificant. Contrary to expectation, no significant performance goal by attachment security interactions predicting self- or parent-reported involuntary stress responses emerged. For covariates, family INR was negatively associated with TSST perceived stressfulness, B = −16.04, SE = 6.27, p < .05. Also, girls reported greater TSST negative affect response, B = 0.23, SE = 0.10, p < .05.
Point estimates (thick black lines) and 95% confidence bands (red lines) of the conditional effects of performance goals on Behavioral Assessment System for Children (BASC) (a) child self-reported internalizing problems and (b) parent-report of child internalizing problems across the range of attachment security scores. Purple vertical dashed lines represent 10th and 90th percentile attachment security scores.
Point estimates (thick black lines) and 95% confidence bands (red lines) of the conditional effects of performance goals on Trier Social Stress Test (TSST) (a) perceived stressfulness, (b) negative affect, and (c) math persistence across the range of attachment security scores. In (d), conditional effects of attachment security on TSST math persistence across the range of performance goal scores were plotted for visual clarity of the effect in question. Purple vertical dashed lines represent 10th and 90th percentile moderator scores.

Aim 2: Performance goals and objective behavior
H2a: Contrary to expectation, the performance goal to TSST math persistence bivariate association was nonsignificant. Also, performance goals were positively associated with TSST speech persistence,Footnote 13 r = .36, p < .05 (Table 1). H2b: Contrary to expectation, the performance goal by attachment security interaction predicting TSST speech persistence was nonsignificant. Also, though a significant performance goal by attachment security interaction predicting TSST math persistence emerged as anticipated, B = −5.58, SE = 2.18, p < .05 (Table 4), the direction of the effect was opposite that expected (Figure 3c). The J-N plot showed increases in the strength of the positive relation between performance goals and TSST math persistence at incrementally lower levels of attachment security. At higher attachment security levels, the association between performance goals and TSST math persistence became nonsignificant. To better understand this effect, performance goals were plotted as the moderator of the attachment security and TSST math persistence relation (Figure 3d). The J–N plot showed increases in the strength of the positive association between attachment security positive effects on TSST math persistence at incrementally lower performance goal levels. To better illustrate this effect, simple slopes point estimates for a hypothetical child (“A”) with 90th percentile performance goal and 10th percentile attachment security scores and a hypothetical child (“B”) with 10th percentile performance goal and 90th percentile attachment security scores were examined.Footnote 14 Compared to hypothetical child “A”, simple slope = 5.43, SE = 1.89, p < .05, hypothetical child “B” gave nearly four times as many responses during the math segment of the TSST, simple slope = 21.60, SE = 7.98, p < .05.
Aim 3: Performance goals and physiologic arousal
The Level 1 model of within-person change for both cortisol and skin conductance levels yielded significant main effects for linear reactivity (cortisol, B = 0.03, SE = 0.01, p < .05; skin conductance level, B = 0.15, SE = 0.01, p < .05) and linear recovery (cortisol, B = −0.02, SE = 0.01, p < .05; skin conductance level, B = −0.03, SE = 0.01, p < .05), suggesting that cortisol and skin conductance levels increased and decreased in linear fashion during reactivity and recovery phases, respectively. For cortisol and skin conductance level, models with random intercepts, linear reactivity, and linear recovery slopes best fit the data, relative to models with random intercepts only (cortisol, χ 2 (5) = 289.46, p < .05; skin conductance level, χ 2 (5) = 493.16, p < .05) and random intercepts and linear reactivity slopes (cortisol, χ 2 (3) = 65.92, p < .05; skin conductance level, χ 2 (3) = 109.14, p < .05). For cortisol and skin conductance level, significant random variance in intercepts (cortisol, $\sigma _0^2 = 0.01\comma \;$ SE = 0.01, p < .05; skin conductance level, $\sigma _0^2 = 0.06\comma \;$
 SE = 0.01, p < .05), linear reactivity (cortisol, $\sigma _1^2 = 0.01\comma \;$
 SE = 0.01, p < .05; skin conductance level, $\sigma _1^2 = 0.01\comma \;$
 SE = 0.01, p < .05), and linear recovery (cortisol, $\sigma _2^2 = 0.01\comma \;$
 SE = 0.01, p < .05; skin conductance level, $\sigma _2^2 = 0.01\comma \;$
 SE = 0.01, p < .05) slopes emerged. Thus, we modeled variation in these parameters as a function of Level 2 predictors.Footnote 15
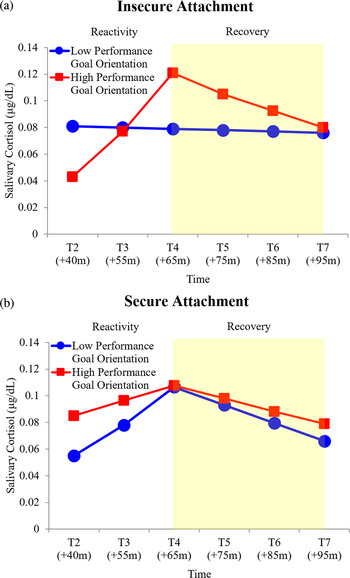
H3a: A significant performance goal, attachment security, and linear time interaction emerged, B = −0.01, p < .05 (Table 5), explaining 6% of the variance in cortisol linear reactivity. As expected, children with performance goals and insecure attachment displayed more hyperreactive cortisol trajectories, characterized by a stronger positive linear pattern (Figure 4a). In contrast, cortisol reactivity for children with performance goals and secure attachment was characterized by a weaker positive linear pattern (Figure 4b). To better understand this effect, simple slopes point estimates for a hypothetical child (“A”) with 90th percentile performance goal and 10th percentile attachment security scores and a hypothetical child (“B”) with 10th percentile performance goal and 90th percentile attachment security scores were examined. Compared to hypothetical child “A”, simple slope = 0.07, SE = 0.02, p < .05, child “B” exhibited more moderate positive linear cortisol reactivity, simple slope = 0.04, SE = 0.01, p < .05. No significant performance goal on skin conductance level reactivity effects emerged (Table 6).
Predicted salivary cortisol levels for high (red line, square markers) and low (blue line, circle markers) performance goal orientation by (a) insecure and (b) secure attachment during reactivity and recovery (shaded region) phases. Predicted trajectories plotted at 10th and 90th percentile performance goal orientation and attachment security values and reverse transformed for illustrative purposes.
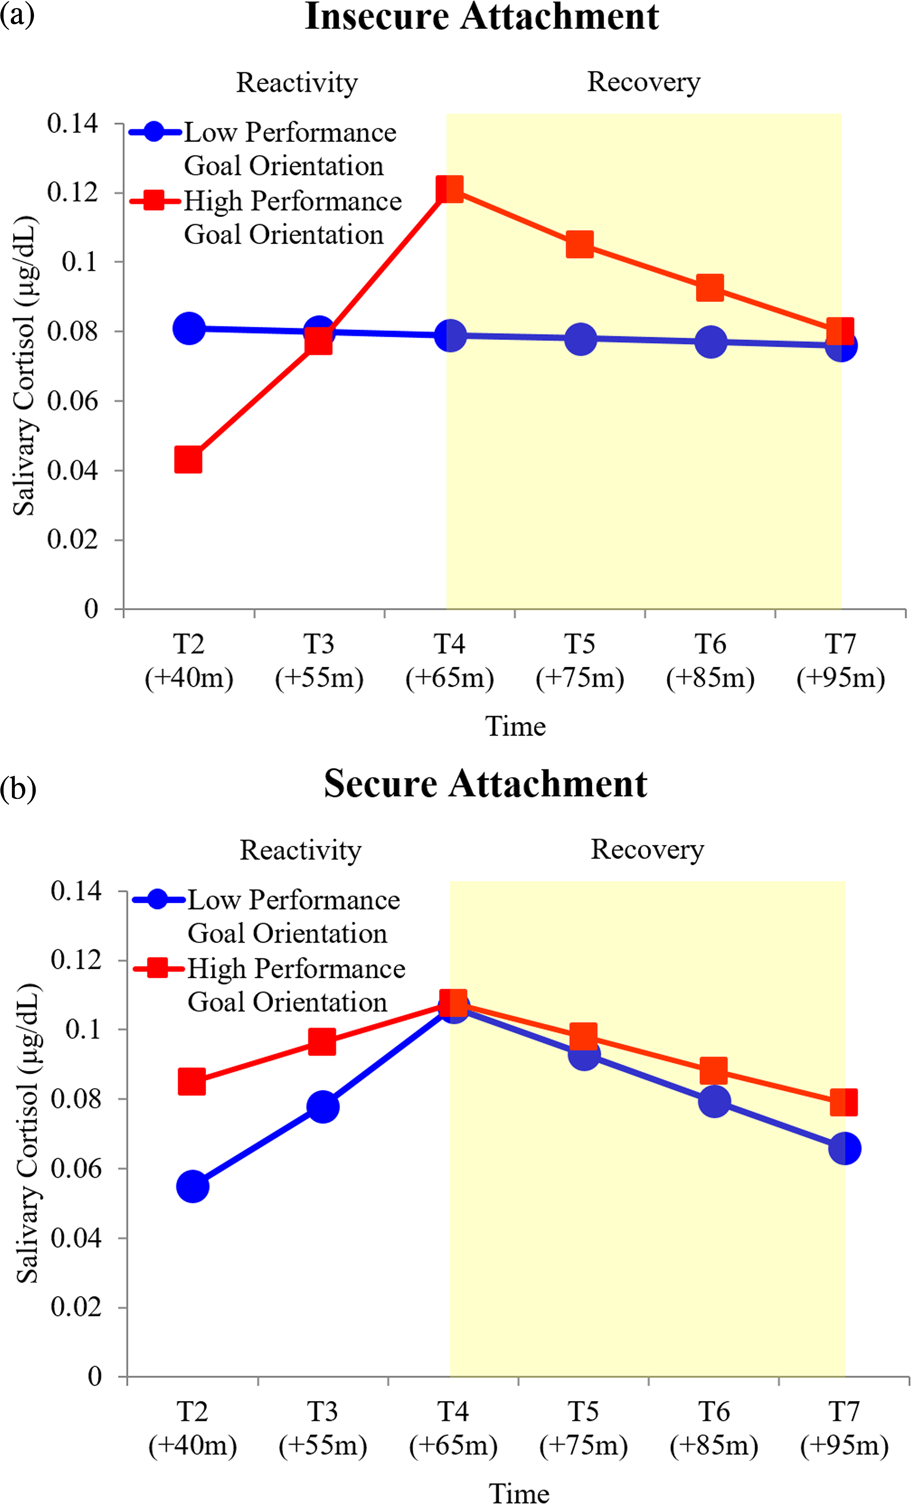
H3b: A significant performance goal, attachment security, and linear time interaction emerged, B = −0.01, p < .05 (Table 5), explaining 6% of the variance in cortisol linear recovery. Cortisol recovery trajectories for children with performance goals and insecure attachment were characterized by a strong negative linear pattern (Figure 4a). In contrast, cortisol recovery trajectories for children with performance goals and secure attachment were characterized by a weak negative linear pattern (Figure 4b). As attachment-security-based individual differences in performance goal to cortisol reactivity associations were observed, it was necessary to gauge cortisol protracted recovery with respect to those observed in reactivity. To do so, we calculated the difference in absolute magnitude of reactivity and recovery simple slopes at 10th and 90th performance goal and attachment security percentile values, with lower and higher difference scores signaling less and more protracted recovery, respectively. Children with performance goals and insecure attachment displayed more protracted recovery (i.e., difference score = 0.04) relative to children with performance goals and secure attachment (i.e., difference score = 0.00).
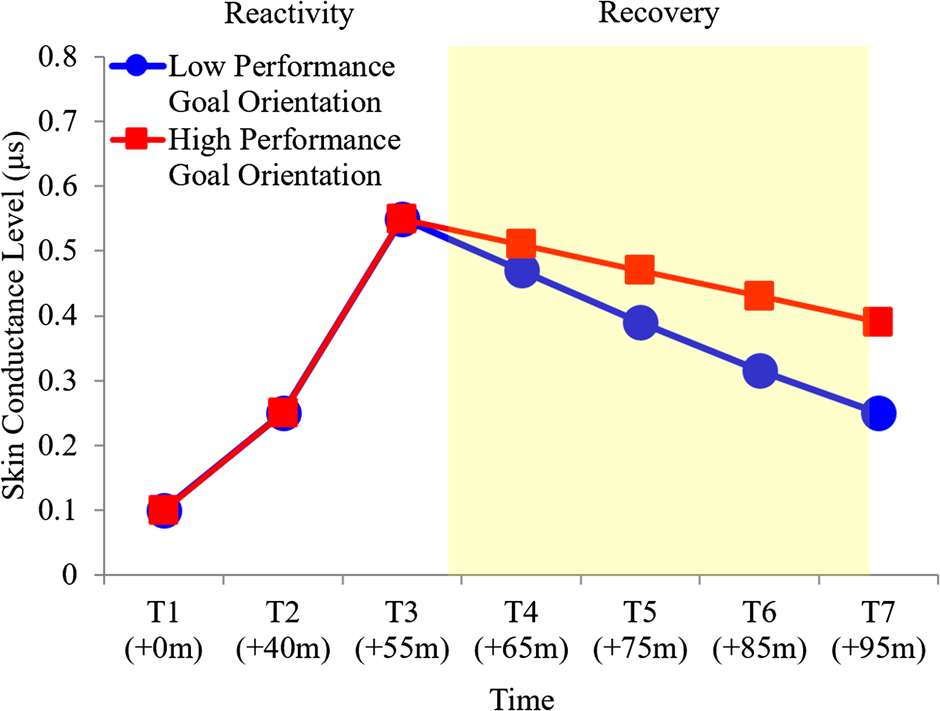
For skin conductance level, a significant performance goal by linear time interaction emerged, B = 0.01, p < .05 (Table 6), explaining 5% of the variance in skin conductance level linear recovery. As predicted, children with higher performance goal orientation displayed more protracted skin conductance level recovery, characterized by a weaker negative linear pattern (Figure 5). Conversely, skin conductance level recovery for children with lower performance goal orientation was less protracted, characterized by a stronger, negative linear pattern.
Predicted skin conductance levels for high (red line, square markers) and low (blue line, circle markers) performance goal orientation during the recovery (shaded region) phase. Nonsignificant reactivity trajectories plotted for visual clarity. Predicted recovery trajectories plotted at 10th and 90th percentile performance goal values and reverse transformed for illustrative purposes.

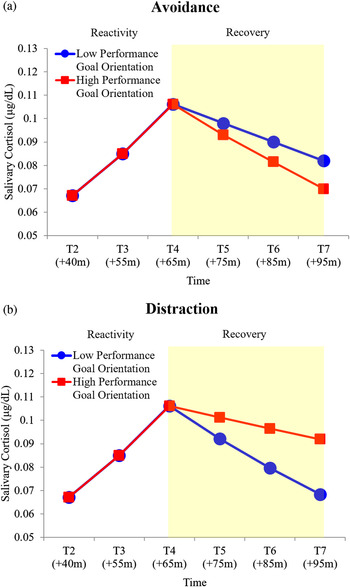
H3c: A significant interaction between performance goals, coping condition, and linear time emerged, B = 0.01, p < .05 (Table 6), explaining 6% of the variance in cortisol linear recovery. As expected, children with higher performance goal orientation demonstrated more protracted cortisol recovery (i.e., weaker negative linear pattern) in the distraction condition and less protracted cortisol recovery (i.e., stronger negative linear pattern) in the avoidance condition (Figure 6a). The opposite was true for children with lower performance goal orientation, with less protracted cortisol recovery (i.e., stronger negative linear pattern) in the distraction condition and more protracted cortisol recovery (i.e., weaker negative linear pattern) in the avoidance condition (Figure 6b). No significant skin conductance level regulatory fit effects emerged.
Predicted salivary cortisol levels for high (red line, square markers) and low (blue line, circle markers) performance goal orientation by (a) avoidance and (b) distraction conditions during the recovery (shaded region) phase. Nonsignificant reactivity trajectories plotted for visual clarity. Predicted recovery trajectories plotted at 10th and 90th percentile performance goal orientation values and reverse transformed for illustrative purposes.

Discussion
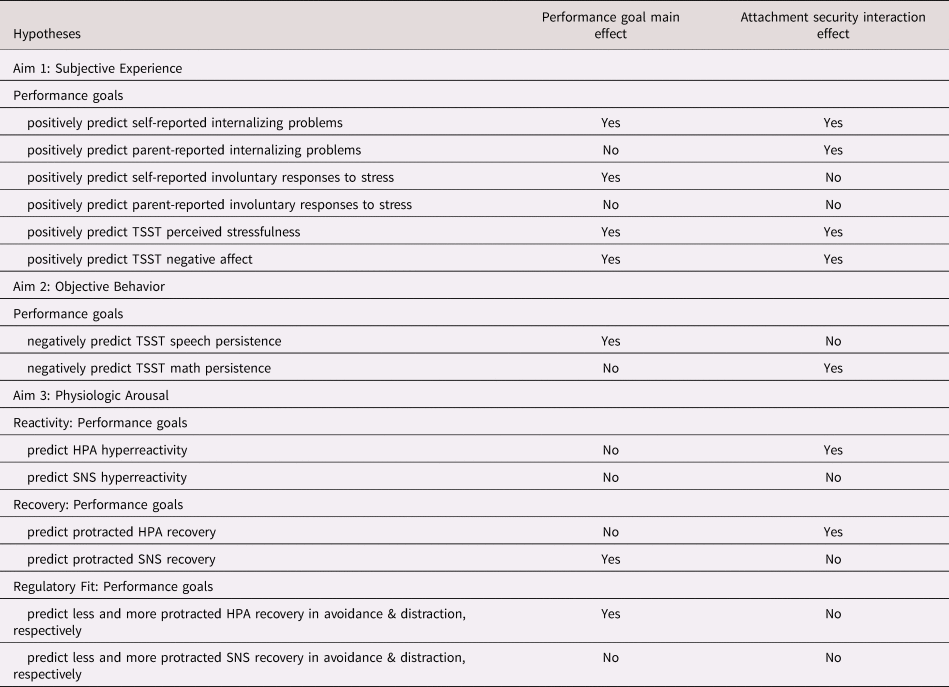
Utilizing an innovative experimental design, the current study examined Dykman's (Reference Dykman1998) goal orientation model of depression vulnerability at multiple levels of analysis (Cicchetti, Reference Cicchetti, Beauchaine and Hinshaw2010) in a community sample of preadolescent boys and girls. A summary of the study aims, hypotheses and results are presented in Table 7. Significant performance goal to subjective experience associations emerged, which varied by children's attachment security perceptions as anticipated. Interactive performance goal by attachment security effects were observed as well when predicting objective behavior, though the direction of these effects was opposite that expected. Preliminary evidence that children's performance goals impact physiologic arousal systems implicated in stress–illness linkages (e.g., HPA, SNS; Doom & Gunnar, Reference Doom and Gunnar2013) also emerged. As physiologic arousal effects also varied by attachment security and our coping experimental manipulation, findings suggest that children's attachment views and coping each work in concert to contribute to and buffer against performance goal-driven physiologic response patterns (e.g., hyperreactivity, protracted recovery) known to confer risk for depression (Lopez-Duran et al., Reference Lopez-Duran, Kovacs and George2009; Ji et al., Reference Ji, Negriff, Kim and Susman2016). As we discuss, this study illustrates a complex matrix of integrative psychobiological relationships over multiple levels of analysis that link children's performance goals to depression vulnerability (Dykman, Reference Dykman1998).
Summary of study aims, hypotheses, and support from study results

Note. BASC = Behavior Assessment System for Children; RSQ = Responses to Stress Questionnaire; TSST = Trier Social Stress Test; HPA = hypothalamic–pituitary–adrenal axis; SNS = sympathetic nervous system.
Performance goals and subjective experience
As expected, children's performance goals were significantly associated with their subjective experience of internalizing problems (e.g., depression, low self-esteem, inadequacy) and involuntary stress responses (e.g., rumination, intrusive thoughts, emotional/physiologic hyperarousal). These findings are consonant with Dykman's (Reference Dykman1998) proposal that striving to demonstrate competence, and thus, self-worth contributes to depression proneness. They also complement evidence of performance-goal-based contributions to depressive problems (Cury, Elliot, DaFonseca, & Moller, Reference Cury, Elliot, Da Fonseca and Moller2006; Turner et al., Reference Turner, Thorpe and Meyer1998; Sideridis, Reference Sideridis2005, Reference Sideridis2007). That performance goals were associated with involuntary stress responses to interpersonal stress specifically (e.g. “I don't have as many friends as I want”; “I often feel left out”) supports Dykman's contention that performance goals reflect preoccupation with likeability that gives rise to negative thoughts and rumination when social setbacks (e.g., trouble making friends, being left out by peers) arise. Still further, and consonant with Dweck's (Reference Dweck1986) and Dykman's (Reference Dykman1998) positions, children with performance goals perceived the TSST to be more stressful and responded to the TSST with greater self-reported negative affect. This finding extends a rather limited evidence base of trait performance goal contributions to in-the-moment subjective stress reactivity (Sideridis, Reference Sideridis2005).
The strength of the positive relation between children's performance goals and subjective experiences (i.e., self- and parent-reported internalizing, TSST stressfulness and negative affect) increased as attachment security decreased. Interactive subjective experience effects emerged for self- and parent-reported internalizing, suggesting that performance goal vulnerability is not limited to children's perceptions. Findings suggest that children with performance goals and insecure views may be especially vulnerable to depression, as they may wrestle with concerns about being worthless (Dykman, Reference Dykman1998) but also unworthy of care (Bowlby, Reference Bowlby1979) when their ability comes under scrutiny. For children with secure views, the effect of performance goals on subjective experience was nonsignificant. Secure attachment is thought to foster noncontigent self-worth; i.e., self-worth less tied to functioning across domains (Crocker & Park, Reference Crocker and Park2004; Cassidy & Shaver, Reference Cassidy and Shaver2008). By loosening the tie between demonstrating ability and self-worth, secure attachment may change the way these children view challenging situations, so that setbacks trigger fewer negative self-beliefs, less ruminative concern about ability, and less perceived stress and negative-affect-related distress when they occur (Dweck, Reference Dweck1999).
Performance goals and objective behavior
Children with performance goals unexpectedly displayed greater speech persistence (i.e., total time speaking) and those with insecure views unexpectedly displayed greater math persistence (i.e., total math responses). These findings contribute to the lively debate regarding performance goal costs and benefits (Elliot & Moller, Reference Elliot and Moller2003; Midgley, Kaplan, & Middleton, Reference Midgley, Kaplan and Middleton2001). Performance goals are not always associated with depression (Elliot & Church, Reference Elliot and Church2003; Kuroda & Sakurai, Reference Kuroda and Sakurai2011) and, at times, are positively associated with effort (Elliot, McGregor, & Gable, Reference Elliot, McGregor and Gable1999) and academic achievement (Church et al., Reference Church, Elliot and Gable2001; Elliot & McGregor, Reference Elliot and McGregor1999). To this end, the findings illustrate potential costs to adopting performance goals at the subjective experience level and point to possible benefits at the objective behavioral level.
Several considerations with respect to these findings are worth noting. First, while normative goal and uncertainty aspects of the TSST were hypothesized to contribute to subjective stress, negative affect, and effort withdrawal, they may actually have supported persistence. Specifically, being motivated to do better than their same-grade peers (i.e., normative goals) but also being given no formal indication of how well they were performing (i.e., uncertainty) may have eased reticence to engage with the TSST associated with the being informed about a relatively poor performance (Dykman, Reference Dykman1998). It is possible that providing children with a benchmark for success (e.g., “Most children can speak for all 5 min and can answer 30 math items correctly. That should be your goal”) or negative feedback (e.g., “Your performance is not as good as others, but you can still catch up”) may encourage children with performance goals to withdraw effort (e.g., self-handicap) if and when their performance falls short of the mark. Further research is needed to test this claim. Second, younger children (e.g., under 12 years of age) have been known to have an immature understanding of ability, rating their competence as higher than it objectively is relative to peers (e.g., Nicholls, Reference Nicholls1984; Reference Nicholls1989). It is possible that perceptions of high ability may have buffered against debilitating normative goal and uncertainty effects on behavioral persistence. Future research that uses a wider age range (e.g., preadolescent, adolescent) and assesses children's perceptions of their ability prior to and following the TSST would be well poised to examine the potential contributions of perceived ability (and age-related individual differences therein) on children's response to the TSST.
Performance goals and physiologic arousal
As expected, performance goals interacted with attachment security to predict physiologic reactivity to the TSST. Specifically, children with performance goals and insecure views displayed HPA hyperreactivity, one hypothesized contributor to performance-goal-based vulnerability (Dykman, Reference Dykman1998). Only two studies have linked performance goals to physiologic reactivity (e.g., electroencephalographic, electromyographic, blood volume pulse, and heart rate), and each focused on adults and omitted links to depression (Sideridis, Reference Sideridis2008; Sideridis et al., Reference Sideridis, Antoniou and Simos2013). Thus, this study is the first to demonstrate this hypothesized relationship and attachment-security-based individual differences therein in a sample of preadolescent boys and girls.
Findings extend prior adult evidence to the youth risk for depression literature and expand that knowledge base in notable ways. First, performance goals may potentially play an important role in HPA-mediated stress to depression pathways (Doom & Gunnar, Reference Doom and Gunnar2013; Lopez-Duran et al., Reference Lopez-Duran, Kovacs and George2009). If so, the frequency at which children face novel stressors in day-to-day schooling is a relevant concern, as repeated hyperactivation places undue biological “wear and tear” on children's developing brains and bodies, and, thus, contributes to risk for mental health problems (e.g., depression; McEwen, Reference Mcewen2000; Sher, Reference Sher2004). Second, performance goal to HPA hyperreactivity patterns emerged only when attachment security was considered. Seeking support from adult caregivers in the face of academic and interpersonal stressors is characteristic of the phenomenology of being a child. For children with performance goals, feeling cared for and trusting in a parent's responsive support, even when not physically present (cf., Gunnar, Reference Gunnar2017), may help to lessen concerns about self-worth and promote autonomous coping (Allen & Miga, Reference Allen and Miga2010; Mikulincer & Shaver, Reference Mikulincer and Shaver2007). Alternatively, lacking this internalized assuredness of care in times of need may increase performance-goal-based vulnerability at the physiologic level.
Integrating findings across the multiple levels of analysis provides insight into the complex manner by which performance goals may increase vulnerability to depression. If children with performance goals demonstrate overt, approach-related behavior (i.e., persistence) when competence is called into question, how, then, are these children most vulnerable to depression? Perhaps overt persistence comes at the expense (e.g., Lucas, Gratch, Cheng, & Marsella, Reference Lucas, Gratch, Cheng and Marsella2015) of covert physiologic hyperarousal, with reactivity in excess of that warranted by the demands of a stressor (Burke, Davis, Otte, & Mohr, Reference Burke, Davis, Otte and Mohr2005). Neuroendocrine activation helps children meet the demands of a stressful encounter (Shirtcliff, Peres, Dismukes, Lee, & Phan, Reference Shirtcliff, Peres, Dismukes, Lee and Phan2014) and use cognitively demanding regulation strategies (Johnson, Perry, Hostinar, & Gunnar, Reference Johnson, Perry, Hostinar and Gunnar2019). Yet, neuroendocrine hyperactivation may oppose efforts to meet these demands. Indeed, performance-goal-related vulnerability to depression may manifest during the reactivity phase as excessive HPA activation that interferes with the regulation of academic performance (e.g. fewer math responses for children with performance goals and insecure views), whereas healthy functioning manifests as moderate HPA activation that supports performance (e.g., greater math responses for children with low-performance goal orientation and secure views).
Performance goals and regulatory fit
Our anticipated recovery phase findings lend further insight into additional putative psychobiological factors that may link performance goals to depression vulnerability. Relative to their low-performance goal counterparts, children with high-performance goal orientation displayed more protracted SNS recovery and those with additional insecure views displayed more protracted HPA recovery following the TSST. Findings suggest that performance-goal-based vulnerability manifests not only as excessive physiologic reactivity to stressors in novel academic and interpersonal contexts but also more limited physiologic recovery capacity. Indeed, protracted recovery is a pattern implicated in psychobiological risk for depression (Ji et al., Reference Ji, Negriff, Kim and Susman2016; Lopez-Duran et al., Reference Lopez-Duran, McGinnis, Kuhlman, Geiss, Vargas and Mayer2015; Shull et al., Reference Shull, Mayer, McGinnis, Geiss, Vargas and Lopez-Duran2016; Zoccola & Dickerson, Reference Zoccola and Dickerson2012).
Performance goals also contributed to regulatory fit processes, lending insight about ways that specific coping skills work or backfire in supporting these children's HPA recovery. That children with performance goals displayed less protracted HPA recovery during avoidance relative to those in distraction helps shed light on why these children might willfully engage in avoidance, a strategy thought to ironically prolong the experience of stress rather than alleviate it. When ability comes under scrutiny, children with performance goals prefer to engage in avoidance because it sustains their goal to protect self-worth (Rothbaum et al., Reference Rothbaum, Morling and Rusk2009), but also because “feeling right” (Higgins, Reference Higgins2005) about doing so may support less protracted recovery (i.e., optimal regulatory fit). Indeed, avoidance-related rumination as a protective form of self-handicapping may support “feeling right,” insofar as it allows these children to defend their goal (i.e., rumination as egosyntonic) by building a “mountain of evidence” that justifies the cessation of approach-related effort (Nolen-Hoeksema et al., Reference Nolen-Hoeksema, Wisco and Lyubomirsky2008). That “feeling right” increases strength of engagement in an activity (Higgins, Reference Higgins2005) may also shed light on the apparent driven quality of avoidance for children seeking to protect self-worth (Rothbaum et al., Reference Rothbaum, Morling and Rusk2009).
Conversely, if “feeling wrong” stems from engaging in an activity in a manner that disrupts goal pursuits, then this might also explain why distraction for children with performance goals backfires and is associated with protracted physiologic recovery (i.e., poorer regulatory fit). That is, distraction for children with performance goals is perhaps at odds with goals to protect self-worth. As such, distraction as a means of coping may be egodystonic, invalidating of children's concerns about appearing incompetent and feeling worthless, and have greater perceived costs than benefits. Indeed, recent electroencephalography (EEG) evidence shows that, following competence frustration (e.g., doubting ability to perform well after a difficult task), those with performance goals display less pronounced reward positivity (RewP) to being provided a chance to restore competence and prove ability (Fang, Fu, Li, & Meng, Reference Fang, Fu, Li and Meng2019). Still further, evidence that effortful avoidance involves neural projections from amygdala to reward-processing brain regions (e.g., nucleus accumbens) suggests that effortful avoidance may have a certain appeal (LeDoux, Moscarello, Sears, & Campese, Reference LeDoux, Moscarello, Sears and Campese2017) for some individuals (i.e., performance goal oriented).
Prevention and intervention implications
If performance goals increase vulnerability to depression in children, then why have they been overlooked in the psychopathology literature? Research on children's performance goals has relied almost exclusively on self-report and behavioral observation methods, despite theoretical premise that physiologic arousal stemming from stressor-induced threats to self-worth plays a key role in this vulnerability (Dykman, Reference Dykman1998). Thus, lack of clinical attention to performance goals may stem from limited knowledge about benefits afforded (e.g., behavioral persistence) as well as costs assessed (i.e., physiologic dysregulation) by performance goals and developmentally sensitive individual differences therein at different levels of analysis.
Though effects were small and require replication, these findings point to the potential utility of incorporating performance goal orientation and perceived attachment security into school-based mental health screening and intervention efforts. Most school-age children experience academic and social stressors during their tenure as students, which, for some, leads to depressive problems (Bandura, Pastorelli, Barbaranelli, & Caprara, Reference Bandura, Pastorelli, Barbaranelli and Caprara1999; Orth, Robins, & Roberts, Reference Orth, Robins and Roberts2008). Additionally, many school-based prevention programs targeting risk for depression focus on the development and utilization of active coping skills and reduction of reliance on avoidance (Compas et al., Reference Compas, Connor-Smith, Saltzman, Thomsen and Wadsworth2001). However, as our findings suggest, active motivational factors may place limits on how effective active coping skills are in helping youth manage stress and may intrinsically reward the use of avoidance for distress alleviation. Thus, targeting motivational vulnerability factors (e.g., performance goals) may be a requisite component of maximally effective coping skill-based, in-school prevention and intervention efforts for youth at risk of depression. Performance goal vulnerability may be difficult to detect at the outset of the school year (i.e., prior to academic or interpersonal setbacks) via traditional teacher reports or child-level screeners that focus on symptoms, as negative self-beliefs (e.g., “I am dumb. No one likes me”) and related problems lie dormant until activated by acute stressors. Proper early identification may require assessing motivational factors as well as perceptions of the availability of care in the event that academic or interpersonal difficulties arise.
Furthermore, incorporating therapeutic elements known to lessen the cognitive tie between demonstrating competence and self-worth may also be promising (Rothbaum et al., Reference Rothbaum, Morling and Rusk2009). Interventions that promote learning goals (e.g., motivation to develop competence) may potentially offset performance-goal-based vulnerability by helping children come to know that taking risks and learning from mistakes helps develop ability. Teachers can promote learning goals by recognizing children's efforts during difficult, novel tasks (e.g., working on a new subject, making a new friend) versus acknowledging stale successes in well-versed domains. Similarly, interventions that foster malleable self-beliefs (e.g., ability can be developed) may mitigate against performance goal vulnerability by helping children to know that their abilities are ever changing and growing. Teachers can promote malleable beliefs by noticing and reflecting back to children the specific ways in which they are developing (e.g., language of becoming; Wachtel, Reference Wachtel2001). Still further, interventions that foster noncontingent self-worth (Cassidy & Shaver, Reference Cassidy and Shaver2008; Crocker & Park, Reference Crocker and Park2004) in school-based preventative programs hold promise to this end. Psychoeducation about performance goal susceptibility to depression and training in coping skills that loosen the tie between performance and self-worth may help buffer against potential depression emergence. Mindfulness-based skills such as self-acceptance (i.e., nonjudgment about immediate experience), self-compassion (i.e., kindness and caring towards the self in the face of stress), and self-affirmation (i.e., affirming core values) are known to help lessen concern about validating self-worth (Hayes, Strosahl, & Wilson, Reference Hayes, Strosahl and Wilson1999), mitigate the effects of failure on rumination (Koole, Smeets, van Knippenberg, & Dijksterhuis, Reference Koole, Smeets, Van Knippenberg and Dijksterhuis1999), as well as buffer neuroendocrine and physiologic stress responses associated with threats to self-worth (Creswell et al., Reference Creswell, Welch, Taylor, Sherman, Gruenewald and Mann2005). Furthermore, prevention efforts may seek to foster children's noncontingent self-worth by increasing caregivers’ and teachers’ acceptance of susceptible children's efforts in the face of failed attempts to manage novel academic and interpersonal stressors (Cassidy & Shaver, Reference Cassidy and Shaver2008; Crocker & Park, Reference Crocker and Park2004).
Limitations and future directions
There are limitations to the current study that point to directions for future research. First, our sample size was small for such a complex design. As such, our findings require replication in larger, more diverse samples. To this end, the results are limited to a community sample of predominantly White, nonurban children. While there was variability with respect to household annual income, research focusing on samples with greater variation in risk for depression are needed (e.g., poverty, Englund, Egeland, & Collins, Reference Englund, Egeland and Collins2008; family history of major depression; Abela et al., Reference Abela, Hankin, Haigh, Adams, Vinokuroff and Trayhern2005). Second, the assessment of attachment security was limited to maternal caregivers. Future research examining attachment with peers and teachers as buffers of performance-goal-based vulnerability is warranted. Indeed, children increasingly turn towards peers and teachers to fulfill attachment-related needs as they transition into adolescence (Nickerson & Nagle, Reference Nickerson and Nagle2005; Ryan, Stiller, & Lynch, Reference Ryan, Stiller and Lynch1994). Third, sample size limitations precluded an examination of patterns by gender. More research is needed to determine how performance-goal-based vulnerability may converge or differ across gender at multiple levels of analysis, given gender differences emerge in rates of psychopathology and in physiologic functioning as children age into adolescence (Doom & Gunnar, Reference Doom and Gunnar2013; Hankin, Mermelstein, & Roesch, Reference Hankin, Mermelstein and Roesch2007). Fourth, the current study did not assess children's cognitions in response to the TSST, limiting inference about whether behavioral persistence or physiologic arousal effects were due to decrements in perceived ability or negative thought emergence. Future studies incorporating self-report both prior to and immediately following TSST exposure would be well poised to test whether shifts in perceived ability in addition to shifts from vulnerable (e.g., “If I fail, then I am worthless”) to negative (e.g., “I am now worthless”) self-beliefs account for additional variance in behavioral persistence and physiologic responses. Fifth, we can only speculate that learning goals, malleable beliefs, or noncontingent self-worth mitigate against performance goal vulnerability and attachment-based individual differences therein. It is also possible that behavioral persistence and physiologic reactivity were buffered by such factors (e.g., learning orientation, focus on improvement). Research is needed to deduce whether each buffer against performance goal vulnerability and the levels of analysis at which this occurs. Sixth, data were collected at a single time point, precluding inference about directionality. Future research incorporating longitudinal designs are needed to elucidate whether performance goals are in fact a risk factor (Kraemer et al., Reference Kraemer, Kazdin, Offord, Kessler, Jensen and Kupfer1997) for depressive problems and whether HPA and SNS dysregulation function as a biological mechanism of this risk. Seventh, although our food and beverage restrictions covered items containing caffeine that a group of children this age might consume (e.g., chocolate, candy, soda with or without sugar, energy drinks), we did not ask participants to avoid caffeine specifically. Thus, it is possible that nonadherence or other caffeine consumption (e.g., unsweetened tea, black coffee) may have contributed to our findings. Eighth, individual level (e.g., intelligence, mental or physical health impairment) and day of experiment (e.g., exercise exertion, wake time) factors that were not assessed may have also impacted our findings. These limitations notwithstanding, the current study provides novel empirical evidence and nuanced detail on how performance goal orientation contributes to vulnerability to depression in preadolescents at multiple levels of analysis, with implications for early identification and prevention of the development of internalizing psychopathology.
Acknowledgements
This paper is dedicated to the memory of Dr. Fred Rothbaum. This work was supported by a Postdoctoral Fellowship from the National Institute of Mental Health, under Grant T32 MH015755 awarded to Dr. Dante Cicchetti, and by Grant R21 HD078753 awarded to Martha E. Wadsworth.