Introduction
Recent trends have witnessed attention toward the development of robust marine coatings with outstanding mechanical properties, excellent adhesion to the substrates, good drag resistance to hydrodynamic force, and barrier properties [Reference Díaz, Chico, De La Fuente, Simancas, Vega and Morcillo1, Reference Ammar, Ramesh, Vengadaesvaran, Ramesh and Arof2, Reference Petrie3]. With the ban of tributyltin (TBT)-based coatings by the International Maritime Organization (IMO) [Reference Chambers, Wharton, Wood, Walsh and Stokes4, Reference Esfandeh, Mirabedini, Pazokifard and Tari5], scientists and researchers have focused toward eco-friendly marine coatings. Among the various resins, polydimethylsiloxane (PDMS) has become one of the explored binder materials for the synthesis of antifouling marine coatings [Reference Zhou, Li, Luo, Chen, Zou, Liang and Li6]. The tremendous interests behind using PDMS are its excellent chemical stability, non-toxicity, outstanding flexibility, and lower surface energy [Reference Wang, Lv, Li and Zheng7, Reference Zhang, Liang, Zhong, Huang and Su8, Reference Longenberger, Ryan, Bender, Krumpfer and Krumpfer9]. However, the main limitation of PDMS is its poor-adhesion to substrate and lower mechanical properties, which limits its application in the field of functional marine coatings [Reference Zhou, Li, Luo, Chen, Zou, Liang and Li6]. This disadvantage can be overcome by functionalization of PDMS surface using plasma treatment [Reference Zhou, Li, Luo, Chen, Zou, Liang and Li6], polymers brush technique [Reference Sobhani, Jannesari and Bastani10], core–shell microsphere [Reference Roy, Iqbal, Kumar and Rajagopal11], and interpenetrating network (IPN) preparation [Reference Jia, Zhang, Du, Li and Li12]. Although the above reported methods have addressed few limitations of PDMS, they are not cost-effective. In contrast to the above techniques, blending of PDMS with epoxy (EP) resin can be a better approach for improving the mechanical properties and adhesion strength [Reference Nurioglu, Catarina, Esteves and de With13]. EP resins are widely known for their electrical insulation and mechanical and adhesive properties [Reference Sobhani, Jannesari and Bastani10, Reference Sung and Wu14]. Hence, the blending of both the components would render the developed coating system with outstanding thermal, mechanical, and abrasion properties; lower temperature flexibility; and oxidative stability [Reference Roy, Iqbal, Kumar and Rajagopal11, Reference Jia, Zhang, Du, Li and Li12, Reference Verma, Mohanty and Nayak15]. Various literature works have reported about the synthesis of PDMS-EP blends using different complex synthesis techniques [Reference Zhou, Li, Luo, Chen, Zou, Liang and Li6, Reference Roy, Iqbal, Kumar and Rajagopal11, Reference Kumar, Balakrishnan, Alagar and Denchev16, Reference Prolongo, Cabanelas and Baselga17]. However, the developed PDMS-EP blends exhibit incompatibility, phase separation, and irregular dispersion with heterogeneous and coarsely dispersed polymeric phases. As a consequence, the fabricated coatings show increased permeability, fast degradation, and poor mechanical properties, leading to delamination of coating from the metal substrate [Reference Markovic and Visakh18]. This limitation can be addressed by using silane-based compatibilizer, which is an economical approach for achieving compatibility and miscible PDMS-EP phases [Reference Esfandeh, Mirabedini, Pazokifard and Tari5, Reference Sobhani, Jannesari and Bastani10]. Among the various silane coupling agents used, (3-aminopropyl)triethoxysilane (APTES) provides common functionality to react with the reactive functional groups of both the polymers [Reference Kumar, Balakrishnan, Alagar and Denchev16, Reference Alagar, Thanikai Velan, Ashok Kumar and Mohan19].
In the present research, we aimed to synthesize epoxy–hydroxy-terminated polydimethylsiloxane (EP-hPD) blend systems using facile one-step methodology with the aid of silane-based coupling agent (APTES). The improvement in the reactive compatibility of both the polymers lead to the formation of inter cross-linked network structure of the blends. The motive of the current research is to generate tougher thermoset material simultaneously with improving the modulus of the designed systems to increase its lifespan and robustness of the coatings for high performance applications.
Results & discussion
Optimization of epoxy-PDMS (W/W) ratio
FTIR analysis
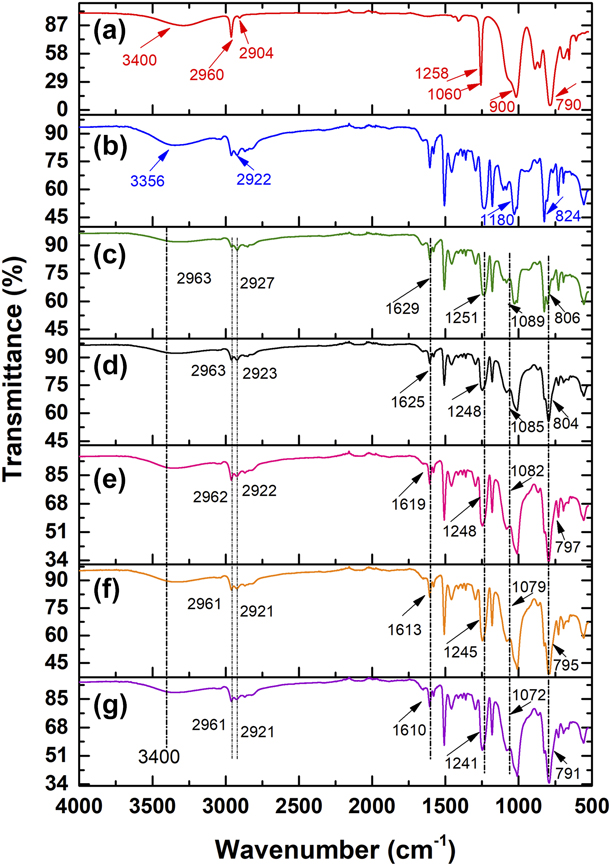
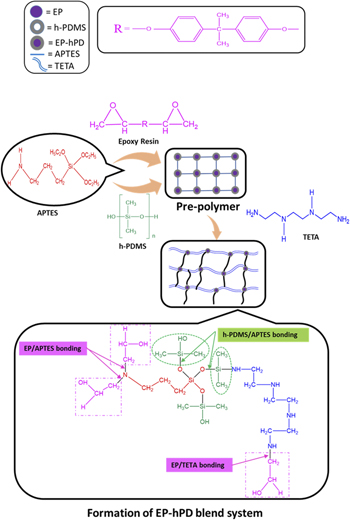
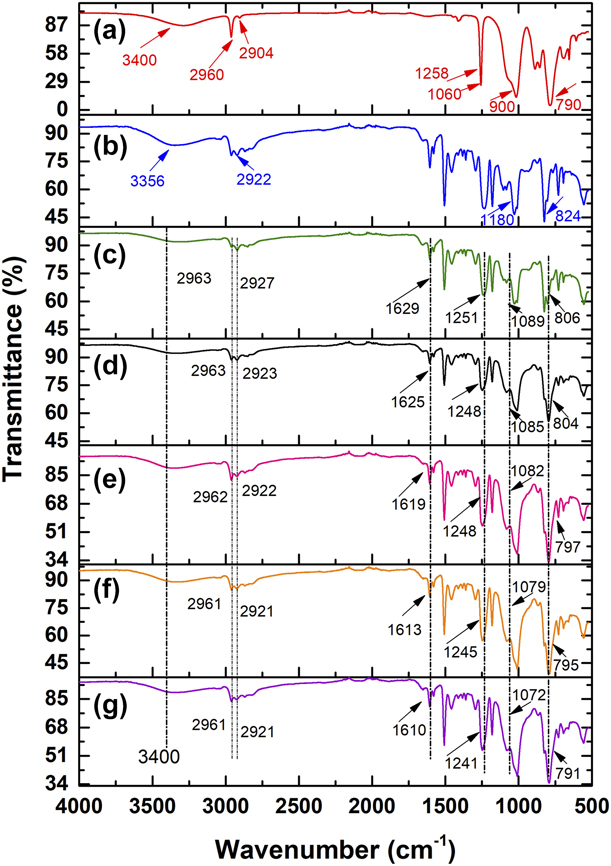
The Fourier transform infrared spectroscopy analysis (FTIR) spectra of h-PDMS, N-EP, and EP-hPD blend systems are presented in Fig. 1, it summarizes the chemical shifts of the above systems. The most important peaks for h-PDMS were located at 3400 cm−1 for –OH group, 2960 cm−1, and 2904 cm−1 for Si–CH3 stretching vibration, 1258 cm−1 for –CH3 deformations, 1060 cm−1 for asymmetric Si–O–Si stretching, 900 cm−1 for Si–O stretching in Si–OH, and 790 cm−1 for –CH3 rocking [Reference Huszank, Bonyár, Kámán and Furu20]. On the other hand, the characteristic peaks of EP resin are found at 3356 cm−1 for –OH stretching, 2922 cm−1 for –CH2, asymmetric stretching, 1180 cm−1 for C=O stretching, and 824 cm−1 for epoxy group [Reference Singh, Panda, Mohanty, Nayak and Gupta21, Reference Duraibabu, Ganeshbabu, Manjumeena, Ananda Kumar and Dasan22]. It can be observed from Fig. 1 that all the synthesized EP-hPD blend systems exhibit characteristic peaks within 2963–2961 cm−1 and 2927–2921 cm−1 for –CH2 asymmetric stretching in Si–(CH2)3 [Reference Ammar, Ramesh, Vengadaesvaran, Ramesh and Arof2], 1629–1610 cm−1 for –C=C–, 1251–1241 cm−1 for –CH3 deformation, 806–791 cm−1 for Si–CH3 absorption [Reference Sobhani, Jannesari and Bastani10]. The appearance of peak within the range of 1089–1072 cm−1 for all the EP-hPD blend systems confirms the successful condensation reaction between h-PDMS and –OH group of EP resin [Reference Sobhani, Jannesari and Bastani10]. The presence of peaks for –CH2 stretching, –CH3 deformation, and Si–CH3 absorption as discussed above for the EP-hPD blend system confirms the successful incorporation of h-PDMS into the EP resin [Reference Xu, Wang, Li, Wang, Xu and Deng23]. The diminishing intensity of –OH group peak at 3400 cm−1 for all the EP-hPD blends as compared to neat polymers (h-PDMS and N-EP) signifies that all the –OH groups are consumed during the reaction. The compatibilizer APTES reacts with h-PDMS via alkoxy group and with EP resin via amino group, thus providing sufficient chemical interactions between the polymer phases [Reference Zhou, Li, Luo, Chen, Zou, Liang and Li6] as shown in the reaction scheme in Fig. 2. First, the reaction occurs between oxirane ring of EP resin and amino group of APTES (indicated by EP-APTES bonding) in Fig. 2. Second, the reaction between h-PDMS and APTES is promoted by the elimination of alkoxy groups of APTES (indicated by h-PDMS-APTES bonding). Third, the amino group (–NH2) of TETA reacts with the silanol group (Si–O–H) of h-PDMS for cross-linking of the pre-polymer. The oxirane rings of EP resin open up on adding TETA and the hydrogen of primary amine from APTES react with the opened epoxy ring to facilitate the formation of chemically modified EP-hPD blend systems. Similar results were reported by other researchers [Reference Ammar, Ramesh, Vengadaesvaran, Ramesh and Arof2, Reference Sobhani, Jannesari and Bastani10, Reference Singh, Panda, Mohanty, Nayak and Gupta21, Reference Duraibabu, Ganeshbabu, Manjumeena, Ananda Kumar and Dasan22].
FTIR spectra of (a) h-PDMS, (b) N-EP, (c) EP-hPD/90-10, (d) EP-hPD/70-30, (e) EP-hPD/50-50, (f) EP-hPD/30-70, and (g) EP-hPD/10-90 blend systems.
Possible reaction scheme of the synthesized EP-hPD blend system.

Tensile test of N-EP and EP-hPD blend films
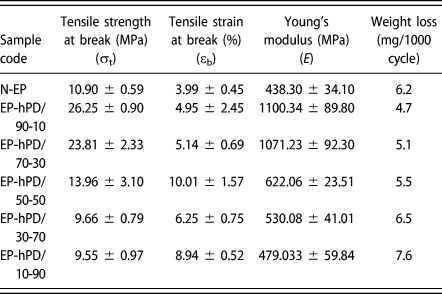
The mechanical properties of N-EP and EP-hPD blend systems, i.e., tensile strength (σt), percentage elongation (εb), and Young’s modulus (E) were investigated for determining the optimized EP-hPD composition. Table I summarizes the tensile test results of N-EP and EP-hPD blend systems along with their standard deviation. The stress–strain graphs of N-EP and EP-hPD blends have been shown in Fig. S1 (Supplementary material).
Mechanical properties of N-EP and EP-hPD blend films.

N.B.-Neat epoxy sample = N-EP, blend samples = EP-hPD-90/10, EP-hPD-70/30, EP-hPD-50/50, EP-hPD-30/70, and EP-hPD-10/90, wherein the number after hyphen denotes the wt% of EP:h-PDMS.
It can be observed from Table I that EP-hPD blend systems exhibit higher σt and E values as compared to the N-EP system. On incorporating 10 wt% and 30 wt% h-PDMS into EP resin, σt and E values increases to (140.8%, 151.05%) and (118.4%, 144.4%), respectively, as compared to the N-EP system. The lower σt and E exhibited by N-EP film is due to the confined molecular alignment of the stiff polymeric chains of EP-TETA network. The noted increase in the σt and E values of the EP-hPD blend system might be due to the presence of amino functionality in APTES that resulted in the effective chemical bonding between EP resin and h-PDMS chains as shown in Fig. 2 [Reference Sobhani, Jannesari and Bastani10]. A remarkable increase in σt and E values might also be attributed to the internal reinforcing effect exhibited by the modified blends, after blending h-PDMS with EP resin [Reference Zhou, Li, Luo, Chen, Zou, Liang and Li6]. As a consequence, higher amount of stress could be withstand by the rigid epoxy molecules. However, further increase in h-PDMS content beyond 30 wt%, resulted in lowering of σt and E values. For instance, EP-hPD/10-90 shows a substantial decrease in σt and E values by 59.8 and 50.5% as compared to the EP-hPD/70-30 system.
As observed from Table I, the synthesized EP-hPD blend systems show higher values of εb as compared to the N-EP system. For instance, the εb of EP-hPD/90-10 and EP-hPD/70-30 blends was higher by 24.0% and 28.8%, respectively, as compared to the N-EP system. This phenomenon was due to the presence of h-PDMS which introduced flexibility and elasticity to the blend system [Reference Sung and Wu14]. In addition, the h-PDMS chains facilitate easy rotation around bonds due to its curling and uncurling behavior [Reference Roy, Iqbal, Kumar and Rajagopal11]. Thus, the free rotation and rubbery nature of h-PDMS led to the increase in εb values of the blend systems.
In contrast to the current study, different findings depicting the influence of h-PDMS incorporation into EP matrix and SER (siliconized epoxy resin) inclusion into h-PDMS matrix have been reported by Sobhani et al. [Reference Sobhani, Jannesari and Bastani10] and Zhou et al. [Reference Zhou, Li, Luo, Chen, Zou, Liang and Li6], respectively. Sobhani et al. [Reference Sobhani, Jannesari and Bastani10] reported that the inclusion of 5 wt% and 10 wt% h-PDMS of different viscosities into EP resulted in a decrease in E and an abrupt increase in εb values as compared to neat EP. Zhou et al. [Reference Zhou, Li, Luo, Chen, Zou, Liang and Li6] reported an increase in E until 30% incorporation of SER (siliconized epoxy resin) within h-PDMS; also an increase in εb was observed until 40% SER content, which decreased further beyond 40% SER content in comparison to neat h-PDMS.
Among the various composition of EP-hPD blend systems, EP-hPD/90-10 and EP-hPD/70-30 exhibited higher σt, εb, and E values. Out of these two, EP-hPD/70-30 manifested higher εb and lower E value as compared to EP-hPD/90-10. Moreover, the reduction in coating modulus (E) can be an effective approach for minimizing the adhesion of foulants on the surface of the coating [Reference Halvey, Macdonald, Dhyani and Tuteja24]. Hence, EP-hPD/70-30 was considered to be the optimum composition for further studies. Further analysis was carried out to correlate with the above findings.
Taber abrasion resistance analysis of epoxy-PDMS blend coatings
The abrasion resistance of N-EP and EP-hPD blend coatings was measured in terms of weight loss per 1000 cycles and the results are summarized in Table I. In case of N-EP coating, a weight loss of 6.2 mg after 1000 cycles of abrasion was found due to the brittle nature of EP resin. As evident from Table I, the weight loss (mg/1000 cycles) of EP-hPD/90-10, EP-hPD/70-30, and EP-hPD/50-50 blend coatings was comparatively lower than that of N-EP coating except for EP-hPD/30-70 and EP-hPD/10-90 systems, which exhibited higher weight losses due to excess h-PDMS content that might have resulted in phase separation between both the polymeric phases. For instance, EP-hPD/90-10 and EP-hPD/70-30 blend coatings exhibited a weight loss of 4.7 mg and 5.1 mg, respectively, which was lower than that of N-EP by 24.1% and 17.7%, respectively. This phenomenon can be ascribed to the strong intermolecular interactions that exists between silanol group of h-PDMS and –OH group of EP resin, thereby enhancing the coating abrasion resistance [Reference Fu, Cui, Huang, Lu, Pan and Yu25]. Fu et al. [Reference Fu, Cui, Huang, Lu, Pan and Yu25] reported that the presence of rigid and polar groups such as benzene rings and hydroxyl groups can lead to the development of high cohesive forces that can participate in generating intermolecular hydrogen bonding. As a consequence, the free rotation of polymer chains is restricted, resulting in improved abrasion resistance. In addition, the presence of Si–O–Si inorganic backbone with inherent flexibility and low surface energy of PDMS promotes lubrication effect, thereby dissipating the mechanical energy during the shearing process [Reference Fu, Cui, Huang, Lu, Pan and Yu25]. Subsequently, the frictional wear and the erosion of surface coating decreases. On the other hand, the higher abrasion loss of EP-hPD coatings beyond 50 wt% of h-PDMS content might be due to the insufficient interactions and lower cross-linking between h-PDMS and EP resin [Reference Sobhani, Jannesari and Bastani10]. The abrasive force exerted by the rotating wheel on the coating surface might lead to the expansion and uncoiling of loosely bound h-PDMS chains from the surface, resulting in higher weight loss [Reference Arukalam, Oguzie and Li26].
Contact angle measurement of epoxy-PDMS blend coatings
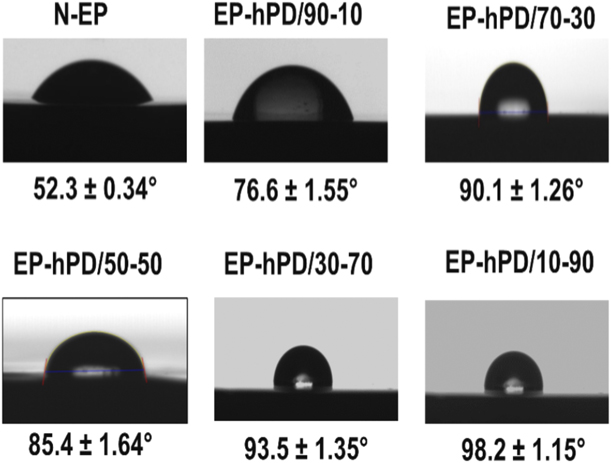
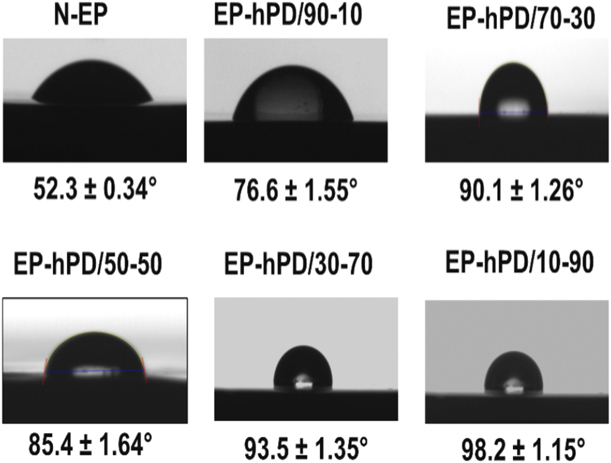
The static water contact angle (θ) of N-EP and EP-hPD blend coatings was used to investigate the hydrophobicity and the results are shown in Fig. 3. For N-EP coating, a contact angle of 52.3° was recorded, which was due to the presence of hydrophilic hydroxyl (–OH) and oxirane groups in EP resin [Reference Zhou, Li, Luo, Chen, Zou, Liang and Li6]. All the synthesized EP-hPD blend coatings demonstrated higher contact angle as compared to N-EP system due to the change in chemical composition. The contact angle of EP-hPD blend coatings increased with an increase in h-PDMS wt%. On blending h-PDMS with EP resin the surface energy and interfacial tension of EP-hPD coatings decrease due to the orientation of h-PDMS toward the surface, thereby increasing the hydrophobicity [Reference Zhou, Li, Luo, Chen, Zou, Liang and Li6, Reference Zhang, Pan, Luo, Chen, Kong and Zhou27]. Sobhani et al. [Reference Sobhani, Jannesari and Bastani10] reported that higher amount of h-PDMS can form thick layers on the coating surface, which increases the contact angle. Moreover, from marine application point of view, hydrophobicity is the main pre-requisite governing the antifouling property of the coating. The higher contact angle value manifested by EP-hPD/70-30 outweighs the performance of EP-hPD/90-10 system on grounds of improvement in hydrophobicity. Hence, EP-hPD/70-30 exhibits better performance than EP-hPD/90-10 composition.
Contact angle measurements of water droplets on the surface of N-EP and EP-hPD/blend coatings.
Thus, keeping in view all the results discussed above, EP-hPD/70-30 can be considered as the optimized composition for further comparative analysis with N-EP system.
Analytical results on optimized EP-hPD blend system compared with N-EP
Morphological analysis
SEM analysis of N-EP and EP-hPD blend films
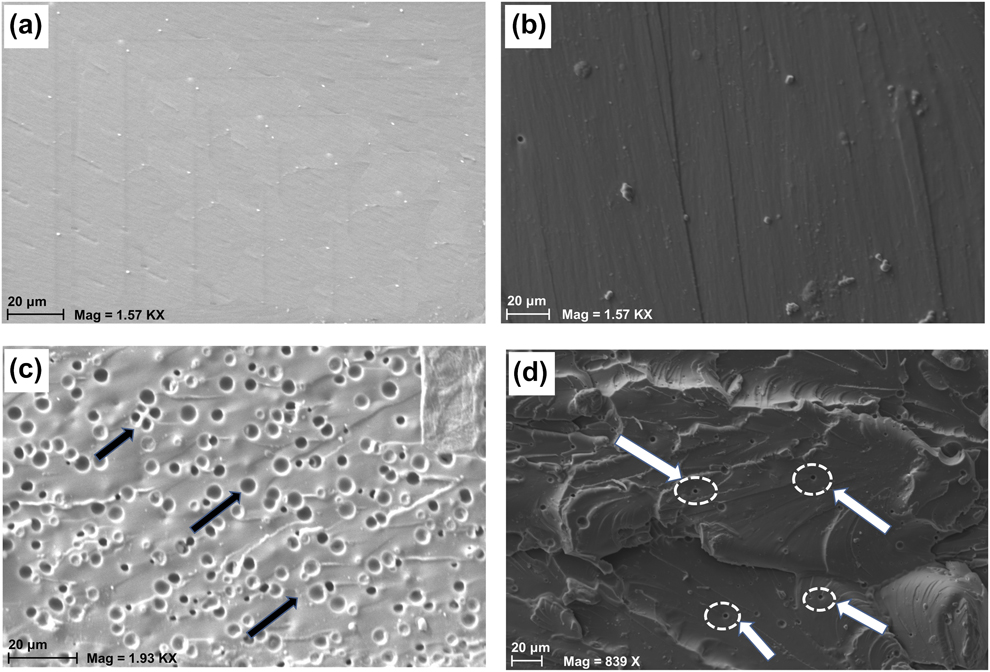
The surface morphology and cross sectional scanning electron microscopy (SEM) micrographs of fractured N-EP and optimized EP-hPD/70-30 blend films are shown in Fig. 4. SEM analysis was carried out to investigate the surface characteristics and the fracture morphology. The SEM image of N-EP film consisted of homogenous phase with smooth surface morphology owing to its hydrophilic nature as shown in Fig. 4(a). The above observation affirms with the contact angle results discussed in section “Contact angle measurement of epoxy-PDMS blend coatings”. The smooth surface morphology of N-EP with no plastic deformation also signifies its brittle nature [Reference Roy, Iqbal, Kumar and Rajagopal11]. On the other hand, EP-hPD/70-30 indicated heterogeneous morphology with an increase in surface roughness [Reference Ammar, Ramesh, Vengadaesvaran, Ramesh and Arof2]. Kumar et al. [Reference Kumar, Balakrishnan, Alagar and Denchev16] reported that the increase in surface roughness was due to the inter–cross-linking of EP resin with h-PDMS chains.
SEM surface images of (a) N-EP and (b) EP-hPD/70-30 films and corresponding fracture surfaces (c) and (d), respectively.

The fractured cross sectional micrographs of N-EP indicates homogeneous morphology with the appearance of large pores and cavities as shown in Fig. 4(c). It is evident from Fig. 4(d) that on blending h-PDMS with EP resin, the surface homogeneity increased, wherein the h-PDMS was well-dispersed within EP resin. The appearance of such a morphology could be an evidence of interphase reaction that occurs between EP resin and h-PDMS [Reference Zhang, Liang, Zhong, Huang and Su8]. The EP-hPD blend formed at the interphase resulted in dissolving both the phases and improved the compatibility of the blend system. Moreover, the surface homogeneity increased with the reduction in pore size (indicated by circle and arrows in Fig. 4(d)) without any cluster formation. The rubber elasticity of EP-hPD blend containing h-PDMS was responsible for the reduction in the pore size [Reference Singh, Panda, Mohanty, Nayak and Gupta21]. It can also be attributed to the incomplete pull off of h-PDMS chains from the EP matrix suggesting strong interactions between both the phases [Reference Romo-Uribe, Santiago-Santiago, Reyes-Mayer and Aguilar-Franco28].
Generally, in tensile fractured siloxane-modified EP systems stress-whitened region has been observed which indicates cavitation between the rubber particles and epoxy matrix, known as crazing as reported by Sung et al. [Reference Sung and Wu14]. In the present study, as evident from Fig. 4(d), the absence of stress-whitening texture confirms improved phase morphology and compatibility due to the incorporation of silane compatibilizer, i.e., APTES. Hence, the compatibility between both the polymers, as revealed through SEM analysis, resulted in the improvement of mechanical properties of EP-hPD blend films as discussed in section “Tensile test of N-EP and EP-hPD blend films”. As evident from the Fig. 4(d), the presence of wrinkles on the fractured surface of the EP-hPD/70-30 blend indicates absorption of more energy during tensile fracture by h-PDMS chains resulting in superior mechanical properties [Reference Zhou, Li, Luo, Chen, Zou, Liang and Li6].
AFM analysis of N-EP and EP-hPD blend films
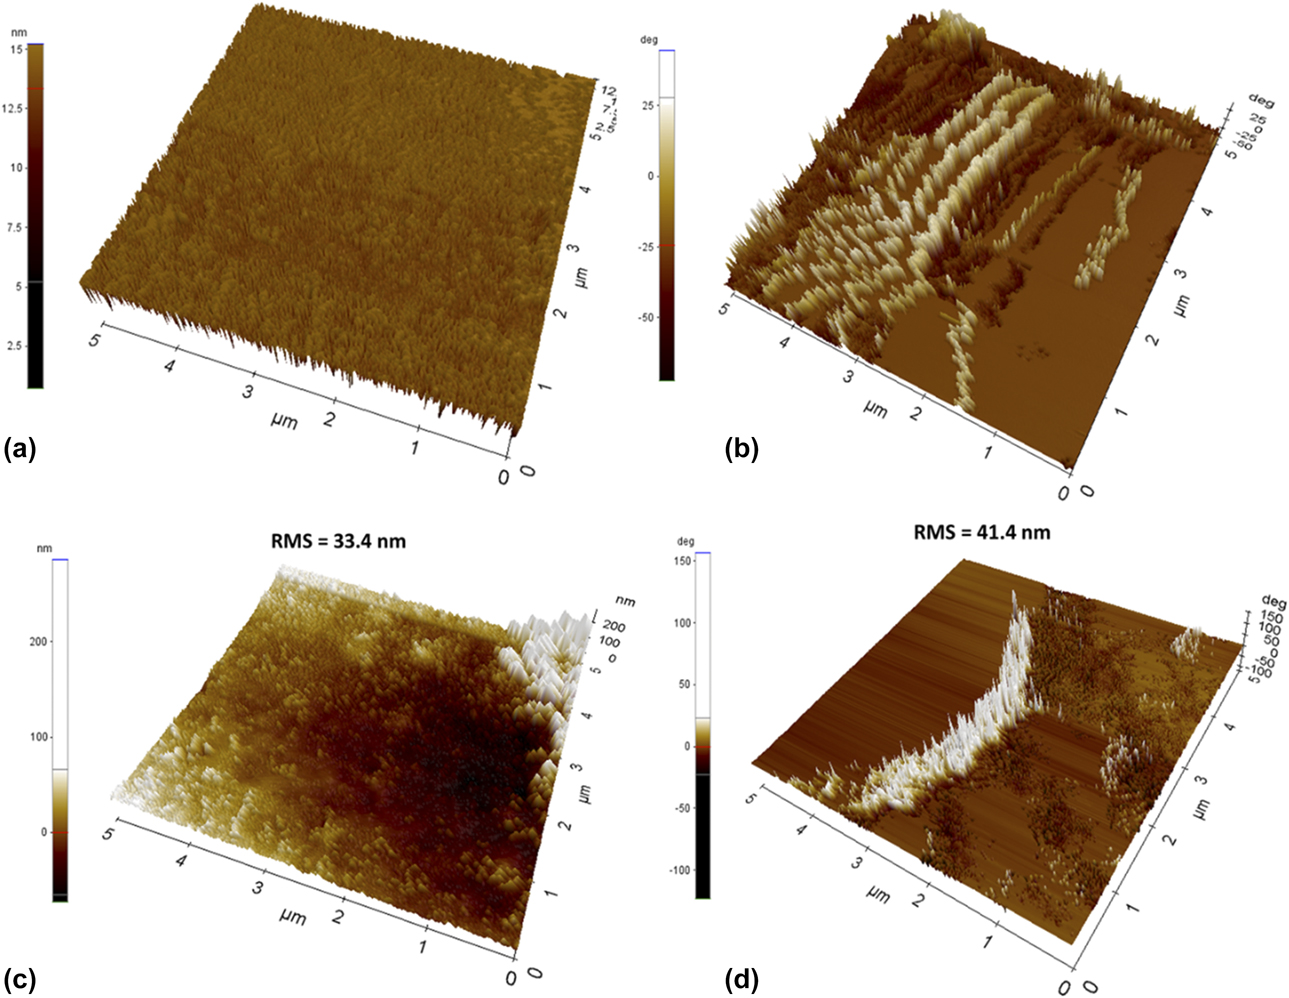
The three-dimensional (3D) phase and topographic images of N-EP and EP-hPD/70-30 blend films are depicted in Fig. 5. The topographic image of N-EP as shown in Fig. 5(a) is quite smooth and homogeneous. On the other hand, the topographic image of EP-hPD/70-30 is rough and heterogeneous, consisting of EP resin and h-PDMS. As evident from atomic force microscopy (AFM) topographic images Figs. 5(c) and 5(d), a major increase in the coating surface roughness was observed for EP-hPD/70-30 blend with an increase in the array of spikes at the surface as compared to N-EP system. The N-EP film exhibited root mean square (RMS) surface roughness of 33.4 nm, whereas EP-hPD/70-30 blend film showed an RMS value of 41.4 nm. The obtained AFM results confirms the findings of water contact angle, which suggests that roughness drives this phenomenon, i.e., the magnitude of surface roughness influences on the contact angle. The increase in surface roughness of EP-hPD/70-30 blend is due to the migration of h-PDMS on to the surface of the blend polymer coating [Reference Sobhani, Jannesari and Bastani10]. The methyl (–CH3) groups of h-PDMS tends to cover the surface like a blanket, wherein the air gets trapped and the surface becomes rough and potentially hydrophobic showing nonwetting characteristics [Reference Ammar, Ramesh, Vengadaesvaran, Ramesh and Arof2].
Three-dimensional AFM phase images of (a) N-EP and (b) EP-hPD/70-30 films and corresponding topographic surfaces of (c) and (d), respectively.

The 3D phase images of N-EP is quite smooth as compared to EP-hPD/70-30 blend. The 3D phase image of EP-hPD/70-30 provides good contrast due to the existence of two phases, i.e., lighter EP phase and darker h-PDMS phase [Reference Jia, Zhang, Du, Li and Li12]. The appearance of the two phases is due to the higher modulus difference between EP and h-PDMS phases, as found in tensile test results [Reference Jia, Zhang, Du, Li and Li12]. It can be observed that h-PDMS was evenly distributed within the EP resin suggesting strong intermolecular interaction between both the phases [Reference Jia, Zhang, Du, Li and Li12]. Moreover, the absence of any clear boundary between both the phases also confirms the successful formation of EP-hPD blend films. Similar morphological findings were reported by Jia et al. [Reference Jia, Zhang, Du, Li and Li12].
Thermal analysis of N-EP and EP-hPD blend films
DSC analysis of N-EP and EP-hPD blend films
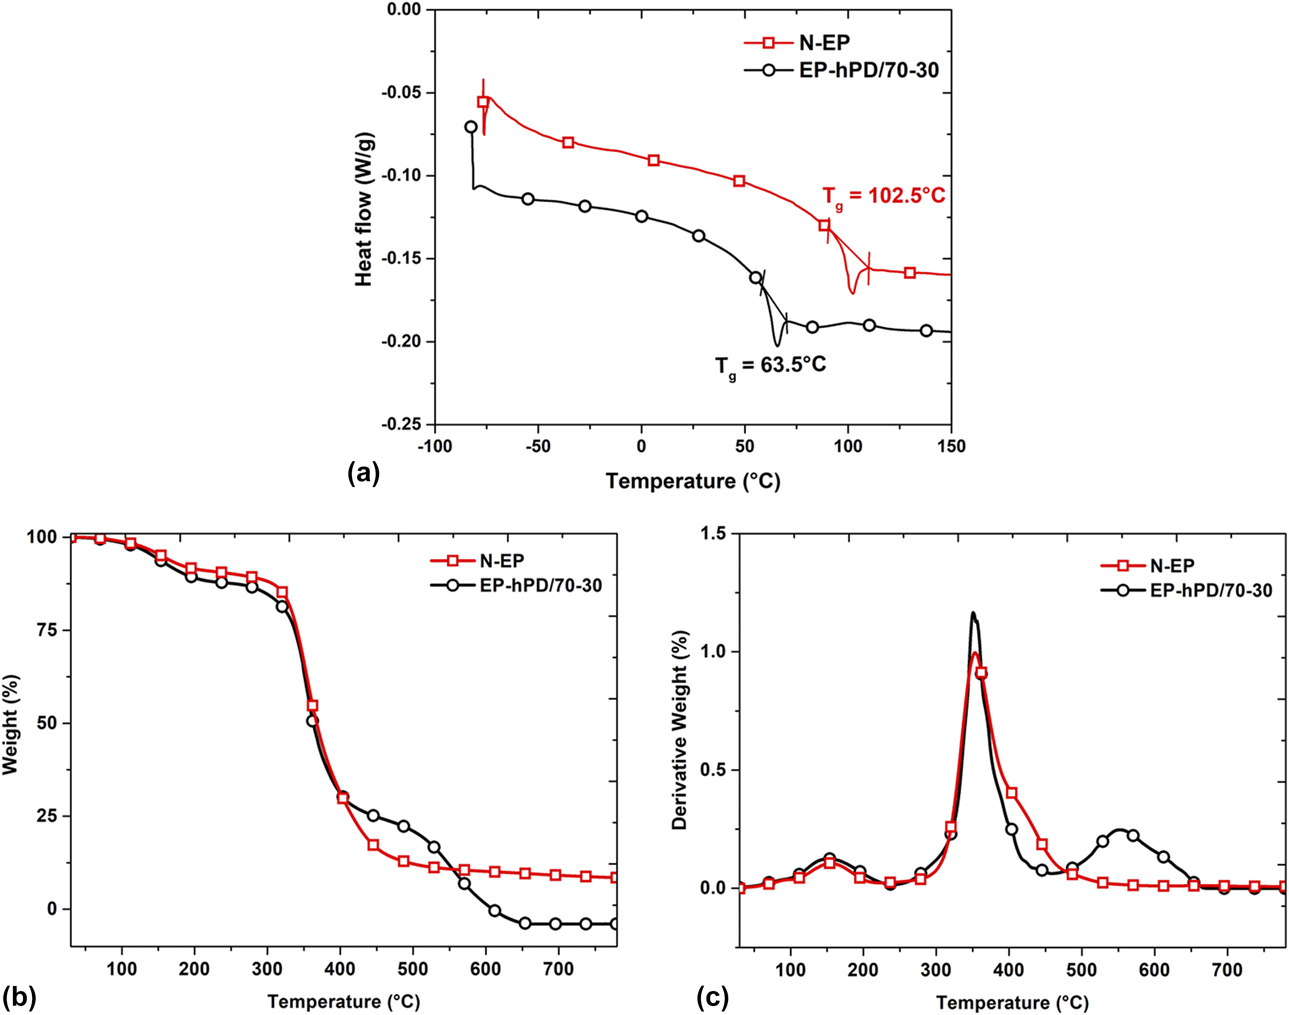
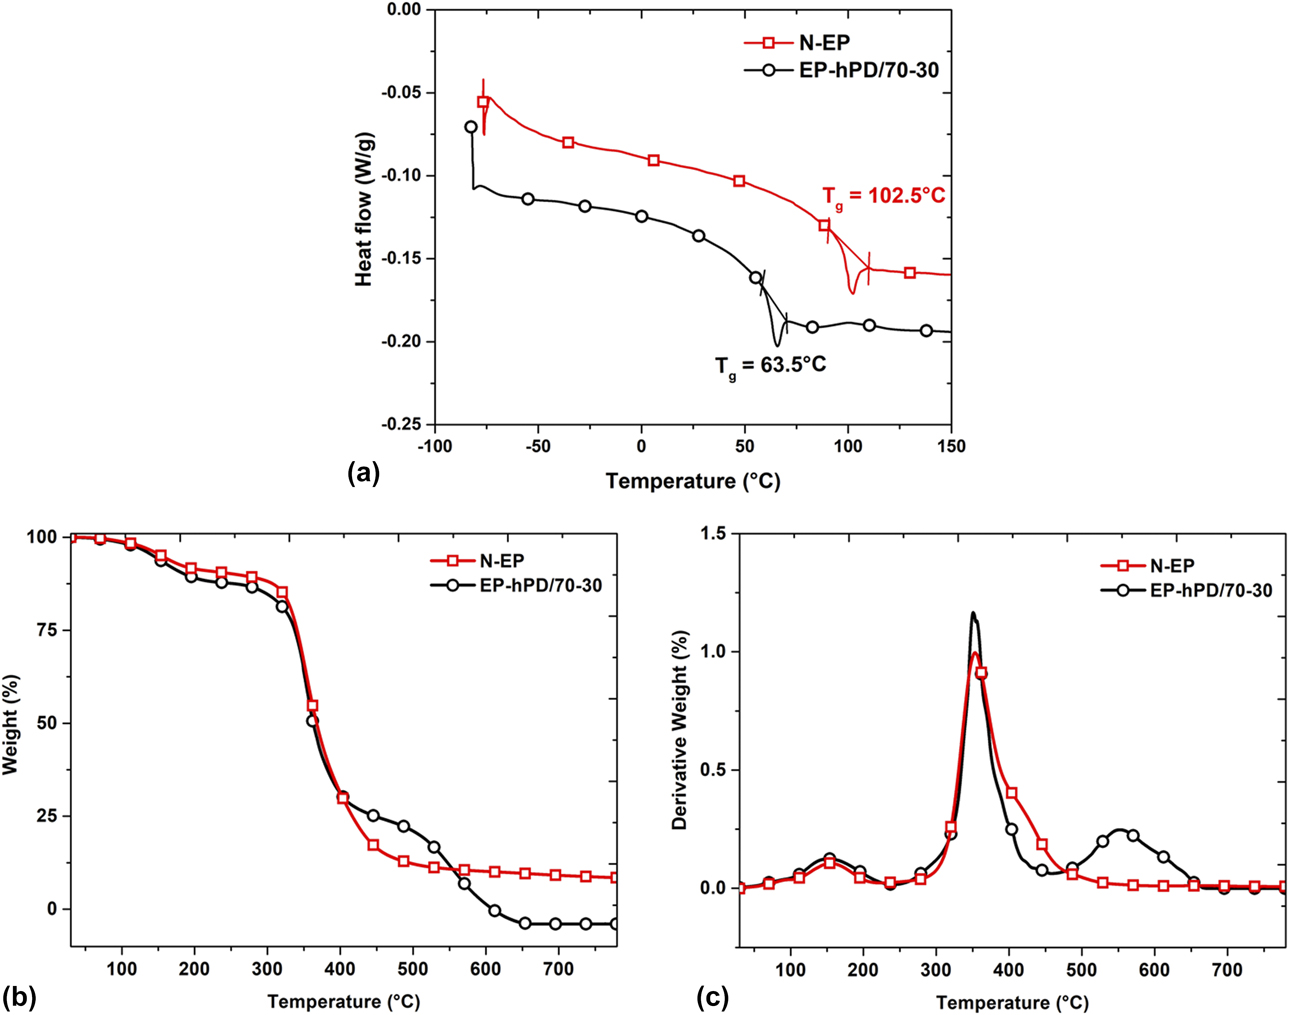
Differential scanning calorimetry (DSC) thermograms of N-EP and EP-hPD/70-30 blend films are depicted in Fig. 6 to determine the glass transition temperature (T g) and to study the influence of h-PDMS on the thermal transition of the blend system. The recorded curve of the blend indicates the appearance of single T g confirming the formation of inter cross-linked network structure [Reference Ammar, Ramesh, Vengadaesvaran, Ramesh and Arof2]. The T g of N-EP and EP-hPD/70-30 blend was 102.5 °C and 63.5 °C, respectively. Thus, it can be noted that the addition of h-PDMS into the EP resin resulted in decreasing the T g of the blend system. This phenomenon suggests the successful penetration of h-PDMS chains within EP resin. In addition, the decreasing trend of T g upon addition of h-PDMS indicates incomplete phase separation due to the plasticization phenomenon [Reference Ammar, Ramesh, Vengadaesvaran, Ramesh and Arof2, Reference Robeson29, Reference Ratna and Simon30]. Romo et al. [Reference Romo-Uribe, Santiago-Santiago, Reyes-Mayer and Aguilar-Franco28] reported that the oxirane functionality of EP resin promotes favorable covalent interaction with the h-PDMS interface resulting in lowering the T g value. The formation of these covalent interactions also favors the improvement in tensile test results as observed in section “Tensile test of N-EP and EP-hPD blend films”. Similar results were obtained by other researchers [Reference Ammar, Ramesh, Vengadaesvaran, Ramesh and Arof2, Reference Ananda Kumar and Sankara Narayanan31].
(a) DSC, (b) TGA, and (c) DTG thermograms of N-EP and EP-hPD/70-30 films.
TGA of N-EP and EP-hPD blend films
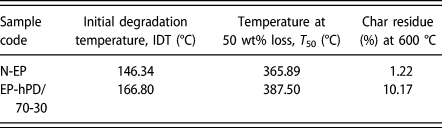
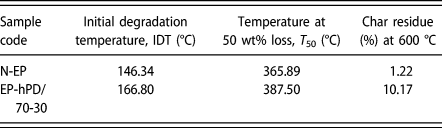
The thermogravimetric analysis (TGA) and DTG curves of N-EP and EP-hPD/70-30 blend films have been depicted in Fig. 6. The initial degradation temperature (IDT) that corresponds to weight loss of 5% was determined from the TGA curve to evaluate the thermal stability of the developed systems. Also, the temperature corresponding to weight loss of 50% and char residue at 600 °C was determined and the results are depicted in Table II. The IDT for N-EP and EP-hPD/70-30 was recorded at 146.3 °C and 166.8 °C, respectively. The higher IDT observed for EP-hPD/70-30 was due to the presence of (Si–O–Si) linkage in h-PDMS structure that resulted in improving the thermal stability. In addition, the partial ionic nature of Si–O bond might be another plausible factor behind the improved thermal stability of the blend system [Reference Ammar, Ramesh, Vengadaesvaran, Ramesh and Arof2]. Similar trend was observed for T 50%. As evident from the DTG curve, the thermal degradation of N-EP occurs in three stages, wherein the first stage observed at 152.1 °C corresponds to the elimination of H2O resulting in the production of unsaturated C–C bonds [Reference Ammar, Ramesh, Vengadaesvaran, Ramesh and Arof2]. The second stage observed at 350.9 °C corresponds to the fragmentation and complete volatilization of epoxy network including C-phenyl bonds of bisphenol-A [Reference Ammar, Ramesh, Vengadaesvaran, Ramesh and Arof2, Reference Camino, Tartaglione, Frache, Manferti and Costa32]. The third step observed at 415.4 °C corresponds to the degradation of smaller fragments of epoxy resin main chain [Reference Ammar, Ramesh, Vengadaesvaran, Ramesh and Arof2]. On the other hand, the thermal degradation of EP-hPD/70-30 also occurs in three stages, wherein the first stage of degradation at 162.3 °C corresponds to the degradation of epoxy resin [Reference Roy, Iqbal, Kumar and Rajagopal11]. The second stage observed at 358.6 °C corresponds to the depolymerization of hydroxyl groups of h-PDMS chains resulting in the production of cyclic trimer and higher cyclomers. The third stage of degradation noted at 558.4 °C corresponds to the decomposition of core PDMS silicone [Reference Roy, Iqbal, Kumar and Rajagopal11]. The char residue observed for N-EP and EP-hPD/70-30 at 600 °C was found to be 1.22% and 10.17%, respectively. The higher char residue observed for EP-hPD/70-30 indicates its higher thermal stability due to the higher bond dissociation energy of Si–O bond [Reference Ammar, Ramesh, Vengadaesvaran, Ramesh and Arof2]. Moreover, the dense residual layer of Si–O–Si restricts the penetration of heat into the matrix resulting in higher thermal stability [Reference Zhou, Li, Luo, Chen, Zou, Liang and Li6].
Details regarding thermal stability parameters of N-EP and EP-hPD/70-30 films.
Chemical resistance evaluation of N-EP and EP-hPD blend films
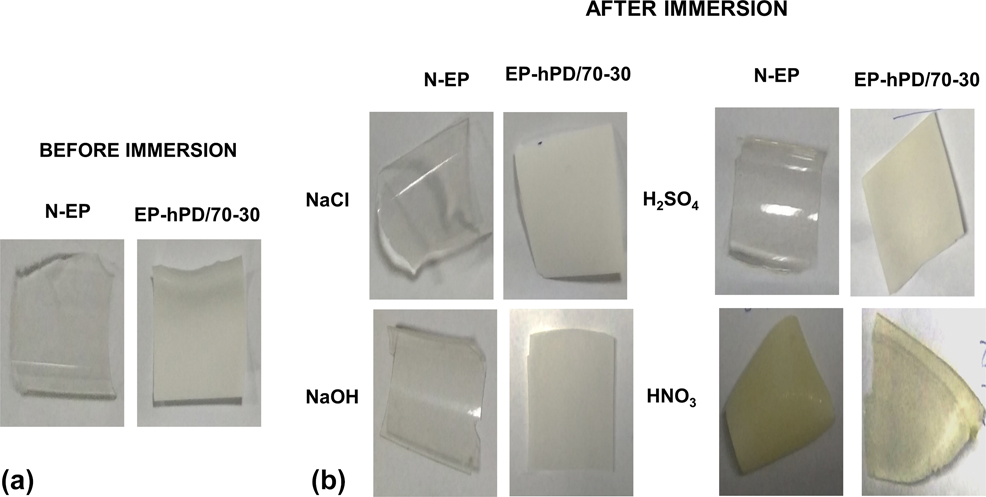
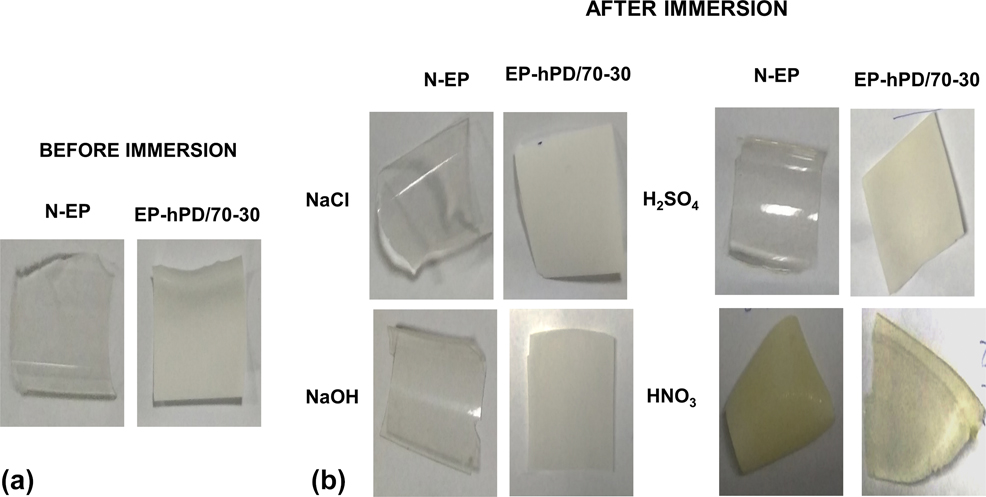
The chemical resistance of N-EP and EP-hPD/70-30 blend films were examined against 10 wt% NaCl, 10 wt% NaOH, 10 wt% H2SO4, and 10 wt% HNO3 aqueous solutions for 15 days. Upon completion of the tests, the film samples were removed from the chemical media and allowed to dry for visual inspection. This test result will provide better insight regarding the applicability of EP-hPD coatings for corrosive marine environments. Figure 7(b) depicts the images of N-EP and EP-hPD/70-30 films subjected to different chemical media. The lower chemical resistance observed for the N-EP system as compared to the EP-hPD/70-30 blend is attributed to its porous characteristic as discussed in section “SEM analysis of N-EP and EP-hPD blend films”. It is evident that there were no appreciable traces of swelling and embrittlement for EP-hPD/70-30 blend films after 15 days of exposure to chemical media. The strong alkali resistance exhibited by the EP-hPD/70-30 blend film is attributed to the presence of silanol bonds of h-PDMS, which prevents material aging and inhibits the penetration of alkali [Reference Ma, He, Jia, Zhao, Zuo and Hu33, Reference Barati Darband, Aliofkhazraei, Khorsand, Sokhanvar and Kaboli34, Reference Hsissou, Benzidia, Hajjaji and Elharfi35]. The excellent acid resistance exhibited by the EP-hPD/70-30 blend is attributed to the interpenetrating transition layers between the EP phase and the h-PDMS domains resisting the penetration of dissolved ions into the coating layers [Reference Liu, Qi, Shen and Li36]. However, the textural changes in HNO3 samples are attributed to the decomposition of nitric acid into nitrogen oxide and water, which leads to discoloration of the polymer film samples to slightly yellow being less prominent in case of EP-hPD/70-30 blend film.
Digital images of film samples (a) before immersion and (b) after immersion in different chemical media.
Adhesion strength analysis of N-EP and EP-hPD blend coatings
The pull off adhesion strength was evaluated to determine the adhesion strength of the N-EP and EP-hPD/70-30 blend coating. The layout of test methodology as per ASTM D 4541 has been illustrated in Fig. S3(a) in Supplementary material. The substrate is denoted by layer ‘A’, followed by primer layer ‘B’ and synthesized topcoat layer ‘C’, i.e., composed of either N-EP or EP-hPD/70-30 blend. The layer ‘Y’ indicates the glue that is used to fix the dolly to the coating surface. The dolly is represented as “Fixture-Z”. Figures S3(b) and S3(c) shows the images of N-EP and EP-hPD/70-30 blend coating taken after the pull off adhesion test along with the adhesion strength values reported in MPa. It can observed that the N-EP coating demonstrated cohesive failure with an adhesion strength value of 0.96 MPa, due to the poor mechanical properties of epoxy resin as discussed in the tensile test results. On the other hand, the EP-hPD/70-30 blend coating displayed adhesive failure with an adhesion strength of 1.32 MPa which is 37.5% higher than that of N-EP coating. The results obtained were comparable to that reported by Esfandeh et al. [Reference Esfandeh, Mirabedini, Pazokifard and Tari5]. It can be attributed to the increase in the stiffness of the blend as confirmed by the higher E value, which leads to the increment in stress capacity and diminishes local detachment between the coating and the substrate [Reference Bartlett, Croll, King, Paret, Irschick and Crosby37, Reference He, Cheng, Tang, Chen, Li, Gu and Zhao38]. Similar to fiber–matrix composites, the adhesion proceeds by transferring load from stiffer matrix phase of EP resin to soft polymeric phase of h-PDMS reinforcement, with the aid of adhesion promoter 3-aminopropyltriethoxysilane (APTES) [Reference Kohl, Malicky and Jones39]. Moreover, the presence of APTES with dual-functional groups enables chemical bonding between the h-PDMS and EP resin facilitating higher adhesion strength [Reference Esfandeh, Mirabedini, Pazokifard and Tari5].
Field immersion study of N-EP and EP-hPD blend coatings
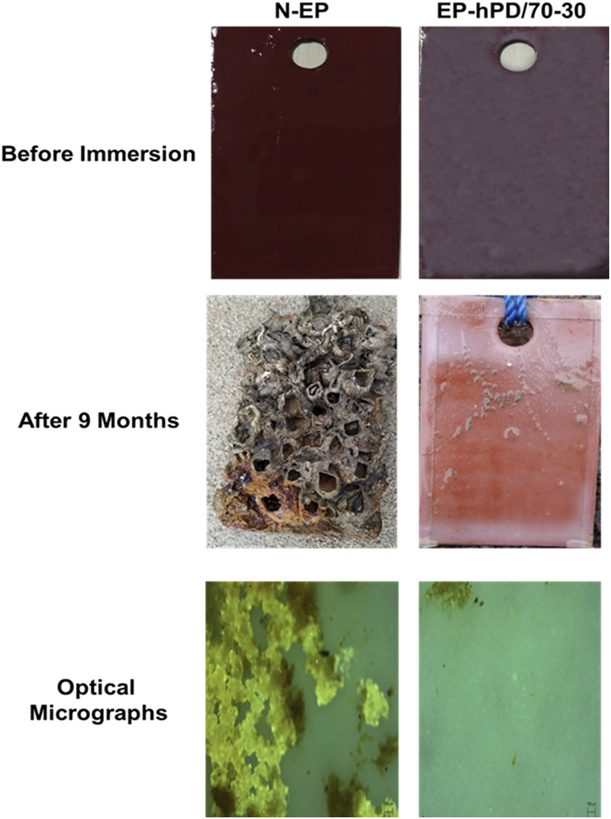
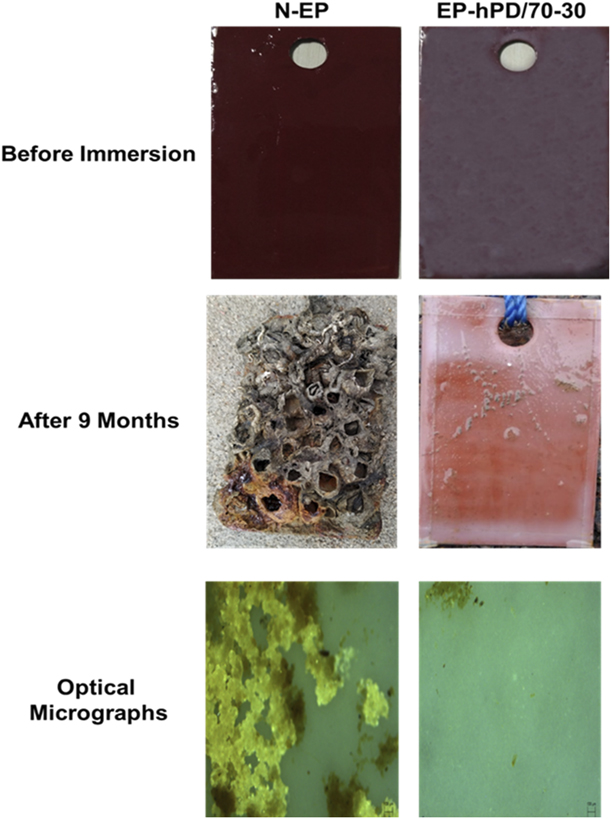
The field immersion study of N-EP and EP-hPD/70-30 blend coatings was carried out for 9 months in marine water to investigate the antifouling properties and the obtained digital images are reported in Fig. 8. It can be observed that the density of barnacles grown on the surface of the N-EP coating was prominent as compared to EP-hPD/70-30 blend coating. The surface of N-EP panel was covered with a vast growth of fouling organisms which includes oysters, bryozoans, tunicates, barnacles, and slime layer [Reference Saravanan, Jayamoorthy and Ananda Kumar40]. The intense fouling observed on N-EP coating was due to the porous nature of EP resin as shown in the SEM micrograph in Fig. 4(c), which promotes permeation and easy adherence of the fouling microbes onto its surface. On the other hand, EP-hPD/70-30 blend coating indicated reduced accumulation of fouling species on its surface up to 9 months. This phenomenon can be attributed to the excellent foul resistance imparted by h-PDMS domains. The inherent foul-resistant nature of h-PDMS is ascribed to the reduction in the friction of the coating by providing coating flexibility [Reference Li, Cai, Long, Zhu, Dong, Zhu, Zhao and Xu41]. Moreover, the lowest surface energy of h-PDMS inhibits the adherence of microbes on the surface of EP-hPD/70-30 coating [Reference Zhang, Pan, Luo, Chen, Kong and Zhou27]. In addition, the presence of silane functionality from APTES reduces the settlement of macro organisms on the surface of EP-hPD/70-30 coating [Reference Saravanan, Jayamoorthy and Ananda Kumar40]. Similar findings were reported by other researchers [Reference Zhang, Pan, Luo, Chen, Kong and Zhou27, Reference Saravanan, Jayamoorthy and Ananda Kumar40, Reference Gomathi Sankar, Sathya, Sriyutha Murthy, Das, Pandiyan, Venugopalan and Doble42]. The optical microscopy technique was used to provide an insight regarding the growth of microbial colonies on the surface of film samples as well. It implies with the above findings indicating dense growth of algal colonies on the surface of N-EP film as compared to EP-hPD/70-30 film. The clustering of these algal colonies on the surface of N-EP film accelerated its intense fouling.
Images of field immersion test and optical micrographs of N-EP and EP-hPD/70-30 before and after immersion.
Conclusions
(1) EP-hPD coatings were successfully synthesized by blending different wt% of h-PDMS with EP resin.
(2) It was found that 30 wt% incorporation of h-PDMS exhibited optimum performance characteristics in terms of mechanical strength, thermal stability, and improved hydrophobicity entitling them for protective coating applications in paint and allied industries.
(3) An appreciable increase was observed in modulus of elasticity of EP-hPD/70-30 film which was found to be 1071 MPa, around 2.5 times higher as compared to that of N-EP. The pull off adhesion strength of 1.32 MPa was observed for EP-hPD/70-30 coating revealing an increment of 37.5% in comparison to N-EP.
(4) The contact angle results revealed that the porous hydrophilic surface of N-EP coating converts to hydrophobic one, with contact values rising from 52.3° to 90.1° as compared to EP-hPD/70-30 coating.
(5) The higher abrasion resistance coating so developed based on EP-hPD blend with added advantage of antifouling characteristics can have novel applications in various protective coating systems such as mild steel panels for ship hulls where wear and tear happens with time.
Thus, from the above findings, it can be concluded that the synthesis technique adapted for EP-hPD blends can be an exceptional approach to develop EP-PDMS nanocomposite coatings for further improvement in physicochemical properties of the blend coatings in the near future.
Experimental
Materials
DGEBA epoxy (EP) resin, i.e., Araldite grade (GY-251) with epoxy equivalent value ranging from 180 to 189 g/eq along with hardener triethylenetetramine (TETA) of Aradur grade (HY-951) with an amine value 24.04 g/eq was purchased from M/s. Huntsman Int Pvt., Ltd., Mumbai, India. PDMS–hydroxy-terminated (h-PDMS) with a dynamic viscosity of 25 centistokes and a density 0.95 g/mL at 25 °C and 3-aminopropyltriethoxysilane (APTES) with a density 0.946 g/mL at 25 °C were procured from M/s. Sigma-Aldrich Pvt., Ltd., Bangalore, India. Toluene used was supplied by M/s. Fisher Scientific Int. Pvt., Ltd., Mumbai, India. Dibutyltin dilaurate (DBDTL), used as catalyst, was procured from M/s. TCI Chemicals Pvt., Ltd., Mumbai, India. Red oxide primer was procured from M/s. Asian Paints Pvt., Ltd., Mumbai, India.
Methodology
Fabrication of neat epoxy (N-EP) and epoxy–h-PDMS (EP-hPD) blend films and coatings
Preparation of N-EP was carried out as follows. Epoxy (EP) resin was degassed in a hot air oven for 10–15 min at 70 °C for removal of air bubbles and for reducing its viscosity. Toluene was added to the degassed resin and stirred at a speed of 600 rpm for 20 min. Then, TETA was added to the solution in ratio of EP:TETA as 100:13.2 for curing N-EP pre-polymer. For fabricating EP-hPD blend systems, APTES was added dropwise to the N-EP–toulene solution under vigorous stirring. Thereafter, h-PDMS was added to the mixture and heated at 55 °C to synthesize the pre-polymer. It should be noted that the molar ratio of h-PDMS:APTES was maintained at 3:1 throughout the composition. Then the mixture was sonicated in an ultrasonic bath for 60 min. For curing the EP-hPD pre-polymer, TETA was added in a ratio of 100:13.2 (i.e., EP:TETA) followed by addition of two drops of DBDTL catalyst. The mixture was then stirred at 850 rpm for 5 min. Thereafter, the mixture was kept for pot gelation and cast over acrylic sheets for fabricating EP-hPD blend films. On the other hand for coating studies, the synthesized EP-hPD solution was coated onto surface-treated cold rolled carbon (CRC) steel substrates by draw-down method as per ASTM D4062. The EP-hPD blend films and coatings were formulated by incorporating 10 to 90 wt% of h-PDMS within the EP resin matrix as shown in Table SI (Supplementary material). The synthesized blend films and coatings were identified as follows: neat epoxy as N-EP, EP-hPD-90/10, EP-hPD-70/30, EP-hPD-50/50, EP-hPD-30/70, and EP-hPD-10/90, wherein the number after EP-hPD denotes the wt% of EP:h-PDMS added in the compositions. The synthesized blend films and coatings were moisture cured at room temperature for 15 h and then placed in vacuum oven at 80 °C for 2 h to allow adequate postcuring. After postcuring, films of 200–250-μm thickness and coatings of dry film thickness (DFT) 100–120 μm were obtained. The step-by-step procedure used for the development of coatings has been depicted in Fig. S2 (Supplementary material).
Substrate preparation for coating
The CRC steel sheet of 1-mm thickness was procured from M/s. Bokaro Steel plant, Jharkhand, India, with elemental composition of C-0.12%, Mn-0.50%, S-0.040%, P-0.040%, and Fe-99.3%. The sheets were sectioned to the required dimensions, i.e., for field immersion test (80 × 50 × 1 mm) and for abrasion and pull off adhesion test (100 × 100 × 1 mm), using wire cut electrical discharge machining (EDM) to obtain rectangular and square CRC steel panels for the study. After completion of cutting and drilling, the substrates were subjected to sand blasting to obtain the suitable perforations at the substrate surface as shown in Fig. S2 (Supplementary material). The standard abrasive surface of profile  $\left( {{\rm{SA}}\;2{1 \over 2}} \right)$ was obtained with white metal finish as per ISO 8501-1 [Reference Momber and Greverath43,Reference Sakami44]. The sand blasting services were provided by M/s. Essar Steels, Kolkata, India. The sand blasted panels were preserved in vacuum desiccator for preconditioning [Reference Duraibabu, Ganeshbabu, Manjumeena, Ananda Kumar and Dasan22] and the surface finish was maintained until primer coating was applied.
Characterization techniques
Characterization of N-EP and EP-hPD blend films
FTIR
The FTIR spectra of N-EP and EP-hPD blend films were recorded on (M/s. Nicolet 6700, Thermo Scientific, Waltham, Massachusetts) with OMNIC software, within the wavelength range of 4000–400 cm−1.
Mechanical properties
The tensile properties of N-EP and EP-hPD blend films with dimensions (100 × 25 mm) were measured using UTM (M/s. Instron, 3382, Buckinghamshire, U.K.) according to ASTM D882. A load of 1 kN with a crosshead speed of 5 mm/min was utilized to determine the mechanical properties.
Morphological characterization of N-EP and EP-hPD blend films
SEM
The surface and cross sectional morphology of tensile fractured N-EP and EP-hPD blend films was acquired using microscope (M/s. EVO MA 15, Carl Zeiss, Munich, Germany) at an accelerating voltage of 15 kV.
AFM
The three-dimensional (3D) phase morphology and topographical information of N-EP and EP-hPD blend films was acquired using AFM (M/s. Park Scientific Instrument, XE-100, Santa Clara, California). The test was performed in noncontact mode using a SiN cantilever. The RMS roughness of the samples was also examined using the above technique.
Thermal characterization of N-EP and EP-hPD blend films
DSC
The glass transition temperature (T g) of N-EP and EP-hPD blend films was detected by DSC calorimeter (Q 20, M/s. TA Instruments, New Castle, Delaware). About 5–10 mg of samples were heated from −70 to 150 °C, at a heating rate of 2 °C/min, under N2 atmosphere.
TGA
The thermal stability of N-EP and EP-hPD blend films was analyzed using TGA (Q 50, M/s. TA Instrument) under dry N2 atmosphere with a flow rate of 60 mL/min. The samples with mass between (5–10 mg) were heated at a heating rate of 10 °C/min from 25 to 800 °C, for recording the consecutive mass loss of the samples. The TGA and DTG curves obtained have been reported.
Chemical resistance evaluation of N-EP and EP-hPD blend films
The exposure of siloxane blend and composites to alkaline environment is severely harmful and corrosive which can lead to reduced performance of the coatings [Reference Su, Liu, Zhang, Wang, Li and He45]. Thus, to investigate the sustainability of N-EP and EP-hPD blend films against corrosive environment, chemical resistance analysis was examined in presence of different chemical media as per ASTM D 543-95. The film samples were exposed to 10 wt% aqueous solution of sodium chloride (NaCl), 10 wt% sodium hydroxide (NaOH), 10 wt% sulfuric acid (H2SO4), and 10 wt% nitric acid (HNO3) solution for 15 days. The chemical media containing samples were stirred regularly. The weight of the immersed samples was monitored consistently, and the percentage of chemical absorbed (% A gain) was reported using Eq. (1).
 $$\% {A_{{\rm{gain}}}} = {{{A_{\rm{f}}} - {A_{\rm{i}}}} \over {{A_{\rm{i}}}}} \times 100\quad ,$$
where, A i denotes the weight of the specimen before immersion and A f denotes the weight of specimen after immersion. A visual inspection for any evidence of discoloration, swelling, tackiness, and solubility was also carried out, and the subsequent change in the sample appearance has also been reported.
Characterization of N-EP and EP-hPD blend coatings
Contact angle measurement
The water contact angle (θ) of N-EP and EP-hPD blend coatings was recorded using a goniometer (M/s. SEO 300- Phoenix, Hein Long Technology Corp., Ho Chi Minh City, Vietnam) via sessile-drop technique. Distilled water droplet (5 µL) was dispensed from a syringe at five different locations for each sample. The average value of θ along with the standard deviation obtained from five readings has been reported.
Pull off adhesion strength measurement
The pull off adhesion strength of N-EP and EP-hPD blend coatings was determined using portable adhesion tester (M/s. AT 12983 PosiTest, DeFelsko, Ogdensburg, New York) as per ASTM D 4541-09 and Fig. S3(a) in Supplementary material shows the layout of the test methodology. The testing surface was polished using a 320 grit emery sheet to fix a dolly of 10-mm diameter using epoxy glue. Thereafter, a progressive load was applied to pull off the dolly from the coating surface until failure occurred. The results were expressed in terms of type of the failure (i.e., cohesive/adhesive) and adhesion strength was expressed in MPa after taking an average of five readings.
Taber abrasion resistance measurement
The abrasion resistance of N-EP and EP-hPD blend coatings was determined using abrasion tester (5131-M/s. Taber Industries, North Tonawanda, New York) in terms of weight loss as per ASTM D 4060. The dual layer–coated specimens with dimension (100 × 100 mm) were subjected to a load of 1 kg using CS-10 abrasive wheels rotating at both the ends. The weight loss was calculated up to 1000 cycles by taking the average of every 200 cycles [Reference Pradhan, Pandey, Mohanty and Nayak46].
Field immersion test
The antifouling efficacy of N-EP and EP-hPD blend coatings was examined, by visual observation after exposing them to seawater as per ASTM D 3623. The panels were immersed at a depth of 5 feet and the distance between the racked panels was maintained as 5 inches. The test was carried out at Chennai Port, Bay of Bengal, India. The digital images of the panels before and after immersion for 9 months have been reported. The N-EP and EP-hPD blend films were cut in identical shapes and immersed in static seawater environment at room temperature for 90 days to access the resistance against static seawater. The morphology of the immersed samples was captured using polarized optical microscope (DM 4500P, Leica Microsystems, Wetzlar, Germany) at a resolution of 20×.
Supplementary material
To view supplementary material for this article, please visit https://doi.org/10.1557/jmr.2019.235.
Acknowledgments
The authors acknowledge the support from Department of Science and Technology (DST), New Delhi, India, with Grant No. DST/TSG/NTS/2014/124.