Introduction
Tomotherapy is a type of radiation therapy technique that is used to treat certain cancer types. Tomotherapy allows to deliver radiation doses to the affected tissues with high precision while avoiding healthy tissues. In radiation therapy that employs high energy photon beams, different types of boluses are used to adjust the final dose delivered to superficial tissues and to modulate dose distribution near the irradiated surface. The role of boluses in dose distribution during neck and head cancer treatment Reference Kassae, Bloch, Yorke, Altsculer and Rosenthal1–Reference Niroomand-Rad, Javedan, Rodgers and Harter3 and in breast radiation therapy Reference Klein, Michalet-Lorenz and Taylor4–Reference Wittych and Kukołowicz6 has been investigated. The air gap often forms under the bolus because of either daily variations in body surface shape or daily differences in bolus settings. Recent studies addressed the effect of air gap under the bolus on dose distribution. Reference Sroka, Reguła and Łobodziec7,Reference Khan, Villarreal-Barajas and Udowicz8 In addition, the effect of variations in air gap shapes on dose distribution to the target area was investigated. However, these reports had studied only a 3D-conventional technique or fixed-gantry intensity-modulated radiation therapy (IMRT) while they did not address the rotated IMRT approach. Recently developed volumetric-modulated arc therapy (VMAT) is now commonly used worldwide. Different variants of IMRT techniques exist and, among these, the effectiveness of VMAT has been compared to fixed beam IMRT Reference Cozzi, Dinshaw and Shrivastava9 confirming the potential of other rotational therapy techniques, such as helical tomotherapy (HT) (Accuray, Sunnyvale, CA, USA). Reference Lian, Mackenzie and Joseph10–Reference Marnitz, Koehler and Burova12 Despite the existence of these advanced techniques, a bolus that results in lower energy build-up and therefore a reduced surface dose delivery to the skin is still used in radiation therapy for certain types of cancer. When patients with head and neck or breast cancer undergo tomotherapy, superficial gross disease is included in the target volume. These areas of superficial disease require an overlaying layer of bolus material to provide dose build-up. The presence of the bolus helps avoid inadequate dose or unwanted modulation of beam intensity at the skin surface. Reference Vyas, Palmer and Mudge13 Hence, it is important for each treatment session to set the bolus position on the surface, which is identical to the one that was defined when the treatment planning CT was taken. Therefore, careful placement of bolus material is important in radiotherapy.
In this study, the effect of the air gap under the bolus was evaluated in both HT as VMAT and direct tomotherapy (DT) as a conventional technique in a simulation study using the Radiotherapy Treatment Planning System. A virtual phantom of a cylindrical shape was used for simulations.
Materials and Methods
Simulation set-up
Simulation planning was performed with HT and DT. The virtual phantom was set to a cylindrical shape, and the target and the bolus were positioned at the top right surface of the phantom to stimulate treatment structures such as lymph nodes of head and neck cancer or breast cancer in the simulation (Figure 1). In breast cancer, the mammary gland tissue is situated near the skin surface. Therefore, the bolus is used to decrease the surface dose and to increase the dose delivered to the target in either situation. The density of the bolus was set to be equivalent to water. The bolus thickness was set to 0 mm, 5 mm and 10 mm as these thicknesses are commonly, Reference Ordonez-Sanz, Bowles, Hirst and MacDougall14 and the air gap between the bolus and the surface was set to 0 mm, 5 mm, 10 mm and 15 mm. A total of 26 plans (different combinations of; thickness of bolus; 0, 5, 10 and 15 mm, air gap; 0, 5, 10 and 15 mm, and irradiation technique; HT and DT) were generated using TomoTherapy planning station (TomoHDTM version. 5.1.1.6) (Accuray, Sunnyvale, CA, USA). In this study, only simulation planning was performed, not dosimetry measurements.
Scheme of the phantom design in this study. This phantom was virtually created in TomoTherapy planning station.

Tomotherapy planning
HT (TomoHDTM version. 2.1.4) (Accuray, Sunnyvale, CA, USA) machine consisted of a 6 MV flattening filter free beam with binary multi-leaf collimator, capable of a minimum leaf opening time of 20 ms. The jaw widths were of sizes 1 × 40, 2·5 × 40, and 5 × 40 cm2 at the Source to Axis distance of 85·0 cm. The dose rate was 850 cGy/min. For the current study, the field width was set to 2·5 cm, the modulation factor was set to 2·0 and a pitch of 0·43 was used for all plans. The gantry angle was set between 0 and 360 degrees in HT, while in DT the gantry angle was set to non-facing two angles (315 and 125 degrees). All plans were designed and optimised on the TomoTherapy planning station. The dose calculation was performed using the superposition algorithm (Reference Aspradakis, Morrison, Richmond and Steele15). A total of 50 Gy in 25 fractions was prescribed to 95% of the target in both HT plans and DT plans. There were no additional dose constraints. The acceptable value was set to up to 107% of the prescription dose. Reference Mrozowska and Kukołowicz16
Evaluation
The evaluation was performed using Velocity AI 3.2.1 (Varian Medical Systems, Palo Alto, CA). The maximum dose, the D98% dose, the D95% dose, the D2% dose and the minimum dose of target, the maximum dose of bolus, homogeneity index (HI), conformity index (CI), and dose-volume histogram (DVH) curves were defined. Dose homogeneity indicated the uniformity of dose distribution within the target volume, and dose conformity was defined as the ratio between the planned target volume and the irradiated volume at specified prescription dose. Reference Luan, Wang and Chen17–Reference Knöös, Kristensen and Nilsson19 The dose conformity and uniformity were measured and estimated according to International Commission on Radiation Unit and Measurement 83. 20 The HI was defined as followsReference Salimi, Abi and Nedaie21:
 $${\rm{HI}} = {{{D_{2\%}} - {D_{98\%}}} \over {{D_{50\% }}}}$$
where D2%, D98% and D50% are the received doses by 2%, 98% and 50% of target volume. The CI was defined as following 20 :
 $${\rm{CI }} = {{{V_{95\%}}} \over {Volume\ of\ Target}}$$
where V95% is the volume of target covered by at least 95% of the prescribed dose.
There was no uncertainty in the results obtained because this was a simulation study. Therefore, statistical analyses are not relevant in this case.
Results
The dose coverage of the target
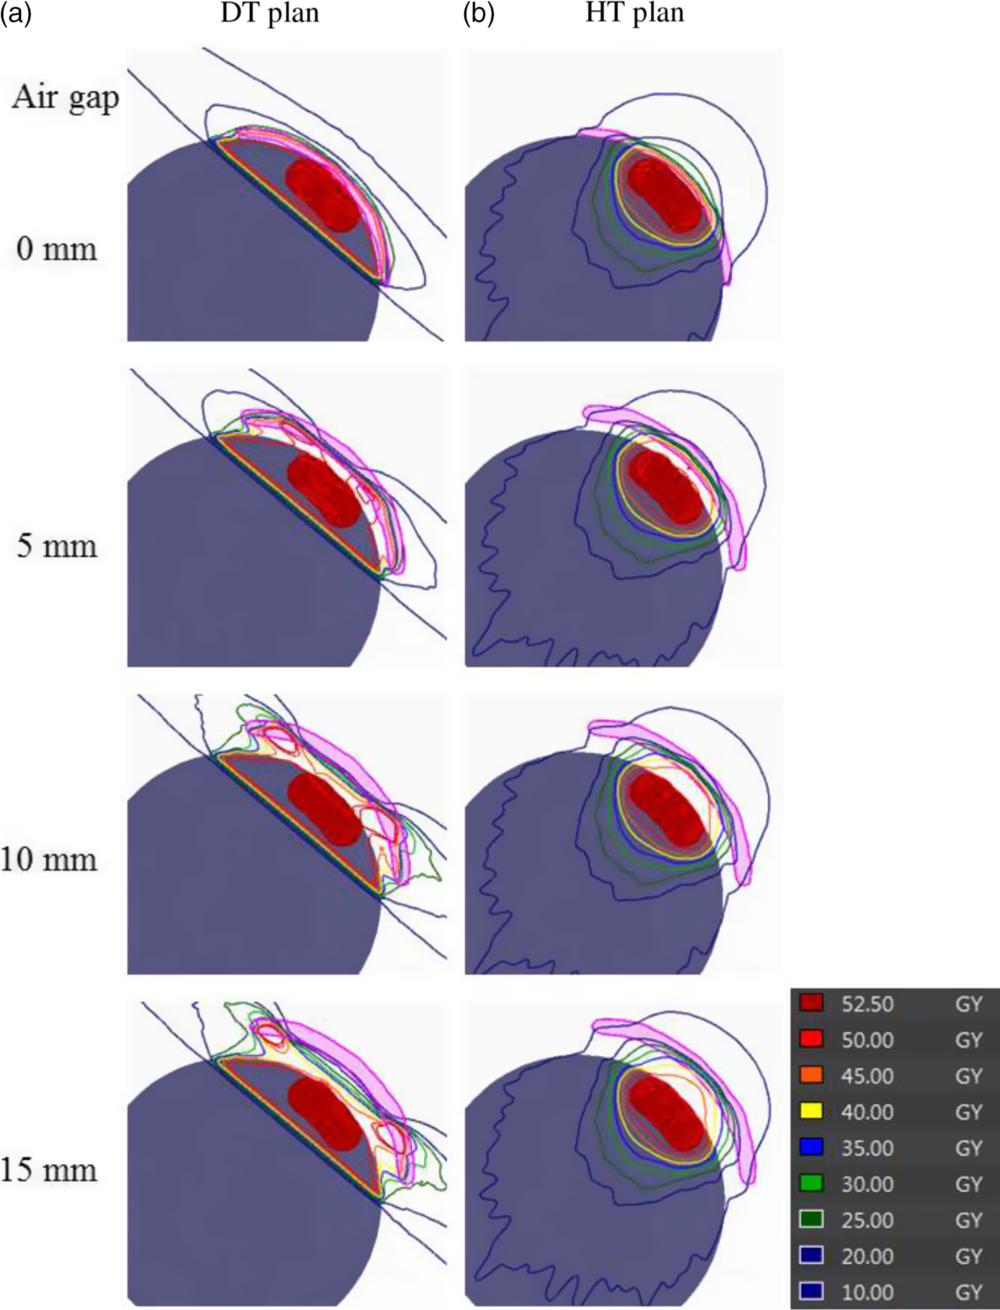
Table 1 shows the simulation results with dose-volume parameters in DT plans. Table 2 shows the simulation results with dose-volume parameters in HT plans. Figure 2 shows the examples of dose distributions, and Figure 3 shows examples of DVH curves obtained for the HT plans and DT plans. From these results, the DVH curves gradually worsened, that is, the slope of the DVH curve became gentler with an increase in the air gap distance in DT plans; however, the DVH curves in HT plans were almost stable when air gap distance was increasing. In other words, the value of D98% decreased and the value of D2% increased when air gap distance increased in DT plans. This means that DVH curve gradually became less sharp in DT plans. The HI values showed no significant difference in all plans; however, the CI value in HT plans was better than that in DT plans (2·27–3·62 at DT plan, 1·51–1·79 at HT plan). As a CI value equal to 1 is optimum, the HT plan also showed better outcome than the DT plan.
The results of dose-volume parameters from DT plans

The results of dose-volume parameters from HT plans

Examples of dose distributions in (a) DT plans and (b) HT plans. The thickness of the bolus was set to 5 mm, and the air gap between the bolus and target surface was set between 0 and 15 mm.
Examples of DVH curves in the HT plans and DT plans. The solid line indicates the DVH curve of target volume in HT plans, and the dotted line indicates the DVH curve of the target volume in DT plans. The thickness of the bolus was set to 5 mm, and the air gap between the bolus and target surface was set between 0 and 15 mm.

The dose deposit in bolus
The maximum dose delivered to the bolus in DT plans was higher than that used in HT plans (93·69 Gy at DT plan and 51·49 Gy at HT plan). Table 3 shows the results of the maximum dose delivered to the bolus in HT plans and DT plans. Figure 4 shows the examples of the maximum dose delivered to the bolus depending on the air gap distance. From the measurements obtained, the maximum dose delivered to the bolus in DT plans was within the range of 1·01% to 1·87%. It was positively correlated with the air gap distance as seen by its gradual increase with the increase in dose level. However, the maximum dose delivered to the bolus in all HT plans was a value within acceptable range of 0·88% to 1·03%.
The results of the maximum dose to bolus of DT plans and HT plans

Examples of the maximum dosages delivered to the bolus in (a) DT plans and (b) HT plans. The thickness of the bolus was set to 5 mm, and the air gap between the bolus and target surface was set between 0 and 15 mm.

Discussion
The main goal of this study was to evaluate the effect of air gap between the bolus and the skin on the radiation dose delivered to a target during HT or DT. On one hand, the HT technique can irradiate the target using rotational angle. On the other hand, DT technique is the same as the conventional irradiation, which has certain limitations. Compared with DT, the advantages of HT for the treatment are manifested mainly in the improved conformity and uniformity of the doses delivered to the target while significantly reducing those delivered to the organs at risk. This is achieved at the cost that lower dose area is spread to the tissue around the tumour and the undesired lower doses are delivered to the healthy tissues. Several previously published reports suggested that VMAT technique was better than the conventional technique. Reference Teoh, Clark, Wood, Whitaker and Nisbet22,Reference Ost, Speleers and De Meerleer23 In this research, the targets for irradiation were head and neck cancers or breast cancer; therefore, the bolus method was employed to improve the dose distribution. However, if an air gap forms between the bolus and the target at the time of CT and at the time of treatment, it might interfere with the proper distribution of irradiation, introducing errors. The dose coverage in HT plans was better than that in DT plans from the results of CI analysis. The maximum value from HT plan was 1·79, and from DT plan it was 3·62. The CI value obtained from HT plan was closer to 1 (the optimum) than that obtained from DT plan. Our measurements are in agreement with those shown in the report from Richard Shaffer et al. Reference Shaffer, Nichol and Vollans24 who suggested that arc irradiation technique achieved equal or better target coverage than fixed IMRT. The remarkable point in this study is that the maximum dose of bolus was used in each plan. The maximum dose of irradiation delivered in HT plans was 51·49 Gy. However, the calculation of the maximum dose delivered in DT plans can be as high as 93·69 Gy. If the position of bolus had changed between planning and treatment, the skin near the bolus might have been irradiated at the very high dose. High dose is known to induce several side effects that cause skin damage. Reference Di Franco, Sammarco and Calvanese25 In other words, the patient suffers from an undesirably high dose under such conditions. In HT plans, it was possible to use the air gap of up to 15 mm without endangering the patient. On the other hand, in DT plans, the air gap must be kept under 5 mm to ensure the appropriate dose delivery without causing harmful effects. As a limitation, DT technique performed in this research was considered a conventional technique. Under different conditions, DT irradiation can be also used as a fixed-field IMRT technique and in this study, these aspects were not addressed. Research regarding the effect of air gap comparing conventional technique and fixed-field IMRT was already reported. Reference Khan, Villarreal-Barajas and Udowicz8 So, we used DT technique as the only conventional technique and evaluated the effect of air gap comparing HT technique and DT technique. Instead, our research suggested that it is needed to ensure the accurate bolus position when DT was used as conventional technique.
Conclusions
In summary, HT plan provided better dose distribution and DVH than DT plan in this research. When the target was treated with bolus, the air gap under the bolus affected dose distribution causing damaging side effect for the patients. In our study, the acceptable air gap under the bolus was up to 15 mm and below 5 mm in HT and DT techniques, respectively. Clearly, HT technique is a good choice, but DT technique can be used as well if the bolus position can be reproduced accurately. Thus, the reproducibility of the bolus position between planning and treatment is the most important factor when using the conventional method. The results of this report will be useful for medical doctors, radiation technologists and medical physicists, as it reminds them that the accuracy of the treatment depends on the accuracy of the bolus placement.
Acknowledgement
The authors thank Hiroki Kawaguchi and Satoshi Seno (Division of Radiation Oncology, Kobe University) for technical assistance.
Financial Support
This work was supported by Grants-in-Aid (nos. 19K08121) for Exploratory Research from the Ministry of Education, Culture, Sports, Science and Technology of Japan.
Conflict of Interest
None.