The liver is particularly susceptible to congestion and ischaemia exacerbated by low cardiac output. Chronic insult can lead to cirrhosis and liver cancer. Reference Sherlock1,Reference Kuwabara, Niwa and Toyoda2 CHDs affecting the right heart are more likely to cause hepatic congestion from pressure or volume overload. Reference Yamamura, Sakamoto and Morihana3,Reference Oka, Nakau and Imanishi4 Post-operative hepatic assessments are important in patients with CHD. Specifically, patients who underwent Fontan procedure for Fontan-associated liver disease require periodic evaluation of the liver. Reference Kuwabara, Niwa and Toyoda2,Reference Ohuchi, Kawata, Uemura and et al5
The current gold standard, liver biopsy, is not routinely performed because of the risk of complications, need for sedation, chances of sampling error, and high cost. An alternative to evaluate liver fibrosis is magnetic resonance elastography; however, this method requires special equipment, making it a difficult screening tool. Reference Cassinotto, Feldis and Vergniol6 Recent advances in MRI have enabled the use of T1/T2 mapping to assess for myocardial fibrosis, hepatitis, and cirrhosis. Reference Moon, Messroghli and Kellman7–Reference Thomaides-Brears, Lepe, Banerjee and Duncker9 Several studies have used cardiac T1 mapping for hepatic evaluation. Reference Wiese, Voiosu and Hove10–Reference Huber, Razakamanantsoa and Lamy15 This proves to be a valuable tool for study to account for the cardio-hepatic relationship. However, the usefulness of liver T1/T2 values in children and the effects of respiration on liver T1/T2 values have not been well studied.
This study aimed to evaluate the usefulness of liver T1/T2 values using cardiac MRI performed and to investigate the effect of respiration on liver T1/T2 values.
Methods
Study design and setting
This is a retrospective conducted in Asahikawa Medical University between April 2020 and December 2021. This study was conducted in compliance with the standards of the Declaration of Helsinki and the current ethical guidelines and was approved by our institutional ethics board (no. 21163). Written informed consent was obtained from all the subjects.
Patients
Patients who underwent cardiac MRI at our institution were considered in the study. Patients who could not tolerate the procedure with two breathing methods (breath-holding and free-breathing) were excluded from the study. Finally, a total of 69 patients were enrolled in the study.
MRI
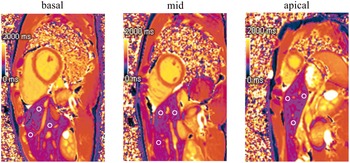
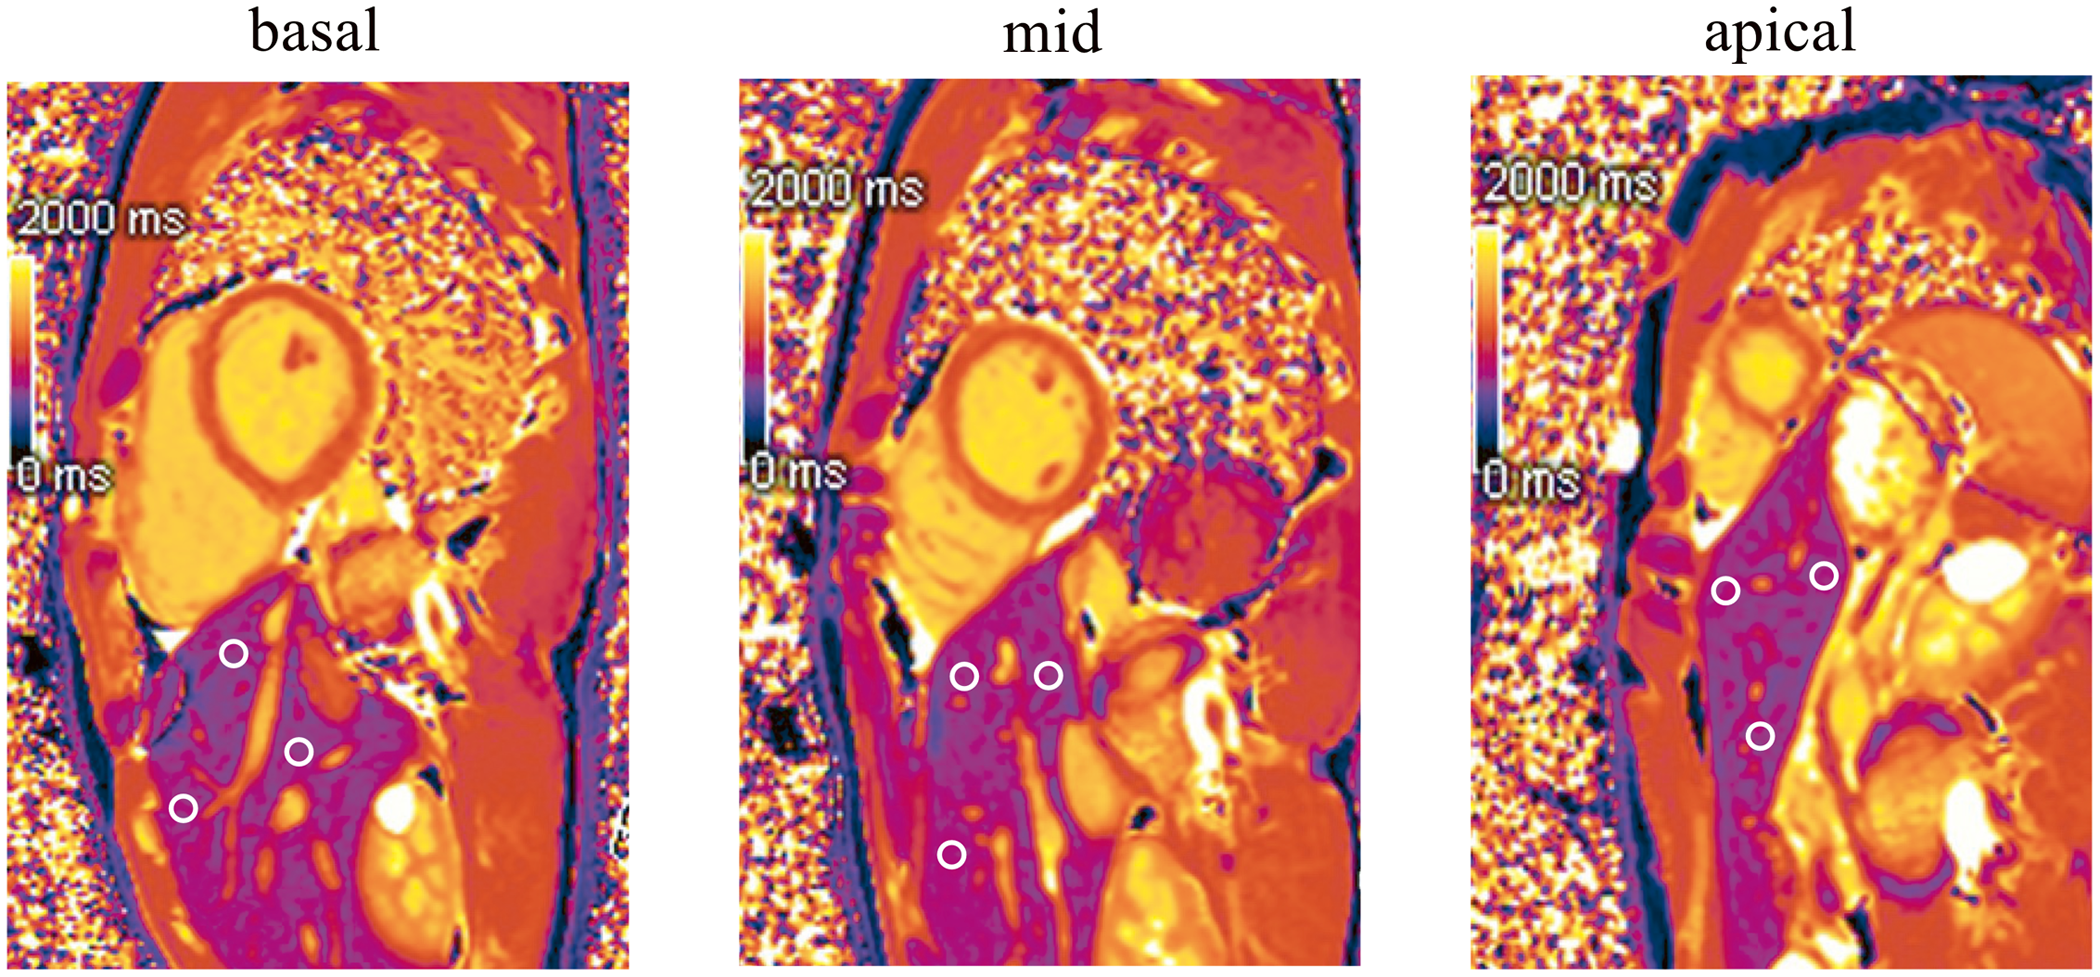
All cardiac imaging examinations were performed using a MAGNETOM Vida (Siemens Healthcare, Erlangen, Germany) with a 3.0 T MR system. The modified Look-Locker inversion recovery sequence with motion correction was used for T1 mapping. The images required for T1/T2 mapping were taken in three cardiac short-axis slices (basal, mid, and apex). Next, liver T1/T2 values were measured at three locations in each section but not too close to the lungs, avoiding blood vessels in the liver. We measured the 9 points shown in Figure 1 and give an average value.
Analysis methods. The images required for T1/T2 mapping were taken in three short-axis slices (basal, mid, and apical), and measured liver T1/T2 values avoiding blood vessels in the liver and not too close to the lungs.
Other scan parameters were as follows: flip angle, 35°; field of view, 360 × 360 mm; matrix size, 256 × 144; slice thickness, 8 mm; acceleration factor, 2; echo time, 1.06 ms, repetition time, 2.53 ms; and shot mode, true fast imaging with steady-state precession pulse sequence, using the 5b(3b)3b scheme. T2 mapping was based on a gradient echo single shot fast low angle shot readout with multiple T2 preparations and recovery periods. An ECG-gated, motion-corrected, short-axis slice was prescribed at the mid-ventricular level with the following parameters: slice thickness: 8 mm; echo time: 1.28 ms; No. of T2 preps: 3 (0, 35, 55 ms); matrix size: 192; field of view (rectangular): 360 mm (phase field of view: 80.2%); bandwidth: 1184 Hz/px; flip angle: 12°. This sequence was obtained only before contrast was given. A workstation (Cvi42, Circle, Cardiovascular Imaging, Calgary, Canada) was used for the analysis.
Ultrasonographic liver elastography
Ultrasonographic liver elastography was performed using Aplio 500 (Canon Medical Systems Corporation, Tochigi, Japan) by professional sonographers. The shear wave velocity was measured five times, and the average value was calculated. The liver stage was determined by real-time tissue elastography images and classified as F 0-4. Ultrasonographic liver elastography was performed within 3 days before the cardiac MRI.
Statistical analysis
All parameters are expressed as mean ± standard deviation values. Statistical differences were determined using the Mann–Whitney U-test and Wilcoxon signed-rank test. Statistical significance was set at p < 0.05. A Bland–Altman analysis was conducted to evaluate the agreement between the two methods. Statistical calculations were performed using the Statistical Package for the Social Sciences (version 28.0; IBM Corp., Armonk, NY, USA).
Results
Patients
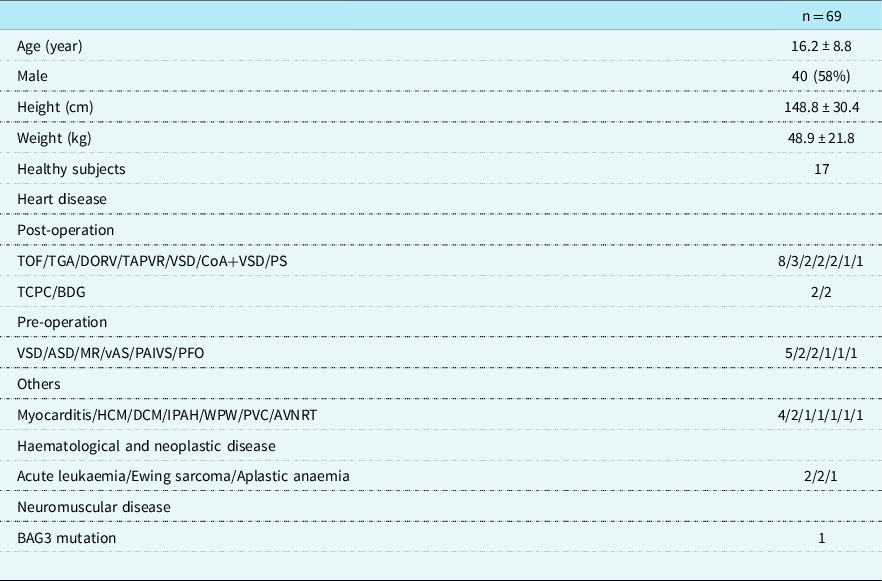
Of the 69 patients included (mean age 16.2 ± 9.8 years; 40 [58%] male), 46 had cardiac disease, five with haematological and neoplastic disease, one patient had neuromuscular pathology, and 17 were healthy (12 males, 5 females) (Table 1). The 17 controls are healthy volunteers. Only 44 patients tolerated MRI with two breathing methods: 34 were assessed for liver T1 and 10 for liver T2. Except for one patient with chronic hepatitis, all patients in the patient group had normal liver function tests. All patients in the control group were confirmed to have no cardiac pathology by echocardiography and no liver pathology.
Participant data
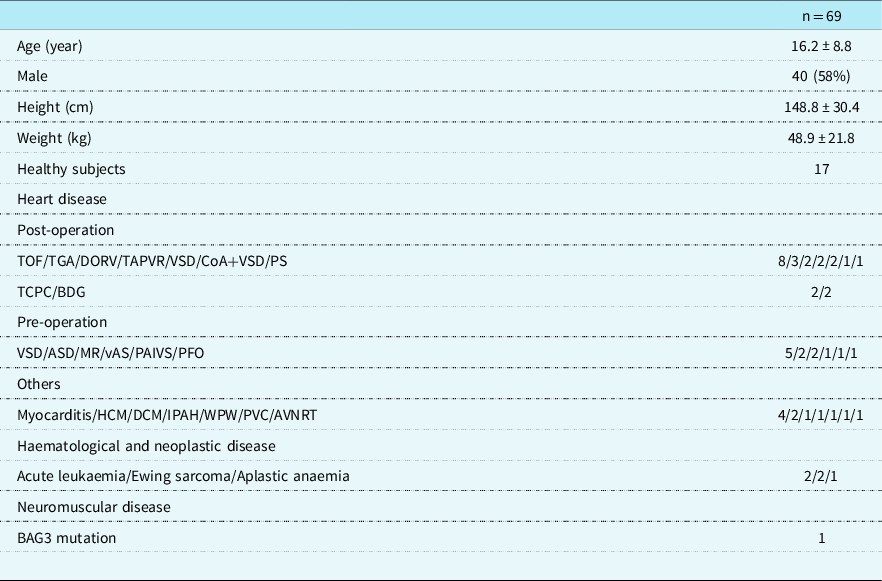
Data are given as mean and standard deviation.
TOF = tetralogy of fallot; TGA = transposition of the great artery; DORV = double outlet right ventricle; TAPVR = total anomalous pulmonary venous return; VSD = ventricular septal defect; CoA = coarctation of the aorta; PS = pulmonary stenosis; TCPC = total cavopulmonary bypass; BDG = bidirectional glenn; ASD = atrial septal defect; MR = mitral regurgitation; vAS = valvular aortic stenosis; PAIVS = pulmonary atresia with intact ventricular septum; PFO = patent foramen ovale; HCM = hypertrophic cardiomyopathy; DCM = dilated cardiomyopathy; IPAH = idiopathic pulmonary arterial hypertension; WPW = wolff-parkinson-white syndrome; PVC = premature ventricular contraction; AVNRT = atrioventricular nodal reentry tachycardia.
Establishment of the normal range of liver T1/T2 values
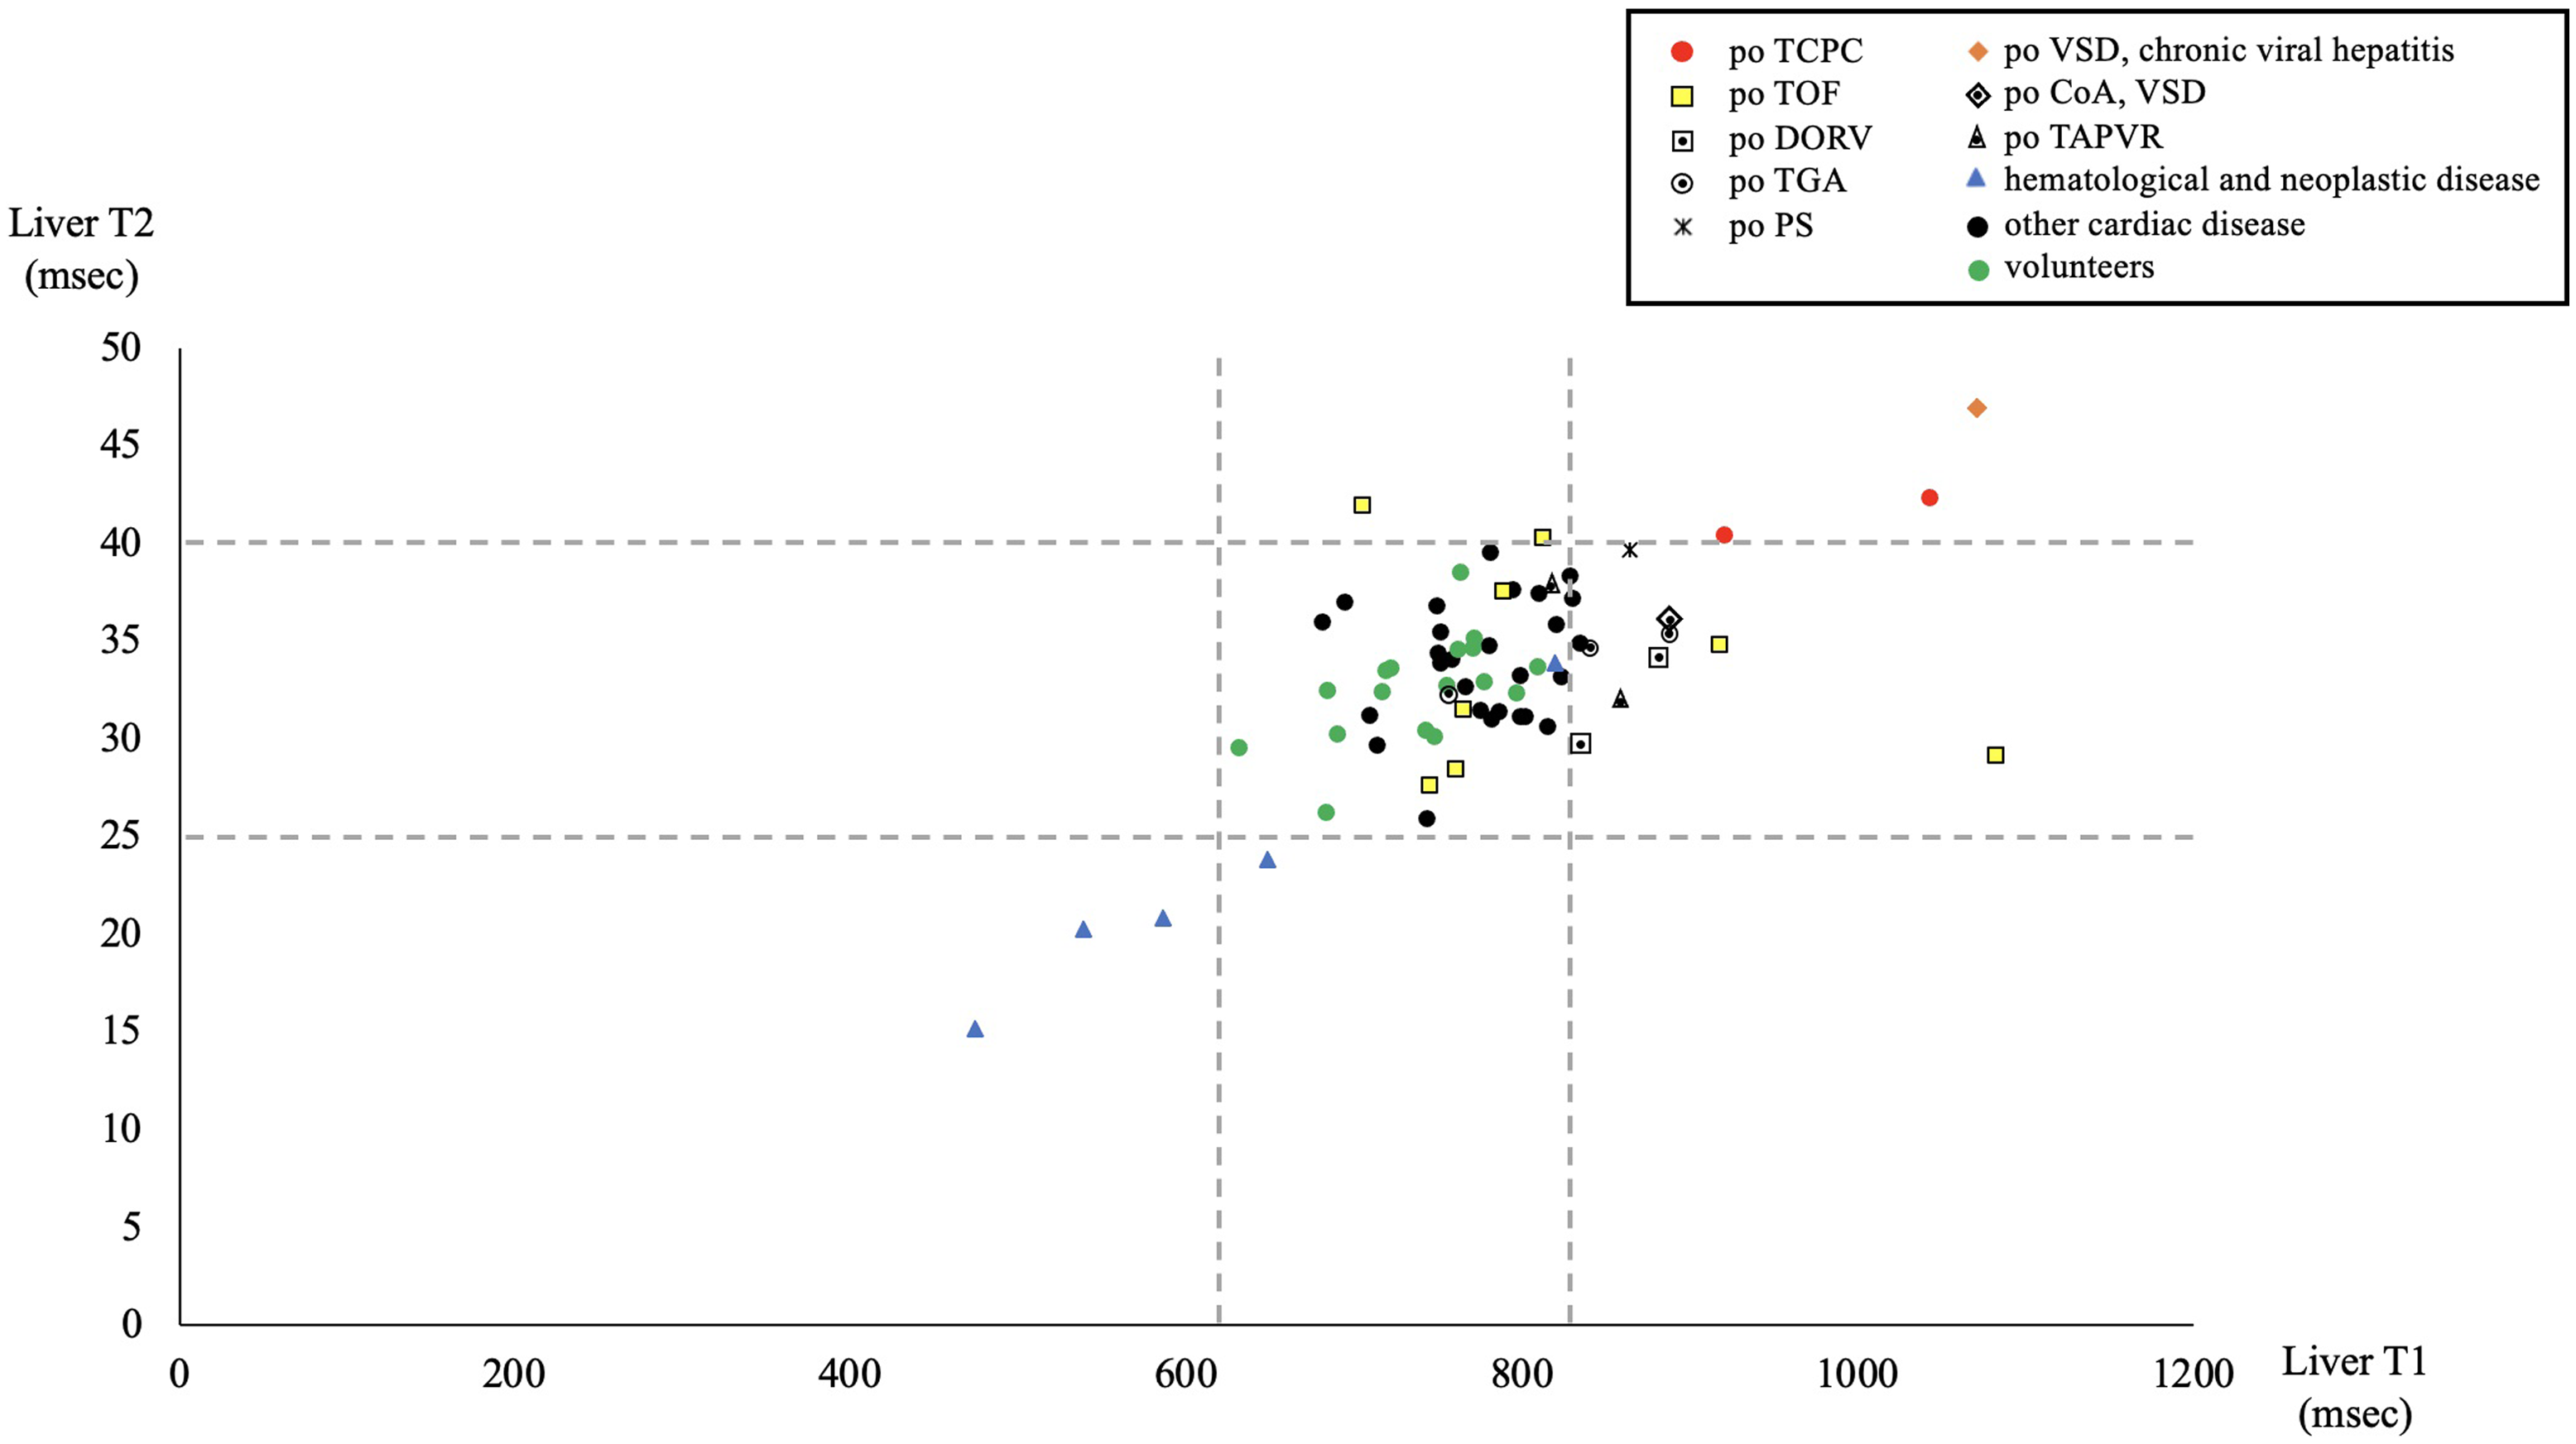
The normal range of liver T1/T2 values was derived from the control group (mean age 23.7 ± 2.2 years; 12[71%] male) (Table 2). The mean liver T1 value was 725.4 ± 48.2 ms in men but was significantly higher in women (767.8 ± 7.7 ms; p = 0.008). The liver T2 value was 31.6 ± 2.3 ms in men and was also significantly higher in women (34.8 ± 2.1 ms; p = 0.011). Although both liver T1 and T2 values were higher among women, they were within the normal range among men. Therefore, the normal range at our hospital was set at 620–830 ms for liver T1 and 25–40 ms for liver T2.
Normal liver T1/T2 values

Data are given as mean and standard deviation.
Variation in liver T1/T2 values with breathing patterns
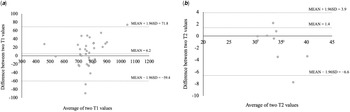
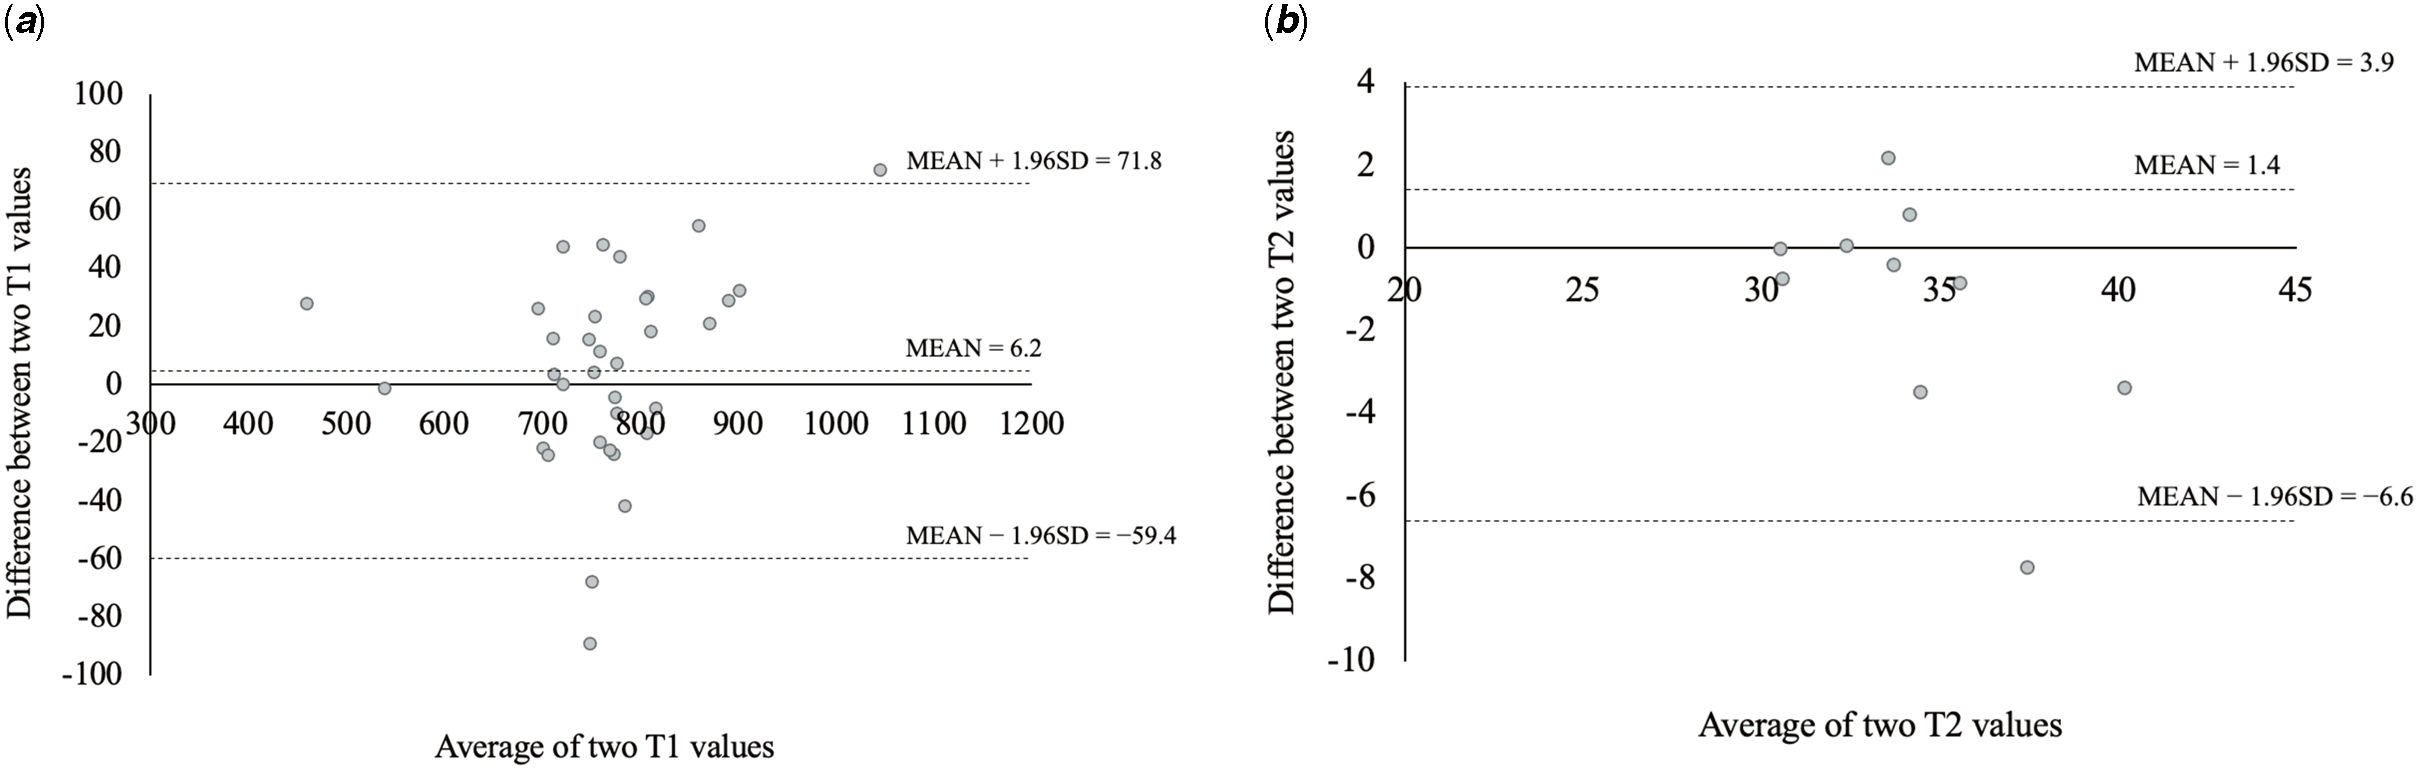
We examined whether liver T1/T2 values varied between the two breathing patterns of breath-hold and free-breath while imaging. Table 3 shows the results of the different breathing patterns in 34 patients. The mean liver T1 value was 769.4 ± 102.8 ms in breath-hold and 763.2 ± 93.9 ms in free-breath, which were not significantly different (p = 0.148). The mean liver T2 value was 33.6 ± 2.4 msec in breath-hold and 34.9 ± 4.0 ms in free-breath imaging, which were also not significantly different (p = 0.169). Bland–Altman analysis showed that liver T1 values were evenly distributed, whereas liver T2 values had a slight negative slope (Fig 2).
Bland–Altman curve between breath-hold and free-breath. ( a ) liver T1, ( b ) liver T2. Liver T1 values were evenly distributed while liver T2 values had a slightly negative slope.
Liver T1/T2 changes with breathing pattern

Data are given as mean and standard deviation.
Distribution of liver T1/T2 values and liver stiffness
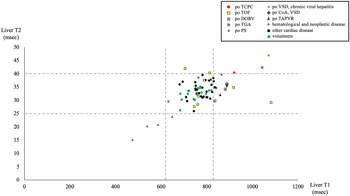
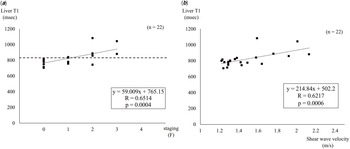
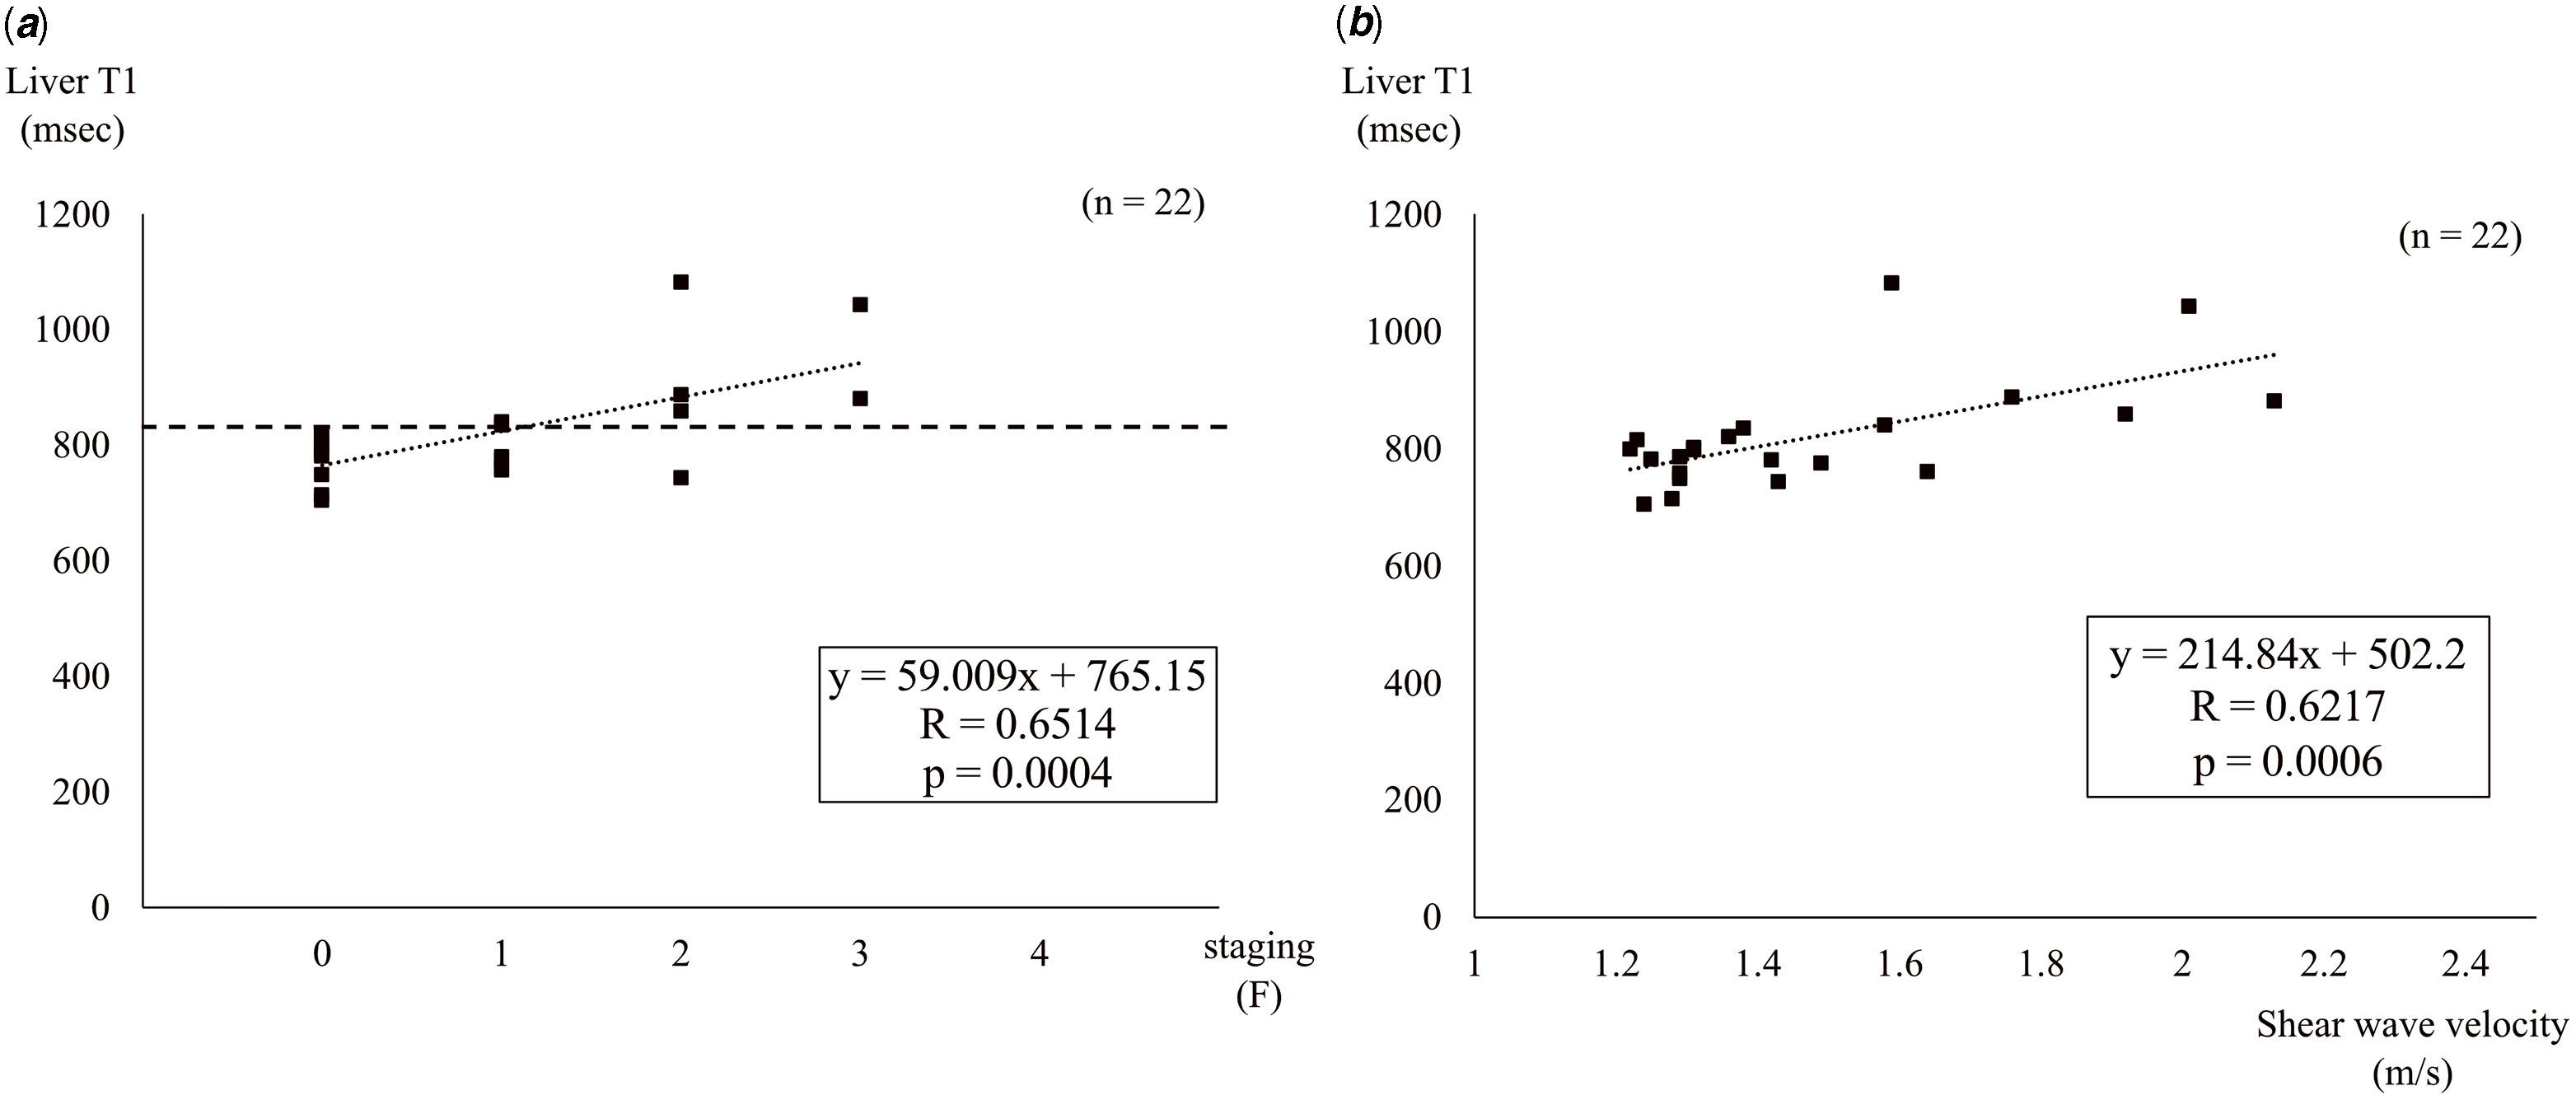
Figure 3 shows the distribution of liver T1/T2 values. The data were basically obtained from breath-hold images. If not available, data from free-breath images were used. In the 69 participants, the liver T1 and T2 values were out of the normal ranges in 17 and 9 individuals, respectively. Liver T1 values were particularly high in patients who had undergone Fontan operation, tetralogy of Fallot repair, or pulmonary artery banding operation with chronic viral hepatitis complications. All patients with low liver T1/T2 values had haematological and neoplastic diseases, such as acute leukaemia, Ewing sarcoma, and aplastic anaemia. Figure 4 shows the correlation between liver stiffness and liver T1 values in 22 patients who underwent ultrasonographic liver elastography. Although there were no patients with F4 stage of hepatic fibrosis, the liver T1 values tended to be higher as the stage increased (R = 0.65, p = 0.0004). In addition, there was a significant correlation between shear wave velocity and liver T1 values (R = 0.62, p = 0.0006).
The distribution of liver T1/T2 values. TCPC = total cavopulmonary bypass; TOF = tetralogy of fallot; DORV = double outlet right ventricle; TGA = transposition of the great artery; PS = pulmonary stenosis; VSD = ventricular septal defect; CoA = coarctation of the aorta; TAPVR = total anomalous pulmonary venous return.
Relationship between ultrasonographic liver elastography and liver T1 levels. ( a ) The liver T1 values tended to be higher as the stage increased (R = 0.65, p = .0004). ( b ) There was good correlation between shear wave velocity and liver T1 values (R = 0.62, p = 0.0006).
Discussion
Our findings showed that liver T1/T2 values were not affected by respiration and that liver T1 values correlated well with the results of elastography in abdominal ultrasonography.
It is necessary to set the normal values at each individual facility because T1/T2 values are affected by the MRI machine, magnetic field, and mapping techniques. Reference Moon, Messroghli and Kellman7 It has been reported that the T1 relaxation time of the liver is not affected by age or sex. Reference Cassinotto, Feldis and Vergniol6
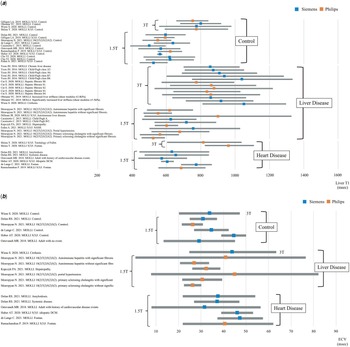
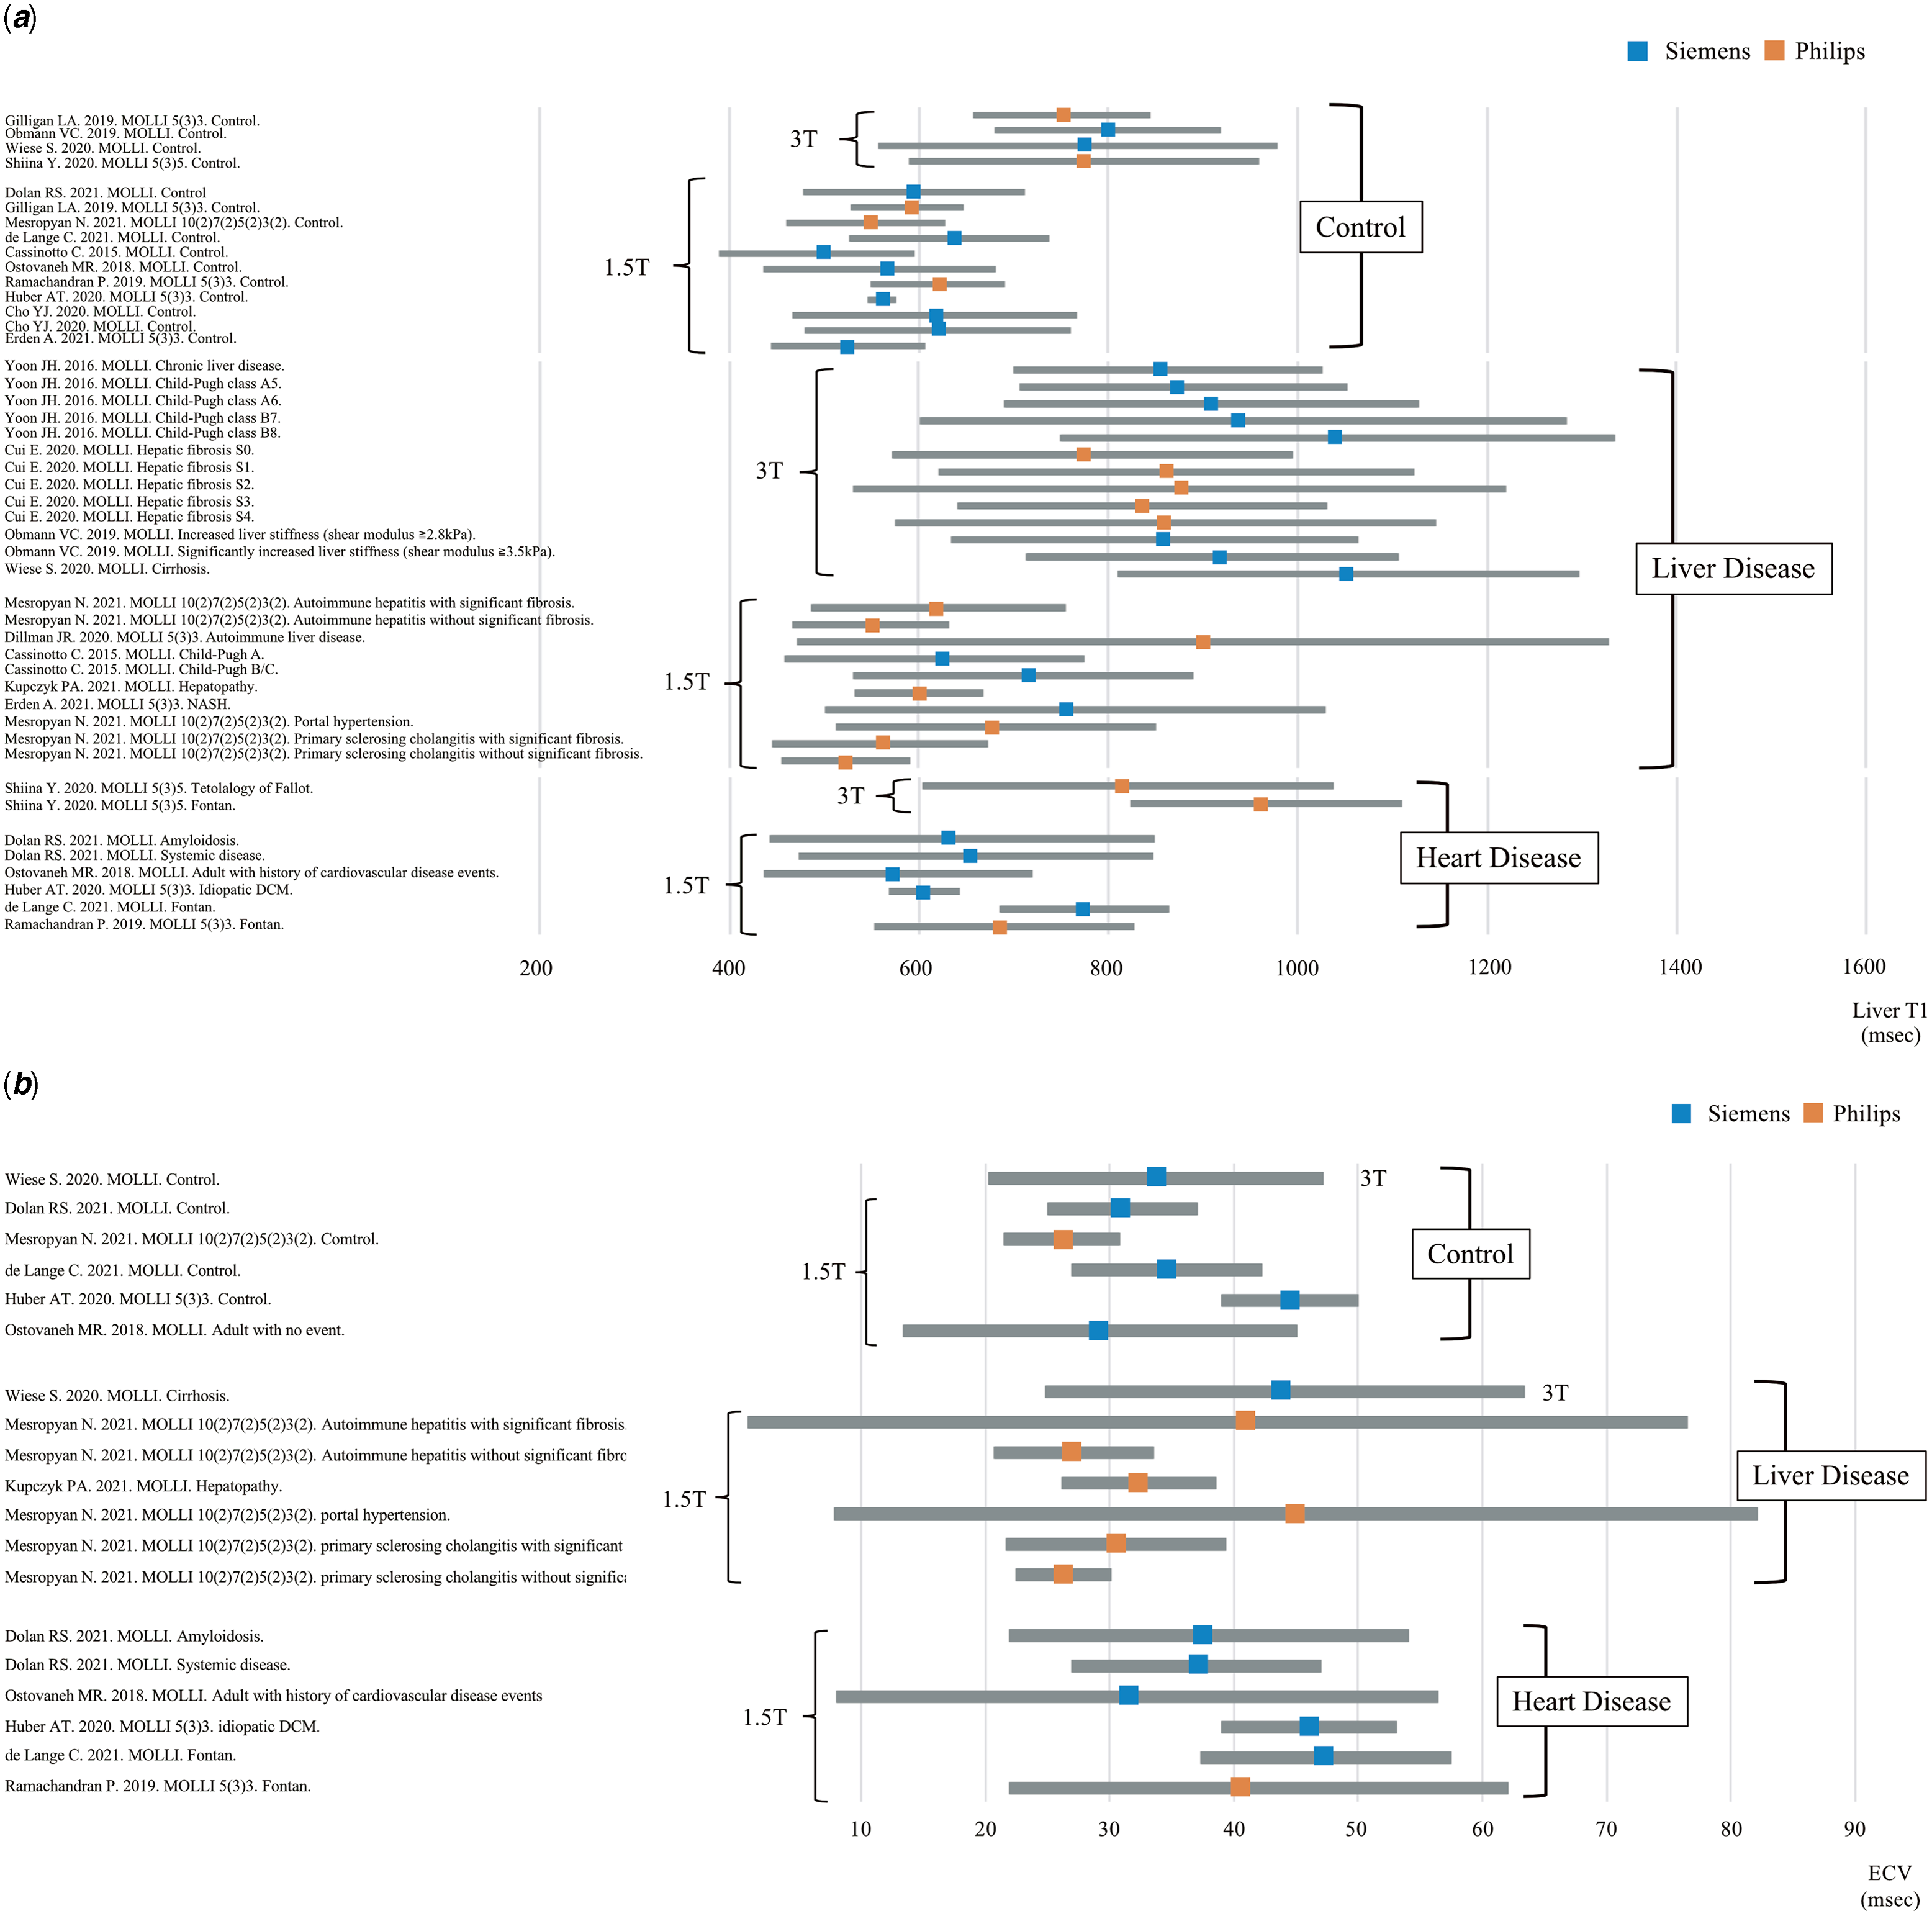
T1/T2 mapping using the modified Look-Locker inversion recovery technique is becoming more common for cardiac MRI. Figure 5 shows a summary of previously reported liver T1 values and extracellular volume (ECV) by modified Look-Locker inversion recovery in children and adults. Reference Cassinotto, Feldis and Vergniol6,Reference Wiese, Voiosu and Hove10–Reference Mesropyan, Kupczyk and Kukuk27 The data were calculated from the range or mean ± 2SD, as described in the paper. Similar to myocardial T1 values, liver T1 values were higher at 3 T than at 1.5 T. Patients with hepatic and cardiac diseases tend to have higher liver T1 values than controls, especially in patients who had undergone the Fontan operation. The number of reports on MRI evaluation of ECV is still small, and there is a large variation in the values among patients. We think that more studies are needed to determine the usefulness of MRI in ECV evaluation.
( a and b ) The liver T1 and ECV values by modified Look-Locker inversion recovery sequence distributions based on published studies.
The present study showed that liver T1/T2 values were not affected by respiration. In a previous report, cardiac T1 values decreased with respiration, while liver T1/T2 values did not change. The changes may be attributed to organ movement with respiration; the liver does not move but the heart does. Reference Oka, Nakau and Nakagawa28 Cho YJ et al. also reported that liver T1 values did not fluctuate between breath-hold and free-breath imaging by measuring the area distal to the lungs. Reference Cho, Kim and Choi20 In paediatric cardiac MRI, the image quality is better with breath-hold imaging; hence, the imaging method may be changed from free-breath to breath-hold when the patient reaches a certain age. Even in such a case, since the liver T1/T2 values are not affected by respiration, it is possible to follow the changes in liver characteristics over time, based on cardiac MRI. T1 values of the liver measured by free-breathing have been shown to correlate with the results of elastography, and therefore, even children who can only be examined by free-breathing can also have their liver status assessed during cardiovascular MRI examinations.
Disease-related changes in liver T1/T2 values were found to be higher after Fontan and tetralogy of Fallot surgical procedures. Reference Shiina, Inai, Ohashi and Nagao11,Reference Kazour, Serai, Xanthakos and Fleck29 We also found that liver T1 values correlated with liver stiffness, which has been reported in the past using magnetic resonance elastography with similar results. Reference Alsaied, Moore and Lang30 It has also been reported that hepatic cancer could be detected by focal changes in liver T1 values and that liver T1 values may be able to capture not only congestion and fibrosis but also malignant lesions. Reference Keller, Borde and Brangsch31 Liver T1 value is expected to aid in early diagnosis of Fontan-associated liver disease and liver damage, and enable early therapeutic intervention. Moreover, patients with haematological and neoplastic diseases accounted for the cases with decreased liver T1 values. This may be attributed to transfusion iron overload. Reference Bulluck, Maestrini and Rosmini8 Excessive iron deposition has a negative impact on liver function. Reference Thomaides-Brears, Lepe, Banerjee and Duncker9 Therefore, cardiac MRI in patients with haematological diseases can not only help to diagnose myocardial damage after chemotherapy but also allow hepatic evaluation. A corrected liver T1 value that takes into account iron levels has also been reported, and this value can be substituted for the liver T1 value. Reference Dillman, Serai, Miethke, Singh, Tkach and Trout25 Therefore, we think that the liver T1 value is sufficient for screening. As for the liver T2 value, we did not find it to be particularly useful in this study, because patients with elevated liver T2 values often had high liver T1 values. Similarly, patients with decreased liver T2 values often had low liver T1 values. In other words, variations in liver T2 values can be determined by checking liver T1 values. Cassinotto et al. also reported that the usefulness of liver T2 values is low. We believe that liver T1 (without T2) is sufficient to evaluate liver function. Reference Cassinotto, Feldis and Vergniol6
This study has some limitations. The degree of congestion had not been assessed. Due to the small number of cardiac patients, we could not study the relationship between central venous pressure and liver T1 values. We plan to study the effects of congestion and ischaemia on liver T1 values in a larger study population in the future. Second limitation is that it is not known whether the changes in liver T1 values in this study reflect congestion or fibrosis in Fontan or tetralogy of Fallot patients. As hepatic congestion progresses, hepatic fibrosis occurs; however, liver T1 value is not sufficient to differentiate between the two. Therefore, we plan to conduct a study combining ECV and liver biopsy in the future. Third limitation is that the small number of the subjects especially for T2 (n = 10). Although more cases are needed to evaluate the variation in T2 values, the usefulness of T2 values in this study is unknown and requires future study. Fourth limitation is the difference in age between controls and disease groups. Although it has been reported that liver T1 values are not affected by age, we think that it will be necessary to measure liver T1 and T2 values in healthy children in the future. Reference Cassinotto, Feldis and Vergniol6
This study shows that liver T1/T2 values were not affected by breathing patterns. Since liver T1 values tend to increase with right heart overload, evaluation of liver T1 values during routine cardiac MRI may enable early detection of future complications.
Acknowledgement
We would like to thank Editage (www.editage.com) for English language editing.
Financial support
This research did not receive specific grants from any funding agency, or commercial or non-profit entities.
Conflict of interest
None.
Author statement
Hideharu Oka: Conceptualisation, Methodology, Validation, Formal analysis, Investigation, Writing - Original Draft, Kouichi Nakau: Writing - Review & Editing, Sadahiro Nakagawa: Methodology, Investigation, Rina Imanishi: Investigation, Sorachi Shimada: Investigation, Yuki Mikami: Investigation, Kazunori Fukao: Investigation, Kunihiro Iwata: Writing - Review & Editing, Satoru Takahashi: Writing - Review & Editing, Supervision.