Introduction
Scanning tunneling microscopy (STM) was introduced in the early 1980s. Reference Binnig, Rohrer, Gerber and Weibel1,Reference Binnig, Rohrer, Gerber and Weibel2 The ability to “see” atoms directly at the surfaces of a wide variety of materials provided the surface-science community with an enormous boost and also became indispensable in other fields of science. Complex structures were easily recognizable, which greatly helped solve the geometrical puzzles of several surface reconstructions. Reference Binnig, Rohrer, Gerber and Weibel2,Reference Takayanagi, Tnishiro, Takahashi and Takahashi3 STM images also provided the first realistic views of the defects that often dominate the behavior of surfaces. Where ideal, flat surfaces had monopolized the descriptions of surfaces thus far, STM made it impossible to ignore the “omnipresence” of steps. Reference Swartzentruber, Mo, Kariotis, Lagally and Webb4 In addition, point defects, such as vacancies, adatoms, and kinks became familiar elements. In many practical processes in which surfaces play an essential role, such as crystal growth, sintering, or heterogeneous catalysis, this role can be traced back to these defects. Reference Pimpinelli and Villain5–Reference Somorjai and Li7
Early STM images immediately fueled the dream that this technique would make it possible to follow some of these processes dynamically and reveal in detail where and how they take place. This would necessitate making STM observations in the conditions under which these processes take place. Technically, this turned out to be far from trivial, as STM is a delicate measurement technique that is “vulnerable” to many external influences. These can make STM imaging challenging or even practically impossible.
In this article, we concentrate on two of these challenges, namely, those introduced by high and even varying temperatures and those involved in high gas pressures (and flows), as well as their combination. We describe the instruments that we have developed to face these challenges and illustrate their application with two examples, namely the growth of graphene by low-pressure chemical vapor deposition (CVD) and the surface structure of catalysts under operation conditions.
Variable-temperature STM
Thermal drift
Early STM configurations were designed for imaging at room temperature. A common problem was that even minor temperature variations in the laboratory or the last few degrees of cooling down of the specimens after a high-temperature preparation step would lead to a noticeable, continuous translation of the STM tip with respect to the imaged surface, both parallel and perpendicular to the surface. Reference Rahe, Bechstein and Kühnle8 This drift results from the differences in thermal expansion between the components in the mechanical path between the surface of the specimen and the tip, including the tip and the specimen itself. Thermal drift distorts the images obtained, makes it difficult to repeat observations on the same area, and even leads to situations where the tip–surface distance drifts out of the limited control range of the instrument; in the last case, either the tip can no longer be brought into tunneling range with respect to the surface, or the tip cannot be retracted sufficiently and is jammed into the surface.
As a consequence of this sensitivity to temperature, it took a relatively long time to develop STM instruments that could be used at nonambient temperatures. Low-temperature STM setups form a class of their own. Reference den Haan, Wijts, Galli, Usenko, van Baarle, van der Zalm and Oosterkamp9 Since most expansion coefficients reduce to practically zero at cryogenic temperatures, these instruments exhibit spectacularly low thermal drift. Another advantage of low temperatures is that they make the step in the occupation number of electronic states extremely sharp, which is exploited in sensitive spectroscopy. Reference Song, Otte, Kuk, Hu, Torrance, First, de Heer, Min, Adam, Stiles, MacDonald and Stroscio10 For the study of dynamic processes, however, cryogenic temperatures are usually not attractive, since thermally activated processes slow down dramatically, to practically zero, as the temperature is lowered.
At high temperatures, thermal drift rapidly becomes a serious issue and in the next section, we describe how this has been dealt with successfully.
Design features of a (truly) variable-temperature STM setup
As previously discussed, the thermal drift observed in STM images results from the differences in the thermal expansion (or contraction) of all elements in the mechanical path between tip and surface. The simplest way to make this difference negligible at arbitrary sample temperatures would be to bring all of these mechanical elements, including the specimen, to the same temperature, for example, by putting the instrument in an oven. When one designs the instrument such that the mechanical path contains two parts with identical materials that compensate each other’s expansions and contractions exactly, there should be no thermal drift, in principle. This approach is typical for cryogenic STM setups and has been adopted in a small number of high-temperature STMs. Reference Lyding, Skala, Hubacek, Brockenbrough and Gammie11
The most important problem with this is that the piezoelectric elements that are typically employed to actuate the STM tip cannot be used above a certain temperature, the Curie temperature, at which the piezo element spontaneously depolarizes. Reference Moulson and Herbert12 For a material such as PZT (lead zirconate titanate), the limiting temperature is 350°C or lower. Even at much lower temperatures, the polarization degrades noticeably. In order to avoid this, it is essential to keep the temperature of the piezo elements low, even when the tip scans over a hot specimen surface. This brings in the additional challenge to tailor the temperature profile over the STM setup, such that while the specimen is hot, the piezo element remains relatively cool. Again, the combination of all expansions should lead to no more than a small displacement of the tip with respect to the surface. On top of this, we require that the expansions should cancel each other not only after completion of a change in temperature, but also during the temperature changes. Otherwise, it would become impractical to perform a series of measurements at different temperatures, since the typical temperature settling time in such an instrument can be several hours. This extra requirement implies that the characteristic time scales for temperature changes should be matched between those components that are supposed to compensate each other’s expansions.
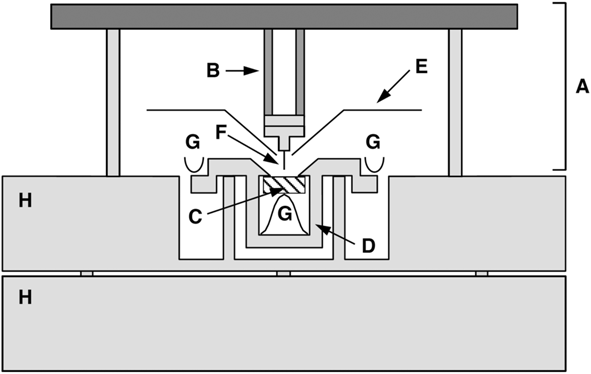
This may seem an unrealistic combination of requirements, certainly if they need to be met for specimens of different materials, each with a different expansion coefficient. Nevertheless, we have succeeded in constructing a truly variable-temperature scanning tunneling microscope that can image a surface while it is heated from room temperature to, for example, 1300 K, and that can keep a certain area on the surface in view over a temperature window of approximately 300 K. Reference Hoogeman, Glastra van Loon, Loos, Ficke, de Haas, van der Linden, Zeijlemaker, Kuipers, Chang, Klik and Frenken13 The instrument has a modular design, in which the specimen plus its holder, the scanner, and the support table that carries the two each exhibit the required internal match of thermal expansions and time scales (see Figure 1 ).
Schematic cross section of the truly variable-temperature scanning tunneling microscope. The scanner A is cylindrically symmetric around the axis through the tip F. It rests with three legs on the support block H. A radiation shield E protects the piezo element B against thermal radiation from the sample C. The sample holder D is clamped down against two supports by leaf springs G. The sample is clamped up against two ledges of the sample holder. Reference Hoogeman, Glastra van Loon, Loos, Ficke, de Haas, van der Linden, Zeijlemaker, Kuipers, Chang, Klik and Frenken13

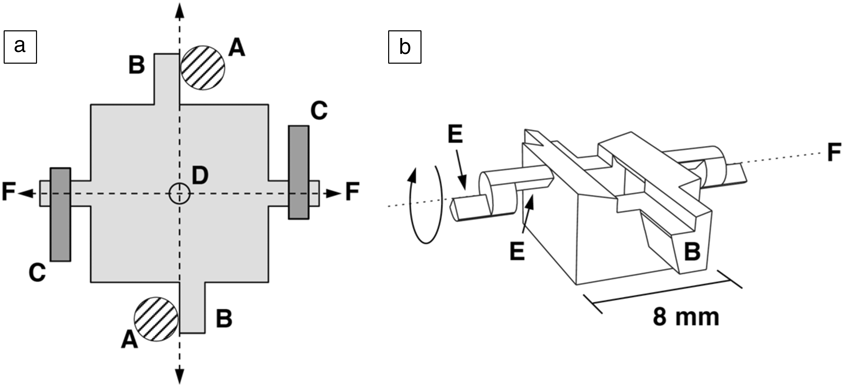
This modularity requires an unusual geometry, in which the height of the sample is fixed inside the sample holder by pushing it with a spring with its surface against ridges in the holder (see Figure 2 ). In this way, the thickness and expansion coefficient of the specimen, which is the hottest element during high-temperature operation, have no effect on the tip-sample distance. This simple design eliminates much of the drift in the corresponding z-direction. In addition, extensive numerical analysis was required in order to quantitatively predict the thermal behavior in full detail (e.g., to calculate the time-dependent temperature of each component following a change in the heating power supplied to the specimen). Parameters that could be adjusted in this exercise were the precise dimensions of all components and, to a certain degree, the materials. Reference Kuipers, Loos, Neerings, ter Horst, Ruwiel, de Jongh and Frenken14 This optimization resulted in a sample holder with a delicate geometry (Figure 2) in combination with a scanner with a relatively simple design (Figure 1). The sample and tip need to be mounted accurately (within 0.1 mm of the perfect position) in order to ensure the desired degree of compensation of expansions along the z-direction.
Schematic (a) top and (b) perspective views of the sample holder body. Four arms extend from the holder. Two of these, B, are rotated against vertical posts A that form part of the support block (Figure 1). The other two are shaped as knife edges, E, and are pressed down against two flat supports by two leaf springs, C. When the holder is heated, it expands outward along the four extensions, but the center, D, stays at its original position. To enable a coarse approach, the scanning tunneling microscope tip is mounted 1 mm away from the rotation axis, F, around which the sample holder can be rotated with the help of an inertial piezo motor. Reference Hoogeman, Glastra van Loon, Loos, Ficke, de Haas, van der Linden, Zeijlemaker, Kuipers, Chang, Klik and Frenken13

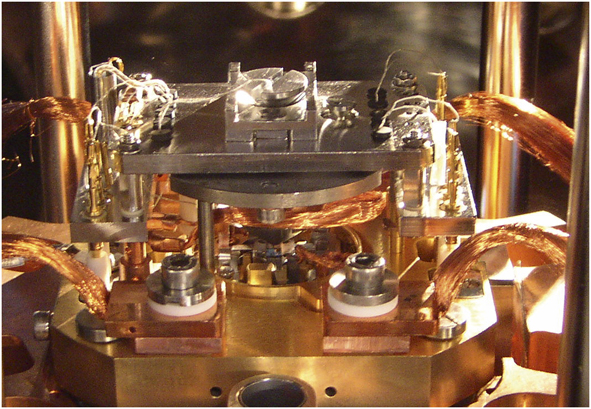
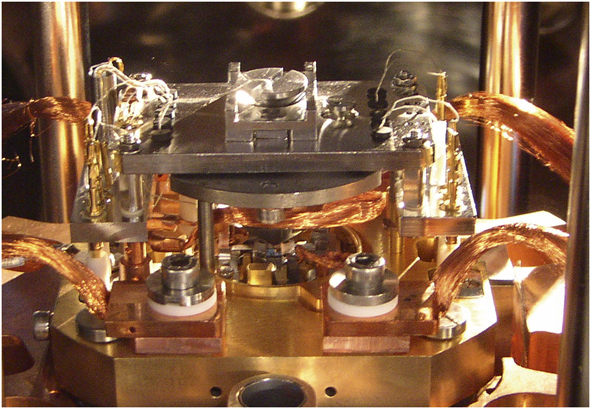
Figure 3 shows a photograph of the truly variable-temperature scanning tunneling microscope with the scanner in position over the special sample holder. The two posts behind the scanner form a part of a spring suspension system with eddy-current damping. Reference Hoogeman, Glastra van Loon, Loos, Ficke, de Haas, van der Linden, Zeijlemaker, Kuipers, Chang, Klik and Frenken13 Using a wobble stick (positioning device used for gripping and transporting objects in a UHV system) and a simple transport system, one can conveniently exchange both the sample and the scanner to separate ultrahigh-vacuum chambers, one of which serves as a storage chamber and another as a load-lock system.
Photograph of the truly variable-temperature scanning tunneling microscope, with the scanner placed over the sample holder. Note: copper braids provide thermal anchoring for the support block (item H in Figure 1).
Special attention has been given to the control electronics and software of this instrument, in order to enable high-speed observations of fast phenomena, such as surface diffusion, phase transitions, and growth processes. The mechanical resonances of the instrument allow us to routinely image at rates of several frames/s on surfaces that are not too rough (local slope angles well below 45°). With a special scanner, optimized for high-resonance frequencies, we have demonstrated imaging rates beyond 100 frames/s.
Live observations of graphene growth at high temperatures
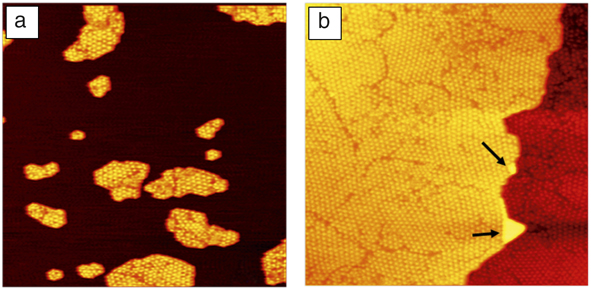
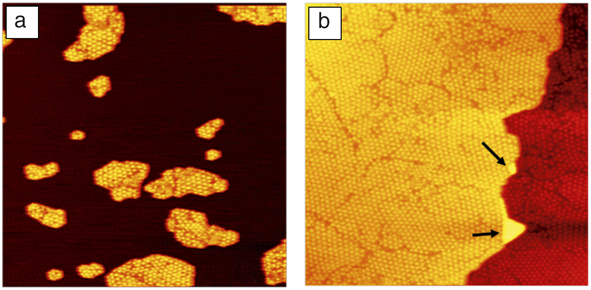
The high-temperature capabilities of our truly variable-temperature scanning tunneling microscope are illustrated in a series of experiments in which we investigated the growth of single-layer graphene by low-pressure CVD on transition-metal surfaces. Figure 4 shows two STM images in which the growth of graphene was followed on a Rh(111) surface. Reference Dong, van Baarle, Frenken and Aliofkhazraei15–Reference Dong, van Baarle, Rost and Frenken17 Prior to obtaining these two images, the experiment started with a seeding procedure, in which the Rh surface was exposed at room temperature to 4 × 10⁻⁷ mbar (4 × 10⁻⁵ Pa) of ethylene gas (C2H4), which was enough to saturate the surface with a disordered molecular overlayer. While the surface was imaged continuously, it was heated at a rate of 0.2 K/s. This led to rearrangements in the overlayer, in which the molecules lost their hydrogen and initially formed small carbon clusters.
Images obtained with the truly variable-temperature scanning tunneling microscope (STM) of graphene formation on Rh(111), starting with a seeded surface. (a) The graphene-seeded Rh surface, obtained by annealing the rhodium surface to 975 K, after exposing it to ethylene at room temperature. (b) Graphene-covered surface, after further ethylene deposition at 975 K. Notice the two Rh double-layer defects, indicated by the arrows. Both STM images have a size of 160 nm × 160 nm. Reference Dong, van Baarle, Frenken and Aliofkhazraei15
At 808 K, the first low-quality moiré patterns were observed that indicated the formation of small graphene patches. On most substrates, there is a lattice mismatch between graphene and the substrate, which generates a modulation in the height of the graphene—a moiré pattern. A close match is obtained between 12 lattice units of graphene and 13 lattice units of rhodium. We use these patterns as “detectors” of the presence of graphene and as indicators of the quality of the graphene.
Figure 4a shows the situation at 975 K. The drift in the z-direction between room temperature and 975 K was sufficiently low (∼100 nm) that no coarse height adjustments were needed at all over this entire temperature range. At this temperature, the rhodium surface was covered by a modest density of medium-sized single-layer graphene patches. Within each patch, a few graphene orientations can be recognized from the differences in orientations and lattice constants of the moiré patterns. We exposed the surface during a period of 76 min at a constant temperature of 975 K to further ethylene gas at pressures ranging from 3 × 10⁻⁹ to 1 × 10⁻⁸ mbar (3 × 10⁻⁷ to 1 × 10⁻⁶ Pa). The final result is shown in Figure 4b. The entire surface is covered with a single monolayer of graphene. The patchwork of different orientations results directly from the variation in initial orientations with which the individual patches were nucleating in the seeding procedure that led to the configuration in Figure 4a. The graphene completely overgrows the atomic step on the rhodium substrate. The only two regions in Figure 4b that are different, are the so-called Rh double-layer defects, indicated by the two arrows. These are regions where diffusing rhodium adatoms on a terrace of bare rhodium were encircled by graphene; when further graphene growth reduced the bare rhodium area, the areal density of the rhodium adatoms grew until it reached a level that was high enough to nucleate a new rhodium monolayer. We observed that this process would typically lead to structures that were two rhodium layers high, rather than one.
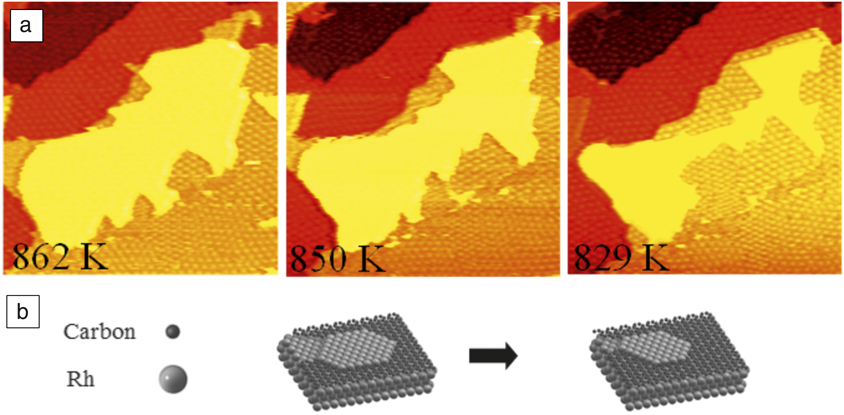
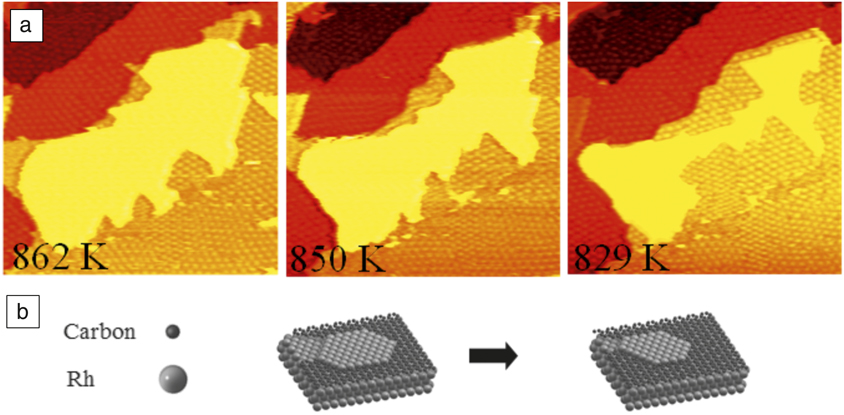
In addition to heating and high-temperature exposure experiments, we also performed cooling experiments in the absence of ethylene. Reference Dong, van Baarle, Frenken and Aliofkhazraei15 For entropic reasons, a lowering of the temperature leads to a reduction in the bulk solubility of carbon atoms in the rhodium substrate, which results in segregation of dissolved carbon back to the surface. Therefore, when we cooled the rhodium surface after it was covered at high temperature by a full graphene monolayer, we obtained a rough graphene layer at room temperature, which we ascribe to accumulation of segregated carbon below the graphene. When we followed the same procedure, starting at high temperature with an incomplete graphene layer, we observed further growth of the graphene due to incorporation of segregated carbon at the graphene edges. This is illustrated in Figure 5 . Again, we take advantage of the low-drift properties of the microscope, by imaging a single region at the surface not only at high temperatures but also over a range in temperature.
Graphene formation by segregation of dissolved carbon. (a) Images obtained with the truly variable-temperature scanning tunneling microscope of the same area during the cooling down of Rh(111), partly covered by graphene (orange, red, and dark red), after the room-temperature seeding procedure and ethylene exposure at 977 K. The central rhodium terrace (yellow) is at the same level as the surrounding graphene (orange), implying that rhodium atoms are diffusing out of this area as the graphene grows. Image size: 100 nm × 100 nm. (b) Ball model illustrating the growth of graphene through segregated carbon and the corresponding reduction of Rh area. Reference Dong, van Baarle, Frenken and Aliofkhazraei15
ReactorSTM
Catalysis
One of the primary motivations for detailed investigations of clean and adsorbate-covered metal surfaces has always been the role that these surfaces and their adsorption processes are thought to play in heterogeneous catalysis. Reference Somorjai and Li7 Often, the metal in a catalyst is present in the form of nanoparticles on a convenient support. Traditionally, the idea is that the catalytic metal surface presents favorable adsorption sites that interact significantly with the adsorbed (reactant) molecules and affect their internal bonding as well as the pathways and activation energies for their chemical conversion. On the other hand, the interaction cannot be too strong, because this would make it difficult for molecules, in particular, product molecules, to desorb.
What is left out from the previously mentioned description is the possibility for the metal to engage intimately in chemical intermediates with the reactant molecules. In other words, the catalyst may be involved actively in intermediate products and thus introduce altogether new reaction pathways. Alternatively, the modifications may lead to an alternative form of the catalyst that may exhibit a higher activity or selectivity for the desired chemical reaction than the bare metal surface. Even in cases where the formation energies of such intermediate products or modified forms of the catalyst would be unfavorable, the free energy for their formation could still be favorable under the high pressures that are typically applied in industrial catalysis. There is a growing body of evidence that such situations establish the “rule” rather than the exception.
When catalysts acquire their active forms under reaction conditions, it is essential that we investigate them under these conditions, typically under high reactant pressures and at elevated or even high temperatures. This insight has fueled the recent adaptation of an expanding range of sensitive surface-science techniques that are traditionally restricted to ultrahigh-vacuum conditions and low, rather than high, temperatures, toward the more daring conditions of practical catalysis. Reference Groot and Frenken18 Among these are STM, surface x-ray diffraction, x-ray photoelectron spectroscopy, and transmission electron microscopy. Here, we introduce the special design features of the high-pressure, high-temperature STM setup that we refer to as the ReactorSTM. Reference Herbschleb, van der Tuijn, Roobol, Navarro-Paredes, Bakker, Liu, Stoltz, Cañas-Ventura, Verdoes, van Spronsen, Bergman, Crama, Taminiau, Ofitserov, van Baarle and Frenken19
Design of a high-pressure high-temperature STM setup
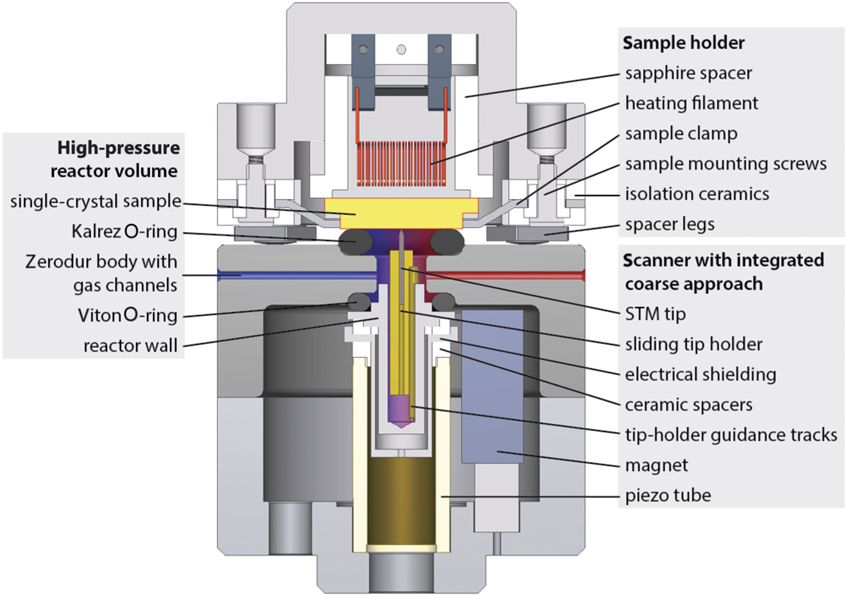
Three independent considerations forced us to adopt a highly unconventional design for the ReactorSTM, our scanning tunneling microscope for high pressures and high temperatures. Reference Herbschleb, van der Tuijn, Roobol, Navarro-Paredes, Bakker, Liu, Stoltz, Cañas-Ventura, Verdoes, van Spronsen, Bergman, Crama, Taminiau, Ofitserov, van Baarle and Frenken19 (1) In order to be able to perform our experiments on well-defined (e.g., [initially] clean and well-ordered single-crystal) surfaces, the setup needs to contain regular preparation and characterization tools and ultrahigh vacuum. (2) During the high-pressure experiments, also with highly corrosive gases, ideally only the model catalyst should be exposed to the gases, while the delicate components of the setup, such as the piezo element and the sample heating device as well as all other surface-science tools, should be kept in (ultrahigh) vacuum. (3) For rapid variations in the composition of the reactant gas mixture and for sensitive and fast measurements of the catalytic activity, the total gas volume should be minimized. The setup is designed as a combination of a traditional ultrahigh-vacuum system with a tiny high-pressure gas cell that is integrated with the STM (see Figure 6 ).
Schematic cross section of the central components of the ReactorSTM. The (yellow) sample is held in a sample holder (top part) with a heater, thermocouple, and electrical connections. Here, the sample is placed on top of the scanning tunneling microscope (STM) scanner part of the system. In this position, it forms the “lid” of the 500 μl reactor. The reactor body is made of Zerodur glass. The reactants enter through a capillary from the left (blue) and the reacted gas mixture leaves the reactor through a capillary on the right (red), where it is connected to a separate mass spectrometry system. The small reactor is sealed off against the sample surface via a Kalrez seal and against the top of the piezo element with a Viton seal. The piezo element itself remains in ultrahigh vacuum. Reference Herbschleb, van der Tuijn, Roobol, Navarro-Paredes, Bakker, Liu, Stoltz, Cañas-Ventura, Verdoes, van Spronsen, Bergman, Crama, Taminiau, Ofitserov, van Baarle and Frenken19
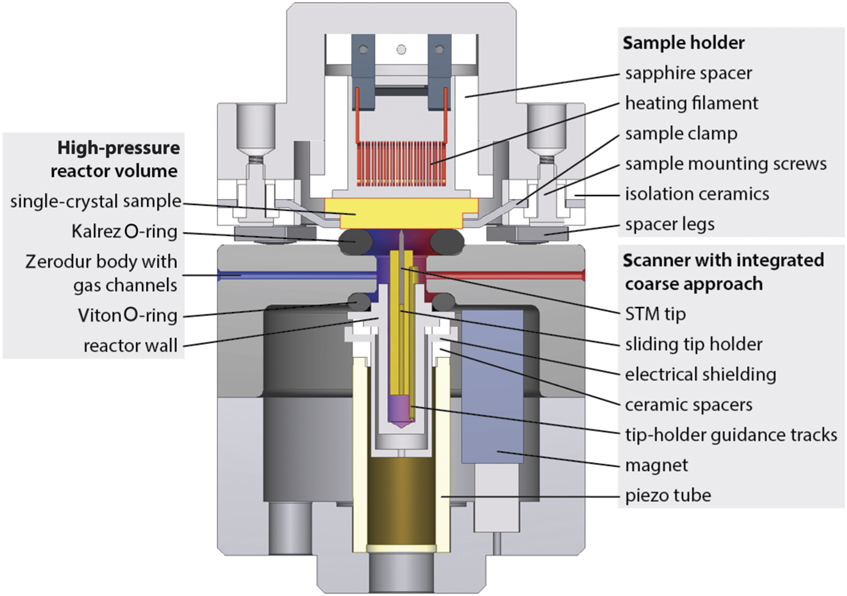
The sample is carried by a convenient sample holder with integrated heating and temperature measurement. A transport system makes it easy to introduce new samples into the system and to bring samples to separate vacuum chambers for sputter cleaning, various forms of deposition, low-energy electron diffraction, Auger electron spectroscopy, x-ray photoelectron spectroscopy, and scanning tunneling microscopy. When the sample is in the STM position, a Kalrez elastomer seal is located between the surface of the sample and the reactor body (see Figure 6). Between the reactor and the piezo element of the STM is a Viton elastomer seal. Together, the two seals make it possible to fill up the tiny reactor volume with gas mixtures up to a total pressure of 6 bar (6 × 10⁵ Pa), while the pressure in the surrounding ultrahigh-vacuum chamber remains unaffected. Presently, the setup is being modified to accommodate pressures up to 20 bar (2 × 10⁶ Pa). The only STM components that are exposed to the gases are the tip and its gold-coated holder, which can slide in submicrometer steps in order to provide coarse z-positioning, bringing the surface into the z-control range of the piezo element. The piezo element itself is kept in a vacuum. The reactor is usually operated in flow mode, and the gases are led into and out of the small reactor volume by capillaries. These capillary gas lines are thin enough that they are easily integrated with a traditional spring suspension and eddy-current damping system that decouples the system mechanically from external vibrations.
Live observations of the structure of an oxidation catalyst in action
We illustrate the successful application of the ReactorSTM to two special structures that form spontaneously at model catalyst surfaces under realistic reaction conditions. In the first example, we concentrate on the close-packed Pt(111) surface. Reference van Spronsen, Frenken and Groot20 Platinum is known to be an excellent oxidation catalyst, and it is one of the dominant materials in the three-way car catalyst. Even though this has fueled an impressive number of detailed studies of the structure of platinum surfaces, their interaction with oxygen and other adsorbates, and the interaction between various molecules on platinum, only a small number of these have directly addressed the atomic-scale structures under actual reaction conditions.
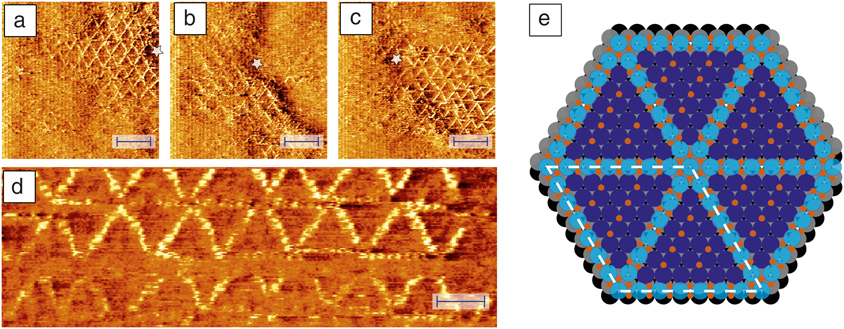
In early, high-pressure STM studies Reference Hendriksen and Frenken21,Reference Hendriksen, Ackermann, Bobaru, Popa, Ferrer and Frenken22 and accompanying surface x-ray diffraction experiments on Pt(110) under CO oxidation conditions, Reference Ackermann, Pedersen, Hendriksen, Robach, Bobaru, Popa, Quiros, Kim, Hammer, Ferrer and Frenken23 we found evidence for the formation of an ultrathin oxide-like layer on the metal surface, and we argued that this surface oxide would serve as the intermediate product in a Mars–van Krevelen-type reaction mechanism. Reference Mars and van Krevelen24,Reference Doornkamp and Ponec25 Whether this oxidized surface should be regarded as the active state of the catalyst, and whether this behavior can be generalized further to other oxidation catalysts and even to other reaction systems is the subject area of an ongoing debate. Clearly, there is a delicate interplay between the chemical environment in which the catalyst is placed, the structure of the catalyst, and the resulting catalytic activity. This interplay can be unraveled only by high-resolution observations of the catalyst structure and performance while it is fully exposed to the reactants at the appropriate combination of partial pressures and temperature. Figure 7a–d shows some of the first atomically resolved STM images that we obtained with the ReactorSTM of a platinum surface, Pt(111), at a high temperature and a high pressure of oxygen. Reference van Spronsen, Frenken and Groot20 The observed structure is a spoked-wheel pattern of raised atoms.
Observations obtained with the ReactorSTM (scanning tunneling microscope) of Pt(111) in 1 bar (1 × 10⁵ Pa) O2 at 529 K. A spoked-wheel motif with embedded PtO2 rows can be recognized, with a variety of structural defects. (a–c) Larger domains of this structure; the star serves as a reference point and indicates slow thermal drift. The scale bars correspond to a distance of 4 nm. The enlarged detail in (d) shows the atomic resolution within the spokes. The scale bar in (d) indicates a distance of 2 nm. (e) Ball model with the oxidized Pt atoms in light blue, the O atoms in red, and the regular Pt surface atoms in dark blue (layer 1), gray (layer 2), and black (layer 3). Reprinted with permission from Reference van Spronsen, Frenken and GrootReference 20. © 2017 Macmillan Publishers Ltd.
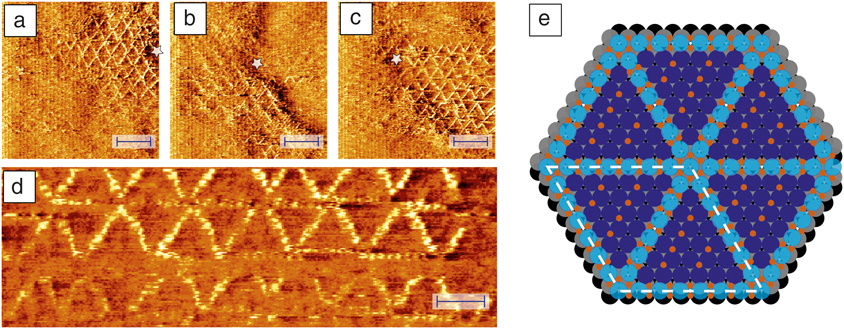
We carried out additional STM observations under a variety of conditions and a detailed inspection of x-ray photoelectron spectra and compared our results to earlier observations under various oxidative conditions to verify that this structure corresponds to the geometry shown in Figure 7e. Each spoke is an oxidized row of seven platinum atoms, each accompanied by four oxygen atoms. The oxide rows are embedded in the first layer of the platinum surface, where each takes the place of eight “regular” platinum atoms. The red dots between the spokes form a p(1 × 2)-O chemisorption structure. Similar structural elements are also present in some lower-pressure observations on Pt(111) under the influence of more strongly oxidizing species, such as NO2, but the density of oxide rows is much lower in those cases. We speculate that by raising the chemical potential of oxygen via the high partial pressure of O2 in our observations, we counteracted the high surface stress that is involved in the spoked-wheel structure and thus brought this surface into a state where it is prone to donate oxygen atoms to other oxidation reactions. In other words, by stabilizing an energetically unfavorable reaction intermediate, the high O2 pressure may be enabling a new oxidation pathway.
Live observations of the accumulation of a reaction product
For our final example, we turn to the Fischer–Tropsch (FT) synthesis reaction. Reference Geerlings, Wilson, Kramer, Kuipers, Hoek and Huisman26 Like oxidation catalysis, FT synthesis has a rich history; it is the reaction that is used to form linear alkane and alkene chains from CO and H2 (e.g., to produce synthetic fuel). Catalysts for this reaction are often based on cobalt, and the mechanism is thought to be a straightforward, stepwise addition of alkyl (CH2) units to one end of a linearly growing hydrocarbon chain. Reference Van der Laan and Beenackers27 With a fixed probability per unit for this process to terminate, the resulting product distribution takes on a simple, exponential form, as is indeed found in practice.
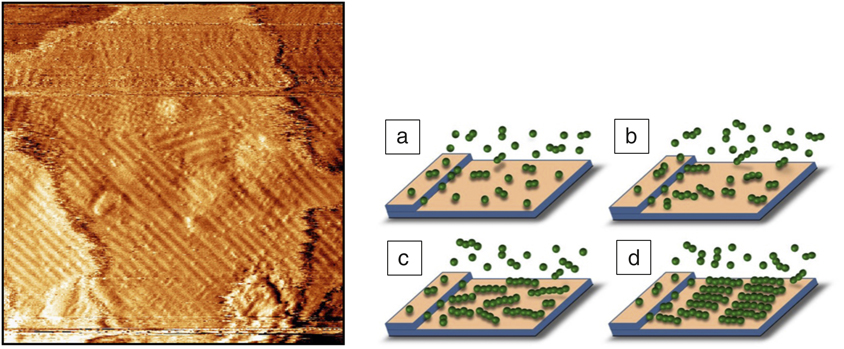
As Figure 8 illustrates, our high-pressure, high-temperature STM observations showed the formation of an ordered overlayer on the Co(0001) model catalyst surface. Reference Navarro, van Spronsen and Frenken28 The STM image in the figure was taken 40 min after exposing the cobalt surface, stabilized in an H2:Ar = 1:4 mixture at 4 bar (4 × 10⁵ Pa) and ∼495 K for 2 h, to so-called syngas, a stoichiometric 1:2 mixture of CO and H2. Earlier STM images had revealed the nucleation and growth of overlayer islands, and the image in Figure 8 shows the final configuration, obtained when the overlayer had colonized the entire surface. Stripe-like patterns, such as those in the STM image, are familiar in the context of the adsorption and spontaneous ordering of linear hydrocarbon molecules on metal surfaces, Reference Uosaki and Yamada29 and this interpretation is illustrated schematically in Figure 8c–d. Nevertheless, two aspects of the pattern are surprising.
(Left) Image obtained with the ReactorSTM (scanning tunneling microscope) of the Co(0001) surface, 40 min after the start of its exposure to 4 bar (4 × 10⁵ Pa) of an 1:2:2 mixture of CO, H2, and Ar at a temperature of 483 K. (Right) The schematic pictures (a–d) illustrate how the overlayer forms as rows of well-organized hydrocarbon molecules. Reference Navarro, van Spronsen and Frenken28
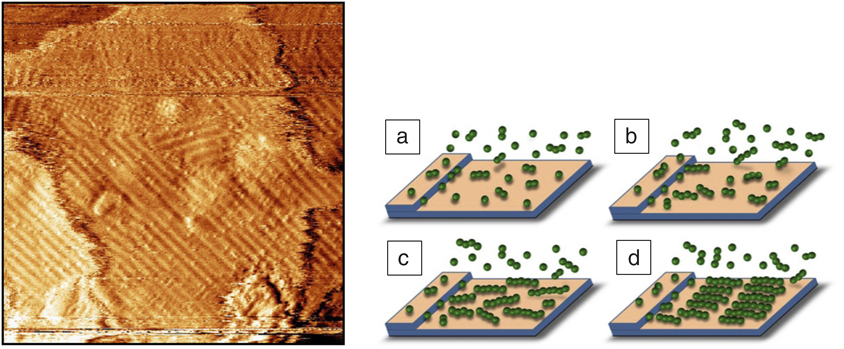
The presence of a regular stripe pattern with a well-defined period indicates that the surface is populated primarily with a single chain length, even though the exponential distribution of chain lengths previously mentioned should be rather wide. Also surprising is that the observed, average stripe width of 1.8 ± 0.3 nm corresponds to chains with a remarkable length of 14 ± 2 carbon atoms, much larger than the average chain length expected from a simple, unpromoted cobalt catalyst. We explain these observations in terms of two competing effects. Even though the shorter molecules are formed more often than the long ones, they readily desorb from the metal surface; hence, their surface coverage is established almost instantaneously, but it is negligibly low. It takes much more time for a significant number of long molecules to form, but since they have more interaction with the substrate, they will eventually accumulate to higher concentrations. A simple, numerical calculation shows that the first molecular length for which this accumulation will lead to a concentration at which islands should be expected to form, is in the order of 15 C atoms and that the time required for this accumulation to take place under the conditions of our experiment is on the order of 20 min. Both estimates correspond well to the experimental observations and provide confidence in this interpretation. Reference Navarro, van Spronsen and Frenken28
The scenario revealed here implies that in the early stages of the “life” of the catalyst, the reaction itself is modifying the catalyst, in this case not by restructuring the metal surface, as we found for Pt(111), but by covering the metal surface with a film that is nearly chemically inert. The mere presence of this film should reduce the attraction between the substrate and newly formed hydrocarbon molecules on top. We imagine that this makes it easier for the chain growth of these new molecules to terminate and for the molecules to desorb. This will significantly reduce the average chain length, produced in the process, which should be regarded as a reduction in the performance of the catalyst. On the other hand, the easier release of the product molecules may be a highly necessary property of the catalyst in order to avoid its direct inactivation by a rapidly thickening, tightly bound product film. Maybe, the product monolayer that we have identified here is therefore somewhat of a “mixed blessing.”
Summary and outlook
In this article, we described two STM systems for the observations of live processes under realistic process conditions, the truly variable temperature scanning tunneling microscope and the ReactorSTM, and we have provided examples of research conducted with these instruments. These STM developments go hand in hand with similar developments in atomic force microscopy Reference Roobol, Cañas-Ventura, Bergman, van Spronsen, Onderwaater, van der Tuijn, Koehler, Offitserov, van Baarle and Frenken30 and in a growing number of other experimental techniques that were originally thought to be strictly limited to the conditions of ultrahigh vacuum and room temperature (or cryogenic temperatures). Technically, this often involves serious complications in the design and construction of these instruments, and this makes the effort required for these developments significant. This is why we regard it as essential that the resulting instruments are developed and commercialized such that the entire research community can benefit from them.
Acknowledgments
This article is dedicated to our “pioneers” for the two featured STM systems, L. Kuipers, P.B. Rasmussen, and B.L.M. Hendriksen. Over a period of more than two decades, their work has been supported, augmented, and brought to further fruition by an “army” of scientific and technical staff members at Leiden University and, before that, at AMOLF, Amsterdam. Finally, we are indebted to G.J.C. van Baarle and his crew at Leiden Probe Microscopy B.V. (www.leidenprobemicroscopy.com) for teaming up with us in these endeavors and turning our prototypes into real products.

Joost W.M. Frenken is the director of the Advanced Research Center for Nanolithography and a professor of physics at the University of Amsterdam and the VU University Amsterdam, The Netherlands. His research interests focus on dynamic phenomena at surfaces and interfaces, including phase transitions, diffusion, nucleation and growth, catalysis and friction. He has developed several dedicated scanning probe and x-ray scattering instruments. He is a member of The Netherlands Academy of Arts and Sciences and co-founder of two companies. Frenken can be reached by phone at +31-20-8517100 or by email at frenken@arcnl.nl.

Irene M.N. Groot is an assistant professor in operando research in heterogeneous catalysis at the Leiden Institute of Chemistry, The Netherlands. Her current research focuses on unraveling the structure–performance relationships of model catalysts at the atomic scale under industrial conditions using advanced microscopy techniques. She investigates CO oxidation, NO reduction and oxidation, hydrodesulfurization, Fischer–Tropsch synthesis, and methanol steam reforming using operando scanning tunneling microscopy, surface x-ray diffraction, and optical microscopy. Groot can be reached by phone at +31-71-5277361 or by email at i.m.n.groot@lic.leidenuniv.nl.