INTRODUCTION
Globally, agricultural land use has been a leading cause of biodiversity loss, however the traditional view that agriculture is entirely incompatible with biodiversity conservation is increasingly being challenged (Tsharntke et al. Reference Tscharntke, Klein, Kruess, Steffan-Dewenter and Thies2005). Indeed in some cases the native wildlife continues to use the modified landscape after conversion of indigenous land cover to agricultural use (Daily et al. Reference Daily, Ceballos, Pacheco, Suzan and Sanchez-Azofeifa2003). The challenge therefore is to develop a framework for integrated management options and compromises based on scientific knowledge of the impacts of land use on wildlife distribution and abundance (Daily Reference Daily1999).
The protected areas (PAs) system has been the main vehicle for wildlife conservation in Kenya, but wildlife in some PAs moves out into the surrounding lands, referred to as dispersal areas or buffer zones, in characteristic seasonal patterns (Government of Kenya 1990). The present study was conducted in the semi-arid south-east Kajiado area, which is considered to be a dispersal area for wildlife of the Amboseli basin (Government of Kenya 1990). Kajiado is an important wildlife conservation area in Kenya because it encompasses some key Kenyan national parks, including Amboseli National Park, Nairobi National Park and Chyulu National Park. Although areas outside PAs are referred to as dispersal areas, in Kenya they often contain more wildlife than formal PAs (Western et al. Reference Western, Russell and Mutu2006). Dispersal areas play a critical role in minimizing the negative effects of PA insularization, such as local species extinction (Newmark Reference Newmark1996). Seasonal movement of animals out of the PAs minimizes competition and resource limitation within the PAs (Ottichilo et al. Reference Ottichilo, De Leeuw, Skidmore, Prins and Said2000). Movement of wildlife between habitats under different land uses is not restricted to large herbivores (for example moths; Ricketts et al. Reference Ricketts, Daily, Ehrlich and Fay2001).
Since 1975, land use changes have been rapid and widespread in Kenya (Serneels & Lambin Reference Serneels and Lambin2001). In Kajiado, changes have been due to pressures on traditional pastoralism, driven by: (1) reduction in grazing land, firstly to accommodate British settlers in the early 20th century and later through the demarcation of PAs, restricting access to dry-season grazing areas because PAs do not allow use by pastoralists (Grandin Reference Grandin, Bekure, de Leeuw, Grandin and Neate1991); (2) the sub-division of large communal ranches into smaller individually-owned parcels, which often fragment further as members sell off parts of their land (Kimani & Pickard Reference Kimani and Pickard1998); (3) human population pressure, which has risen steadily and has resulted in lower per person livestock holdings (Lamprey & Reid Reference Lamprey and Reid2004); and (4) declining trend in overall livestock population in the semi-arid areas in the country including our study area (Ottichilo et al. Reference Ottichilo, De Leeuw, Skidmore, Prins and Said2000).
Responses by pastoralists to these pressures have included increasingly sedentary grazing practices and diversification of livelihood through cultivation (Gradin 1991). In our study area and adjacent areas, increased cultivation has been mainly in the form of small farms around homesteads and irrigated fields along the Kilimanjaro-Mashuru water pipeline (Gradin 1991; Ogutu Reference Ogutu2002). Ecotourism is also a rapidly growing response for pastoral income diversification within communally-owned conservation areas.
The maintenance of multi-species wildlife assemblages is a key challenge to conservationists in areas without formal protection, such as those managed by local communities and used by both livestock and wildlife. The co-existence of multi-species herbivore assemblages in savannahs is facilitated by ecological separation due to differences in feed preference, physiological water requirements and movement between habitats (Lamprey Reference Lamprey1963). In dispersal areas, a number of factors can influence wildlife population and distribution, including diet site overlap with livestock leading to competition, and the density of humans and households (Hoare & Du Toit Reference Hoare and Du Toit1999; Voeten & Prins Reference Voeten and Prinns1999). The relationship of disturbance regimes, such as grazing intensity, cultivation and water points, and their associated effects on plant productivity and diversity may influence wildlife distribution (Verlinden Reference Verlinden1997; Serneels & Lambin Reference Serneels and Lambin2001). Predation is also an important factor that influences the distribution and abundance of wild herbivores and if combined with harvesting can drive herbivore populations towards extinction (Tambling & Du Toit Reference Tambling and Du Toit2005). The ‘bushmeat trade’, which involves hunting of wild herbivores to supply cheap meat to people in nearby villages and towns, has recently increased and is now considered a threat to wildlife (Pflanz Reference Pflanz2005; Okello & Kiringe Reference Okello and Kiringe2004).
Main government policies in the study area relate to the alleviation of poverty by agricultural intensification through improved crop and livestock production, and harnessing income from ecotourism (Government of Kenya 2003). Although the government is the key wildlife stakeholder given its management of the formal PAs, other stakeholders include private and local community conservancies outside the PAs (Ogutu Reference Ogutu2002). In the study area, important conservation concerns include encroachment of human settlements and livestock, agricultural expansion, loss of migration corridors, bushmeat hunting, poaching for international markets and fencing of protected areas (Okello & Kiringe Reference Okello and Kiringe2004).
The objectives of this study were to (1) compare overall wildlife density between land use types and (2) identify factors that influence distribution of wildlife in dispersal areas arising from land use (specifically intensity of cultivation, cattle density and density of households) and environment (specifically proximity to water sources, canopy cover and grass cover).
METHODS
Study area
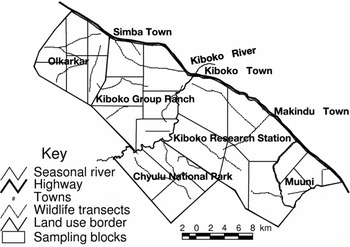
The study was conducted in the semi-arid Kiboko-Chyulu area of the Kajiado and Makueni districts (Fig. 1). The distribution of vegetation types in the study area is strongly influenced by soil types. Acacia and Commiphora woodlands dominate the ferralsols of Kiboko Range Research Station, Muuni and Kiboko Group Ranch. Balanites wooded grasslands occupy large areas of Olkarkar and Kiboko Group Ranch. Open grasslands are extensive over the volcanic plains of Chyulu National Park, while a dryland forest exists on the hilltops of the Chyulu Range (Touber Reference Touber1983). The main perennial grass species in the study area are Digitaria macroblephera, Chloris roxburghiana, Chyrosopogon aucheri and Pennisetum mezianum. Boreholes are the most important permanent sources of water with most being along the Mombasa-Nairobi highway, while the seasonal rivers Kiboko and Karugu are the main watercourses. Between 1999–2001 when data were collected and 2006 a number of changes in the area relating to issues investigated in this study have taken place. The number of households across the whole Kajiado District increased by 54% between 1994 and 2006, while the households that had cattle also increased from 46% to 56% of the total (Central Bureau of Statistics 1996; Kenya National Bureau of Statistics 2007a). Tourism was on an upward trend between 1999 and 2006, increasing by 54% nationally and by 99% in Amboseli National Park, which is adjacent to the study area (Kenya National Bureau of Statistics 2007b).
Diagrammatic map of the study area, land use units, sampling blocks and transects.

Data collection
Data were collected in December 1999 (wet season), November 2000 (dry season) and April 2001 (wet season). A stratified random sampling approach was used to collect data with grouping being based on land use type and vegetation type. Land use types included (1) conservation areas of Chyulu National Reserve and Kiboko Range Research Station, (2) small scale ranches in Olkarkar area, (3) small scale farms in Muuni and (4) the communal grazing area of Kiboko Group Ranch (Fig. 1). Vegetation types were grasslands, woodlands and bushland. Grasslands were land dominated by grasses and occasional herbs or groups of trees, woodlands supported a stand of trees with very little shrub cover and bushland consisted of both trees and shrubs, but dominated by shrubs.
To assess factors influencing wildlife distribution, land use factors, environmental attributes and wildlife density were assessed simultaneously using belt transects (Clarke Reference Clarke1986). To ensure representative spatial sampling, each study unit was divided into sampling blocks c. 20–50 km2 (Fig. 1). A total transect length of 30–40 km was applied to each land use unit and allocated equally among the blocks and vegetation types within them. A transect width of 400 m, 200 m and 100 m was used in grasslands, woodlands and bushlands, respectively, to account for the effect of reduced visibility (Clarke Reference Clarke1986). Motorable tracks in the study area are very few, hence disused cattle tracks that met the transect selection criteria were marked out on 1:50 000 topographic sheets and located on the ground using a global positioning system (GPS) handset. Since the cattle tracks were no longer in use, they had largely recovered from effects of erosion and vegetation degradation adjacent to them.
We counted from the roof of a four-wheel-drive vehicle, using a pair of binoculars to enhance detection, at 08:00–11:00 and 15:00–18:00, when animals are most active and visibility is good. To minimize inter-observer variation the same two observers collected on either side of the transect throughout the study. Data recorded in the belt transect included wildlife species and abundance, cattle abundance, and numbers of cultivated farms and households; ‘wildlife’ here refer exclusively to large herbivores. The traditional Maasai household (boma) usually consists of several families living together. In addition, we determined grass and woody cover qualitatively at 1 km intervals along the transect. We used a Braun-Blanquent scale (Clarke Reference Clarke1986) with five classes in the range of 0–100% to estimate cover. Cover estimates were averaged to obtain a transect mean.
Data analysis
We determined densities (number per km2) of animals, bomas and cultivated plots by transect using the formula N/2WL, where N is the observed number, W the transect width and L the transect length. Transect data were then summarized by vegetation type, land use type and season. To assess the relationship between land use and environmental factors, we used Spearman's rank correlation (Kent & Coker Reference Kent and Coker1992). To determine the variation in wildlife composition and habitat preference as influenced by land use and environmental factors we applied CCA (Kent & Coker Reference Kent and Coker1992), a direct gradient analysis technique that relates community variation (abundance and composition) to environmental variables. The main outputs of CCA include correlations of environmental variables to ordination axes which indicate the variables that were most influential in structuring the ordination. In the species-environment biplot, the points represent individual species and arrows represent environmental factors plotted in the direction of maximum change. A species near or beyond the tip of an arrow when a perpendicular line is drawn to it shows that it was positively correlated and influenced by the environmental variable. An alternative approach would have been separate regression analysis for each species, however CCA models are more readily implemented for many species at once. Two-way ANOVA was used to test the significance of differences in wildlife density between land use types and seasons.
RESULTS
Wildlife density and distribution
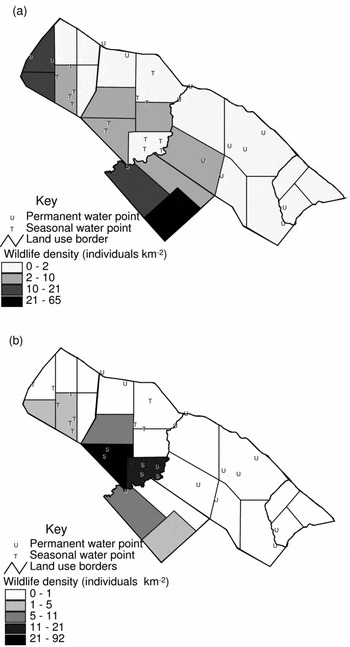
The average wildlife density in the study area was 12.5 individuals km−2, which is close to 1994–1997 aerial census data in the Kaptuei section (Githaiga Reference Githaiga1998) of the present study area. The zebra (Equus burchelli) accounted for the highest overall density followed by wildebeest (Cannochaeus taurinus), Grant's gazelle (Gazelle granti) and Thomson's gazelle (Gazella thomsonia). ANOVA showed wildlife density varied (F3,144 = 2.83; p = 0.04) between land use types. Kiboko Group Ranch had the highest mean wildlife density over the three seasons. Kiboko Range Research Station and Olkarkar small-scale ranches had wildlife densities of 1.7 and 4.6 individuals km−2, respectively, significantly (p < 0.05) lower than Kiboko Group Ranch and Chyulu National Park (19.7 and 11.6 individuals km−2, respectively). Muuni settlement had no wildlife at all.
ANOVA showed that wildlife density in the study area did not vary significantly (F2,144 = 0.104; p = 0.902) between seasons (10.6, 11.7 and 13.7 individuals km−2 in 1999, 2000 and 2001, respectively). However spatial distribution of wildlife within and between land use units in the wet season differed from that in the dry season (Fig. 2). When the whole study area was considered, wildlife density was highest during the dry season in Chyulu National Park and during the wet season on Kiboko Group Ranch. Wildlife density in the pastoral ranches was also higher in the wet season than in the dry season.
Spatial variation in wildlife density in (a) dry and (b) wet seasons.

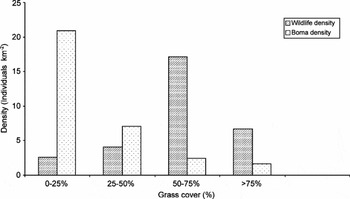
The pattern of wildlife distribution with grass cover (a proxy indicator of livestock grazing pressure; Mworia et al. Reference Mworia, Mnene, Musembi and Reid1997) when averaged over all seasons was dome shaped (Fig. 3). Wildlife density was lowest at 0–25% herbaceous cover and increased until 50–75%, then declined at > 75% herbaceous cover. In comparison, boma density declined monotonically with increasing grass cover (Fig. 3).
Variation in wildlife and boma densities in relation to the herbaceous cover.

Distribution and correlation between land use factors
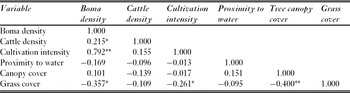
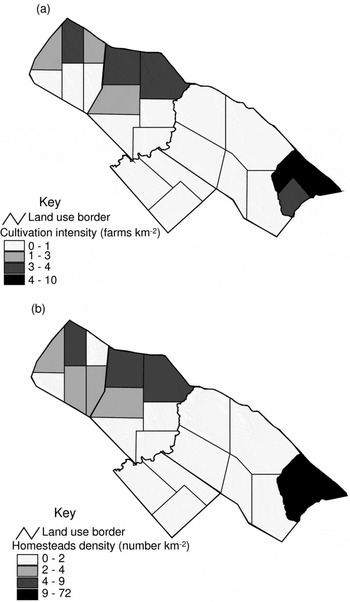
Density of bomas was most highly correlated with cultivation intensity (p < 0.01), the most heavily settled areas being also the most heavily cultivated (Table 1). Cultivation intensity and boma density were highest in the mixed farms of Muuni settlement and lowest in conservation and research units (Fig. 4). In pastoralist ranches (Olkarkar and Kiboko Group Ranches) there was dense settlement and cultivation along the Nairobi-Mombasa highway that decreased further away from the highway.
Spearman rank correlation coefficients between the land use factors. *p = 0.05, **p = 0.01.

Spatial variation in (a) cultivation intensity and (b) homesteads density in the study area.

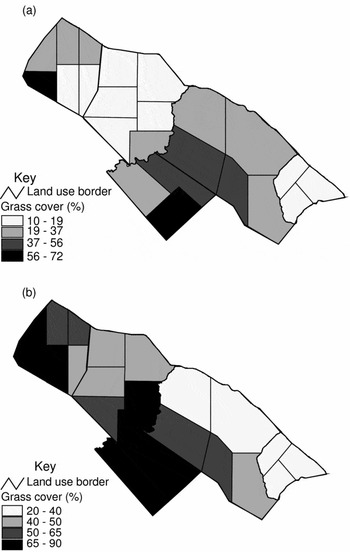
Grass cover was negatively correlated (p < 0.05) with canopy cover, boma density and cultivation intensity. Grass cover in the wet season was highest in areas of low cultivation and settlement (Fig. 5) far from the highway, with Chyulu National Park having the highest average cover in both seasons. The communal Kiboko Group Ranch and the agropastoral farms had the lowest cover in the dry season.
Spatial variation in grass cover (%) in the (a) dry season and (b) wet season.

Gradients influencing wildlife composition and distribution
Dry season
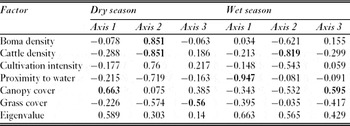
In the dry season, canopy cover, an indicator of vegetation type, was the most important factor influencing wildlife distribution (Table 2). Other important factors were boma density and cattle density, which had the highest correlation with the second axis and grass cover on the third axis.
Correlations of environmental variables with the first three ordination axes showing the influence of land use factors and cattle density on wildlife distribution. Factors with the highest correlation coefficients to each axis are shown in bold.
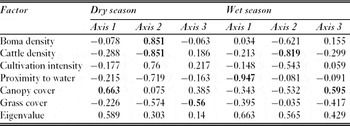
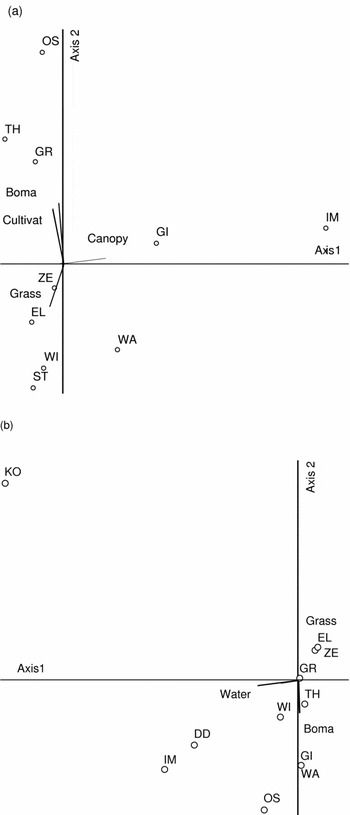
In the dry season, the first CCA biplot axis was characterized by increasing tree canopy cover and most species were in low woody cover areas on the left side of the graph (Fig. 6a). The giraffe (Giraffe camelopardalis) and the impala (Aepyceros melampus), which browse vegetation, were the exceptions, being found in the high woody canopy cover areas mainly in Kiboko Group Ranch.
CCA biplot showing the distribution of wildlife species as influenced by land use and environmental factors in (a) dry season and (b) wet season. EL = eland, GI = giraffe, GR = Grant's gazelle, IM = impala, KO = kongoni, OS = ostrich, TH = Thomson's gazelle, WA = warthog and WI = wildebeest. Boma = boma density, Cultivat = cultivation intensity, Grass = grass cover (%), Water = distance to water source and Canopy = woody species canopy cover.

Boma density and cultivation intensity increased along the second biplot axis while grass cover declined (Fig. 6a). The most highly cultivated areas with high boma density fall in the upper left quarter of the biplot and include Olkarkar and parts of Kiboko Group Ranch. These areas had low grass cover and were occupied by small herbivores, including Thomson's gazelle, ostrich (Struthop camelus) and Grant's gazelle. Sites with high grass cover and relatively low boma density and cultivation intensity were mainly in Chyulu National Park and occupied by large-bodied herbivores, including eland (Taurotragus oryx), wildebeest and zebra.
Wet season
In the wet season, the proximity to water sources was the factor most influencing wildlife species distribution (Table 2). Other important factors were cattle density and canopy cover on the second and third axes, respectively.
In the wet season biplot (Fig. 6b), distance to water sources decreased along the first axis, while grass cover increased and cattle density decreased along the second axis. Most of the wildlife species were close to water sources. Eland, zebra, Grant's gazelle and Thomson's gazelle were abundant mainly in Kiboko Group Ranch in areas characterized by high grass cover and low boma density. Species in areas of high boma density and low grass cover, mainly in Olkarkar and parts of Kiboko Group Ranch, included the ostrich, dik-dik (Rhynchotragus kirkii), impala, giraffe and warthog (Phacochoerus aethiopicus) (Fig. 6b).
DISCUSSION
Distribution patterns in wildlife, bomas, cultivation and water sources
The study identified three patterns of wildlife distribution between land use types, between seasons, and along the grass cover gradient. In terms of land use, wildlife density was significantly lower in the sub-divided Olkarkar ranches and Muuni settlement scheme. Muuni is heavily settled, cultivated and fenced which explains the lack of wildlife. Disaggregating of bomas leading to increase in boma density following sub-division (Gradin 1991; Kimani & Pickard Reference Kimani and Pickard1998) may have been one of the factors lowering wildlife density in the Olkarkar small-scale ranches, which had an average of 3.8 bomas km−2 as compared to the communal Kiboko Group Ranch, which had 2.6 bomas km−2.
The seasonal distribution manifested by wildlife using Chyulu National Park in the dry season and Maasai ranches in the wet season may be explained by the greater altitude, rainfall and productivity in Chyulu (Touber Reference Touber1983), while the lowland Maasai ranches have plenty of wet season water pans, which Chyulu lacks.
Distribution of wildlife along the grass cover gradient displayed a dome-shaped relationship. Such dome-shaped models have been reported for plant diversity-productivity-disturbance relationships and species richness-grass cover relationships (Allcock et al. Reference Allcock and Hik2003; Oba et al. Reference Oba, Vetaas and Stenseth2001) however, they are still poorly understood (Rajaniemi Reference Rajaniemi2003). In this study the grass cover gradient is probably linked to a disturbance gradient, given that in semi-arid grazing lands it coincides with grazing intensity (Mworia et al. Reference Mworia, Mnene, Musembi and Reid1997). Disturbance affects wildlife distribution especially at concentration points such as water pans (Bergstrom & Skarpe Reference Bergstrom and Skarpe1999). The relationship we observed could be due to changes along the grass cover gradient, such as feed quantity and quality, species richness and proximity to water sources, all of which affect wildlife species distribution (Lamprey Reference Lamprey1963). Although our study obtained a dome-shaped relationship between wildlife distribution and disturbance, alternative explanations are possible. The section of the model with high wildlife density can be explained by humans selecting nutrient-rich areas for livestock, agriculture and settlement, as do wildlife for grazing (Olff et al. Reference Olff, Ritchie and Prins2002). Such areas tend to be disturbed, and a high wildlife density there may not be a consequence of active selection of disturbed areas. Also the low wildlife density observed at the lowest disturbance levels characterized by high grass cover could be explained by a predator avoidance strategy by herbivores; predators have been observed to spend more time in areas with high prey ‘catchability’ such as long grass rather than those with high prey density (Hopcraft et al. Reference Hopcraft, Sinclair and Packer2005). Our study cannot fully explain the dome-shaped model.
The density of bomas was positively correlated with cultivation intensity and both were negatively correlated with grass cover, an indication of the effects of high livestock concentration and loss in grass cover due to cultivation around bomas. The high concentration of bomas adjacent to the Mombasa-Nairobi highway is due to better access to amenities such as schools, hospitals and permanent water sources, which are in towns along the highway. Similar patterns of boma concentration around permanent water points have been observed by others (Lamprey & Reid Reference Lamprey and Reid2004).
Factors influencing wildlife distribution
The primary gradient influencing wildlife species distribution in the dry season was vegetation type, and the CCA biplot showed clear separation of species based on body size and feeding category. This may be related to observations from previous studies that firstly, increasing rainfall reduces nutrient content of plants but increases productivity and secondly, larger herbivores use areas of higher grass biomass but of lower quality while smaller ones select drier areas with lower biomass but higher quality (Olff et al. Reference Olff, Ritchie and Prins2002; Voeten & Prins Reference Voeten and Prinns1999). This may explain our observations that in dry season large-bodied grazers preferred the high grass biomass of lower quality in Chyulu, while smaller herbivores remained in the low grass cover/biomass of the pastoral ranches. In the wet season CCA identified proximity to water sources as the most important factor. In Chyulu, seasonal water holes were not observed due to the porous nature of the volcanic soils there. The analysis identified proximity to seasonal water sources as an important factor in the wet season because wildlife moved from Chyulu, which did not have ephemeral water sources, to the pastoral ranches, which had many. Although we identified seasonal water sources as an important factor, this may not be biologically very important since water availability is most critical in the dry season.
In both seasons, cattle density was the most important secondary factor determining wildlife species distribution. Cattle probably modify wildlife distribution due to overlap in resource (such as food and water) use which occurs during seasons of limitation (Voeten & Prins Reference Voeten and Prinns1999). Boma density was just as important as cattle density in the dry season. Indeed, Lamprey and Reid (Reference Lamprey and Reid2004) observed wildlife to decline significantly in areas with > 0.5 bomas km−2 in the Maasai Mara. However, the relationship between wildlife density and boma or human density is not clear. Parker and Graham (Reference Parker and Graham1989) found a negative linear relationship, while Hoare and Du Toit (Reference Hoare and Du Toit1999) reported wildlife to disappear beyond a certain threshold of human density. In our study, wildlife density increased with decreasing boma density only to a certain point, after which it also declined.
In the analysis of factors influencing wildlife distribution, intensity of cultivation was not among the main land-use factors in both seasons. We conclude that small-scale cultivation in the pastoral ranches was not as important as cattle density and boma density in influencing wildlife distribution. This supports observations that only large-scale cover changes, which significantly reduce the proportion of non-cropped land arising from activities such as mechanized agriculture, lead to decline in resident wildlife (Serneels & Lambin Reference Serneels and Lambin2001). We recognize that several factors that can strongly influence wildlife distribution and individual populations (such poaching, predation and competitive interactions) were not included in this study.
CONCLUSIONS AND RECOMMENDATIONS
Seasonal wildlife movement patterns such as between Chyulu National Park and the pastoral ranches persist, despite emergence of differing land management types. This interdependence calls for an integrated conservation approach by wildlife stakeholders that considers wildlife movement patterns and vegetation-type diversity. Principal wildlife management stakeholders in the area include the local community, private conservancies, non-governmental organizations and government. Alhough there are various possible explanations for the highest wildlife density occurring at moderate levels of disturbance and boma density, observation supports the viability of ecotourism in dispersal areas. However, effects of high cattle density, boma density and intense cultivation on wildlife distribution call for land use zonation to minimize impacts. There was no official land use zonation policy, however the areas of human settlement (mainly the pastoral ranches) could be distinguished from the non-settlement areas consisting of formal PAs and private conservancies. We deduce that simultaneous pursuance of certain development policies conflict and may not promote wildlife integrity in dispersal areas. For example, ecotourism is encouraged in the Economic Recovery Strategy (Government of Kenya 2003) to alleviate rampant poverty, while dryland agriculture is also encouraged to diversify income and ensure food security (Government of Kenya 2001). The present study showed that cultivation and wildlife may conflict. Where potential conflict arises, economic incentives through sustainable projects can encourage the local community to favour biodiversity conservation, as in the Porini Ecotourism Project in the study area, which allows the local community of Esenlekei to earn and gain employment (Ogutu Reference Ogutu2002).
ACKNOWLEDGEMENTS
We are grateful for the financial support received from the Trapnell Fund through Oxford University, the Global Livestock Collaborative Research Programme through Colorado State University and the African Academy of Sciences. We thank the Maasai community and Muuni farmers for supporting the study.