I. INTRODUCTION
The development of efficient energy storage systems is an emerging requirement to meet the needs of modern society and ecological concerns. Reference Huang, Liang and Chen1–Reference Zhao, Sanchez, Dobson and Grant3 Lithium-ion batteries have been receiving worldwide attention due to their unique characteristics in terms of high energy density and long cycle life. However, energy density and rate capability of current generation lithium-ion batteries are limited by traditional electrode materials. Reference Gwon, Hong, Kim, Seo, Jeon and Kang4–Reference Armstrong, O′Dwyer, Macklin and Holmes6 In recent years, transition metal oxides have been regarded as high capacity anode materials, which may have potential application in future lithium-ion battery systems. Reference Gu and Schuth7–Reference Kim, Seo, Ma, Ceder and Kang13
As one of the transition metal oxide anode materials, nickel oxide (NiO) has recently been investigated as an anode for lithium-ion batteries due to its high theoretical capacity (718 mAh g−1), low toxicity, ease of fabrication, and low cost. Reference Reddy, Rao and Chowdari14 However, like other transition metal oxides, large volume change and severe particle aggregation commonly lead to NiO electrode pulverization and loss of inter-particle contact, resulting in a rapid capacity fading and poor cycling stability during repeated discharge–charge process. For the past several years, several efforts have been made to alleviate these intrinsic problems. Reference Zhong, Chae, Shi, Fan, Mi and Oh15–Reference Qiao, Wang, Qiao, Sun, Li, Zheng and He17 Because the capacity of NiO is generally concerned with their structures, designing the architectures of NiO with controlled shapes in micro/nano-size is regarded as an effective way to improve its lithium storage property.
As one of the nanoscale building blocks, nanoplatelet opens a new pathway toward realization of advanced electrode for lithium-ion batteries in modern materials chemistry and nanotechnology recently. Reference Wei, Zeng, Sun, Huang and Huang18–Reference Wang and Rogach21 Because of the unique structure, those materials constructed by nanoplatelet units usually possess large electrochemical active surface area, high utilization efficiency of the active materials, and super mass transport property. Inspired by this, in this manuscript, two NiO nanoplatelet-based materials with different dimensionality (two/three-dimension) were synthesized and fabricated as electrodes. Their electrochemical performance as anode materials for lithium-ion batteries was evaluated and compared.
II. EXPERIMENTAL
A. Synthesis of NiO nanoplatelet-based materials
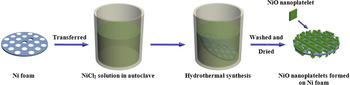
Synthesis of NiO nanoplatelets: 3 mmol NiCl2·6H2O, 15 mmol CO(NH2)2, and 6 mmol NH4F were first dissolved in 30 mL distilled water. The mixture was stirred in air at room temperature for 10 min to yield a homogenous solution with light green color. The solution was transferred into a 50 mL Teflon-lined stainless autoclave. Subsequently, a Ni foam wafer (16 mm in diameter and 1 mm in thickness) was put into the solution. The autoclave was then tightly sealed and left in an oven at 120 °C for 4 h. Once the reaction was over, the Ni foam wafer was taken out by a pincet and washed with distilled water and ethanol for 10 times, and then dried in a vacuum oven at 60 °C for 12 h. The NiO nanoplatelets thus were obtained. The representative synthetic procedure of the sample is illustrated in Fig. 1.
Schematic illustration of the synthesis process of NiO nanoplatelets on Ni foam.

Synthesis of NiO microspheres composed by nanoplatelets: 3 mmol NiCl2·6H2O, 15 mmol CO(NH2)2, and 6 mmol NH4F were first dissolved in 30 mL distilled water. The mixture was stirred in air at room temperature for 10 min to yield a homogenous solution with light green color. The solution was transferred into a 50 mL Teflon-lined stainless autoclave. The autoclave was then tightly sealed and left in an oven at 120 °C for 4 h. The resulting powder was centrifuged, rinsed with ethanol, and then dried in a vacuum oven at 60 °C for 10 h.
B. Material characterization
Powder x-ray diffraction (XRD) patterns of samples were recorded by a Bruker D8 ADVANCE x-ray powder diffractometer (Bruker Corporation, Billerica, MA) using Cu Kα radiation (λ = 0.15418 nm) at a scanning rate of 0.02° s−1 in the 2θ range from 20 to 70°. Scanning electron microscopy (SEM) images of samples were measured by a FEI Quanta 400 ESEM-FEG (FEI Company, Hillsboro, OR) (environmental scanning electron microscope-field emission gun) instrument with an accelerating voltage of 20 kV. Transmission electron microscopy (TEM), high-resolution transmission electron microscopy (HRTEM), and fast Fourier transform (FFT) results of the samples were obtained on a JEOL JEM-3010 (JEOL, Tokyo, Japan) instrument with an accelerating voltage of 200 kV.
C. Electrochemical measurements
Electrochemical measurements were performed at 25 °C using coin cells (CR2025) with pure lithium foil as the counter and reference electrode. For the NiO microspheres, they were mixed with acetylene black and polytetrafluoroethylene in a weight ratio of 80:10:10, and then pasted on Ni foam wafer (16 mm in diameter and 1 mm in thickness). After dried in a vacuum oven at 100 °C over 12 h, the NiO microsphere electrode was thus obtained. But for the NiO nanoplatelets grown on Ni foam wafer, it was used directly as the working electrode for cell assembly, and other ancillary materials such as binders or conductive additives were not required. Cells were constructed in a glove box in argon atmosphere under a dew point below −65°. The electrolyte was 1 M LiPF6 dissolved in a mixture of dimethyl carbonate, diethyl carbonate, and ethylene carbonate (1:1:1 by volume), and the separator was microporous polypropylene film. The charge–discharge tests were carried out on a LAND battery program-control test system in a cut-off potential window of 0–3.0 V. Cyclic voltammetry (CV) was carried out on a CHI 660D electrochemical workstation at a scan rate of 0.1 mV s−1 in the potential range of 0–3.0 V versus Li/Li+. Electrochemical impedance spectroscopy (EIS) was measured by using the same electrochemical workstation with the frequency range from 0.01 to 100 kHz.
III. RESULTS AND DISCUSSION
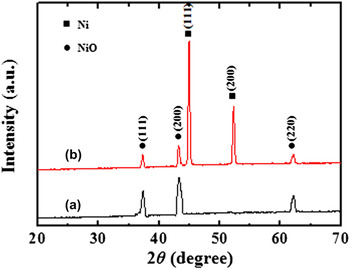
XRD measurements were carried out to study the crystal structure and phase purity of the obtained products (Fig. 2). As can be seen in Fig. 2(a), the NiO microspheres show well-resolved diffraction peaks at 37.3, 43.3, and 62.8°, which are in good agreement with the (111), (200), and (220) reflections of the face-centered cubic NiO with the lattice constant of α = 4.188 Å (JCPDS No. 47-1049). For the NiO nanoplatelets grown on Ni foam sample, it can be seen from Fig. 2(b) that five peaks appeared. Besides two strong peaks from the Ni foam substrate, the sample shows the same diffraction peaks of the NiO phase as the NiO microspheres. No additional peaks other than Ni are observed in the sample, indicating the high purity of the product.
XRD patterns of (a) NiO microspheres and (b) NiO nanoplatelets grown on Ni foam.

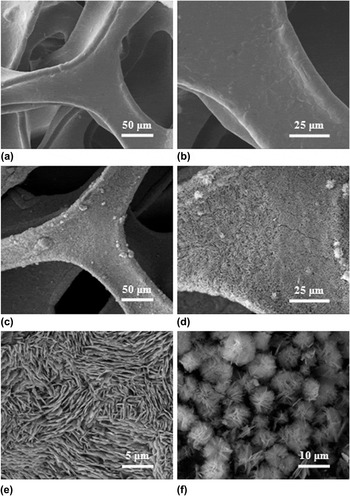
Figure 3 displays SEM images of Ni foam before and after NiO nanoplatelets formed, together with the SEM images of NiO microspheres synthesized without the use of Ni foam. Low magnification image in Fig. 3(a) suggests that the Ni foam with 3D framework was constructed by plenty of Ni belts with smooth surface, which could play the role of an electronic conductive path. A delineation of grain boundaries can be seen in higher magnification SEM image [Fig. 3(b)]. Figures 3(c)–3(e) show the gradually magnified SEM images of the Ni foam after NiO nanoplatelets formed. Clearly, the skeletons of Ni foam were completely covered by nanoplatelets, which grow densely and almost vertically from the substrate. These appearing nanoplatelets had a length of 5–10 μm and a uniform thickness of ∼100 nm. Such a phenomenon indicates that the layered structure of NiO has grown successfully on Ni foam. However, without the Ni foam as the substrate, it can be seen from Fig. 3(f) that the formed nanoplatelets were assembled during hydrothermal process roughly in spherical shapes of 5–10 μm with random stacking direction. This is because the nanoplatelet units often possess high surface free energy, they tend to stack together and form a sphere structure to minimize the total energy of the system when no template is used to confine their growth direction. Reference Wang, Wang, Bai, Ren and Bai22,Reference Cao, Hu, Zhou, Shi, Song, Lei, Wang and Zhang23
(a, b) SEM images of Ni foam with gradually enlarged magnification, (c–e) SEM images of NiO nanoplatelets grown on Ni foam with gradually enlarged magnification, and (f) SEM image of NiO microspheres.

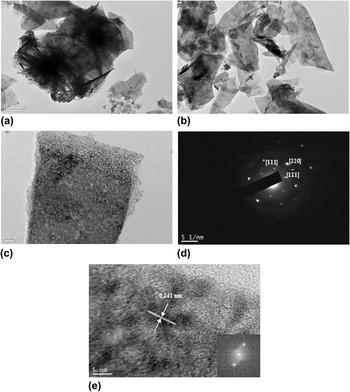
To investigate the detailed structure of the synthesized NiO nanoplatelets, TEM imaging, selected area electron diffraction (SAED), and FFT analysis were used. To realize the TEM characterization, NiO microspheres were used directly for TEM observation, while NiO nanoplatelets grown on Ni foam were sonicated for 1 h to peel the platelets off from the substrate. Figure 4(a) shows a typical TEM image of the NiO microspheres; it can be clearly seen that each microsphere is composed of many aggregated nanoplatelets. Such a phenomenon is consistent with the SEM result of Fig. 3(f). Figure 4(b) shows a TEM image of the NiO nanoplatelets which are peeled off from the Ni foam. Although the sample has been destroyed to some extent by the sonication process, it can be seen that the appearance of the platelet-like morphology was maintained on the whole. Higher magnification TEM image in Fig. 4(c) suggests that the nanoplatelet consists of quasi-continuous nanoparticles of ∼5 nm in size. SAED pattern of the nanoparticles in Fig. 4(d) implies that these particles are single crystalline in nature. Reference Srivastava and Srivastava24 The HRTEM image in Fig. 4(e) gives clear observation of these nanoparticles. It reveals one interplanar spacing of 0.241 nm, corresponding to (111) lattice plane of the face-centered cubic phase NiO. Reference Cui, Wang, Wu, Liu, Zhang and Wang25 The highly clear crystal lattice as well as the corresponding well-ordered dot pattern of the FFT image demonstrates the high-quality single-crystalline nature of the NiO nanoplatelets.
TEM images of (a) NiO microspheres and (b) NiO nanoplatlets synthesized on Ni foam, (c) Higher magnification TEM image of a NiO nanoplatelet obtained from (b), (d) SAED pattern of the NiO nanoplatelet in (c), and (e) HRTEM image of an edge of NiO nanoplatelet in (c).

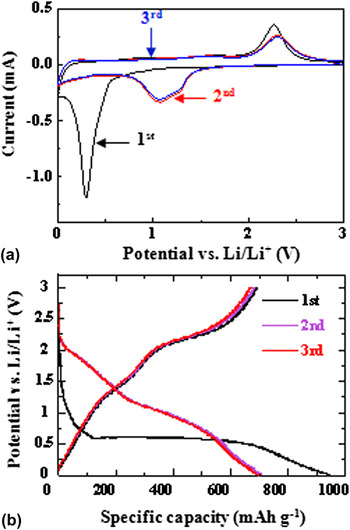
The electrochemical reactions of the two nanoplatelet-based materials as anode materials for lithium-ion batteries were examined by CV measurements and discharge–charge tests. Because the CV results (the discharge–charge profiles) of the two electrodes are similar to each other, the CV curves and discharge–charge profiles of the NiO nanoplatelet electrode at the first three cycles are chosen to display (Fig. 5). It can be seen from the CV results in Fig. 5(a) that there are significant differences between the first and the other two cathodic scans. There is a strong reduction peak at around 0.3 V versus Li/Li+ in the first cathodic scan, corresponding to the decomposition of NiO into Ni (NiO + 2Li → Ni + Li2O), and the formation of solid electrolyte interface (SEI) layer. Due to the drastic lithium driven and activation of the electrode, the reduction peak becomes broader and weaker, and shifts to about 1.1 V at the second scan. The three anodic scans are nearly the same, and two oxidation peaks are found at 1.6 and 2.3 V. The weak peak at 1.6 V should correspond to the dissolution of the SEI layer, and the strong peak at 2.3 V can be assigned to the reaction Ni + Li2O → NiO + 2Li. Moreover, it is obvious that the peak intensity drops significantly in the second cycle, indicating the occurrence of some irreversible reactions associated with the SEI formation. Figure 5(b) shows the first three charge–discharge profiles of the NiO nanoplatelet electrode at a current density of 250 mA g−1. In the first discharge, the electrode shows a wide voltage plateau at about 0.5 V followed by a sloping curve. It is worth noting that the voltage plateau appeared in the first discharge process is higher than the location of the reduction peak in the CV tests of the first scanning cycle. Such a result is ascribed to the polarization effect on the electrode. In the subsequent discharge process, the plateau shifts to ∼1.1 V, while two charge plateaus are kept at ∼1.6 and 2.3 V, which are in agreement with the CV results. Additionally, the nearly overlapped curves at the second and the third cycle indicate that the electrode materials are stable during the cycling process.
The first three (a) CV curves of NiO nanoplatelet electrode at a scan rate of 0.1 mV s−1 and (b) discharge–charge curves of NiO nanoplatelet electrode at a current density of 250 mA g−1.

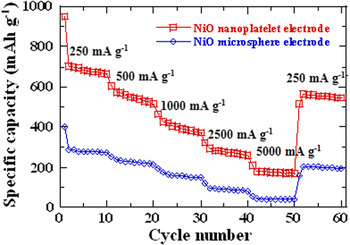
To evaluate the lithium storage properties of as-prepared electrodes with nanoplatelets and microspheres for lithium-ion batteries, discharge–charge tests under different current densities were carried out in the voltage range of 0–3.0 V. A comparison of the rate test result of the two electrodes is shown in Fig. 6. As can be seen in the figure, after the electrodes cycled at 250 mA g−1 for 10 cycles, the applied current densities were increased stepwise to 5000 mA g−1. The discharge capacities of the NiO microparticle electrode are 271 (10th cycle), 215 (20th cycle), 147 (30th cycle), 81 (40th cycle), and 38 mAh g−1 (50th cycle) at current densities of 250, 500, 1000, 2500, and 5000 mA g−1, respectively, while the capacities of the NiO nanoplatelet electrode are 663, 516, 370, 258, and 169 mAh g−1 at the same current densities. Apparently, these specific capacity values of the NiO nanoplatelet electrode are much higher than the NiO microsphere electrode.
Rate capability of NiO nanoplatelet and microsphere electrode at various current densities.

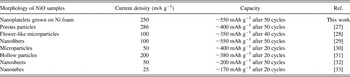
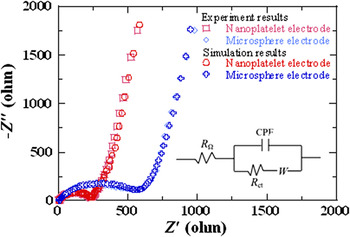
Based on the above electrochemical investigations on the NiO electrode, it is found that our prepared Ni foam supported NiO nanoplatelet electrode exhibited higher lithium storage performance than those of previously reported NiO electrodes of various morphologies (Table I). It is possible to explain the excellent rate capability of the nanoplatelet electrode resulting from the enhanced electrochemical reactivity based on the simulated illustration in Fig. 7. Compared with the microsphere electrode [Figs. 7(b) and 7(b′)], the interlayer spacing between each two platelets in the nanoplatelet electrode [Figs. 7(a) and 7(a′)] can easily be filled with electrolyte, thus ensuring a large reaction surface area and inner space being in contact with the electrolyte. Reference Li, Li, Wei, Shang and He26 Moreover, the interlayer spacing existed in nanoplatelet electrode can serve as buffer spaces to relieve volume expansion during lithium intercalation process. And hence the nanoplatelets could provide more active sites for electrochemical reactions in mild volume change circumstance than the microspheres. Such structural characteristics would also lead to faster ion/electron transfer, which could be further confirmed by the EIS results. The Nyquist plots of the two electrodes after the rate tests, as well as the fitting results using an equivalent circuit, are shown in Fig. 8. In the equivalent circuit (inset), R Ω and R ct are the ohmic resistance (total resistance of the electrolyte, separator, and electrical contacts) and charge-transfer resistance, respectively. CPA is the constant phase-angle, involving double layer capacitance, and W represents the Warburg impedance reflecting the solid-state diffusion of lithium ion into the bulk of the active materials. It can be seen clearly that the R ct is much smaller for the nanoplatelet electrode (R ct = 245) than for the microsphere electrode (R ct = 575), which indicates that the former could enable a much easier charge transfer at the electrode/electrolyte interface and consequently, decreasing the overall battery internal resistance.
Lithium storage performance comparison of NiO electrodes with various morphologies.

Simulated illustration of vertical and cross-sectional view for a fraction of NiO (a, a′) nanoplatelet and (b, b′) microsphere electrodes.

Nyquist plots for the NiO nanoplatelet and microsphere electrodes after the rate tests. The inset is the equivalent circuit for plot fitting.

IV. CONCLUSIONS
NiO nanoplatelet-based materials were successfully synthesized by a facile hydrothermal route. The preparation results indicated that the nanoplatelet units tended to stack together and form a sphere structure when no template is added to confine their growth direction. NiO nanoplatelets grown on Ni foam have a length of 5–10 μm and a uniform thickness of ∼100 nm; NiO microspheres composed by nanoplatelets have a diameter of 5–10 μm. Their electrochemical performance as anode materials for lithium-ion batteries was tested. The lithium storage property investigation revealed that the NiO nanoplatelet electrode exhibited better rate capabilities than the NiO microsphere electrode. The enhanced electrochemical performance for the NiO nanoplatelet electrode can be attributed to the direct formation of an uniform layered structure on Ni form, which provides more active sites for electrochemical reactions and facilitates faster ion/electron transfer.
ACKNOWLEDGMENTS
This work was financially supported by the National Natural Science Foundation of China (Nos. 21301140 and 21061130551), and the Natural Science Foundation of Shaanxi Province (No. 2013JQ2004).