Introduction
Chrome-rich spinel has long been proposed as an indicator mineral for petrogenetic processes in magmatism (MacGregor and Smith, Reference MacGregor and Smith1963; Irvine, Reference Irvine1965; Reference Irvine1967). As an early crystallizing phase in most primitive basaltic magmas, it can provide insights into the history of emplacement, crystallization and cooling of such magmas. However, although typically resisting complete breakdown, chrome-spinel can be subject to many types of chemical and textural modification after initial crystallization, both by reaction between later crystallizing phases and liquids (Irvine, Reference Irvine1967; Henderson, Reference Henderson1975; Roeder and Campbell, Reference Roeder and Campbell1985), and during subsolidus cooling of its host rock (Wilson, Reference Wilson1982; Scowen et al., Reference Scowen, Roeder and Helz1991). Careful recording of compositional variation of chrome-spinels with respect to grain size, texture, mineral host and internal structures can reveal parameters such as emplacement mechanism, fractionation type and cooling rate. For example, compositional zoning of cations in chrome-spinel and adjacent silicate minerals can be used to estimate post-emplacement cooling rates in larger intrusions (Wilson, Reference Wilson1982), or the influence of kinetic factors in the growth of crystals in basaltic lavas (Roeder et al., Reference Roeder, Poustovetov and Oskarsson2001). The degree of zoning, and the presence of differential zoning of cations of varying charge and ionic radius can aid in quantifying these parameters (Bouvet de Maisonneuve et al., Reference Bouvet de Maisonneuve, Costa, Huber, Vonlanthen, Bachmann and Dungan2016).
This study is presented as a case history in the elucidation of the late magmatic history of a group of small Ni-sulfide mineralized mafic-ultramafic intrusions. It seeks to explain the origin of unusual normal and reverse zoning of magmatic-textured chrome-spinel grains, to thus deduce cooling rates and the processes that have modified the primary magma. Such zoning needs to be documented and understood before using chrome-spinel compositions as indicators of high-temperature igneous processes (Dick and Bullen, Reference Dick and Bullen1984; Peltonen, Reference Peltonen1995)
Regional geology
The Kabanga intrusions are located within the Karagwe-Ankole Belt in northwest Tanzania. The Karagwe-Ankole Belt and its associated igneous activity have been described recently by Tack et al. (Reference Tack, Wingate, de Waele, Meert, Belousova, Griffin, Tahon and Fernandez-Alonso2010) and Fernandez-Alonso et al. (Reference Fernandez-Alonso, Cutten, de Waele, Tack, Tahon, Baudet and Barritt2012). The Karagwe-Ankole Belt is defined as a belt of Palaeo- to Mesoproterozoic metasediments (the Kagera and Akanyaru Supergroups) overlying Archaean to Palaeoproterozoic basement rocks (Fernandez-Alonso et al., Reference Fernandez-Alonso, Cutten, de Waele, Tack, Tahon, Baudet and Barritt2012). The metasediments and their basement have been intruded by a bimodal suite of intrusions with radiometric age determination of 1360 Ma to 1400 Ma (Tack et al., Reference Tack, Wingate, de Waele, Meert, Belousova, Griffin, Tahon and Fernandez-Alonso2010). These Mesoproterozoic intrusions are dominated by peraluminous (‘S-type’) granites which are widespread within the Akanyaru Supergroup rocks of the western part of the belt, but that are absent within the Kagera Supergroup to the east. A chain of mafic to ultramafic layered intrusions and minor intrusions of the same age, of which the Kabanga intrusions are examples, are situated along the transitional domain between the Akanyaru and Kagera Supergroups (Fernandez-Alonso et al., Reference Fernandez-Alonso, Cutten, de Waele, Tack, Tahon, Baudet and Barritt2012). The emplacement of the Mesoproterozoic bimodal suite into the metasedimentary rocks has given rise to a major thermal metamorphic event resulting in localized greenschist to amphibolite-facies aureoles around both felsic and mafic plutons (Sintubin, Reference Sintubin1989; Tack and Deblond, Reference Tack and Deblond1990).
Both sediments and intrusions have been subsequently folded into upright non-cylindrical folds trending NE–SW in the southern part of the belt (Klerkx et al., Reference Klerkx, Liegeois, Lavreau, Claessens and Kroner1987). Greenschist facies regional metamorphism associated with this deformation has been dated by Koegelenberg et al. (Reference Koegelenberg, Kisters, Kramers and Frei2015) at 1326 Ma. A late phase of largely N–S trending transcurrent faulting associated with localized fluid-rich greenschist-facies alteration cuts the Mesoproterozoic igneous rocks as well as tin-bearing granites dated at 986 Ma and alkaline complexes dated at ~780 Ma (Tack, Reference Tack1990; Tack et al., Reference Tack, Wingate, de Waele, Meert, Belousova, Griffin, Tahon and Fernandez-Alonso2010). In spite of their pre-tectonic emplacement, the mafic-ultramafic intrusions have largely preserved their igneous textures and mineralogy, by a process of strain and fluid partitioning around their margins (Maier et al., Reference Maier, Barnes, Sarkar, Ripley, Li and Livesey2010).
Detailed descriptions of the Kabanga mafic-ultramafic intrusions and their mineralization have been given by Maier et al. (Reference Maier, Barnes, Sarkar, Ripley, Li and Livesey2010) and Maier and Barnes (Reference Maier and Barnes2010). The intrusions comprise a group of small, rounded to elongate bodies dominated by peridotite, pyroxenite and olivine norite (olivine-orthopyroxene-chromite ortho- to mesocumulate rocks). Maier et al. (Reference Maier, Barnes, Sarkar, Ripley, Li and Livesey2010) interpret these bodies as chonoliths (irregular tube-like magma flow-through channels) connecting different staging chambers. They infer that the intrusions formed from a picritic precursor melt that assimilated up to 30% crustal material (mainly metasediments) during its emplacement into the crust. This resulted in cumulates in which olivine-chromite on the liquidus was followed by orthopyroxene, and which show strong crustal contamination signatures in incompatible trace elements and in both stable and radiogenic isotope systems. An important result of the abundant crustal contamination has been the formation of significant nickel sulfide mineralization within and at the lower contact of the chonolith bodies (Evans et al., Reference Evans, Byemelwa and Gilligan1999, Maier and Barnes, Reference Maier and Barnes2010).
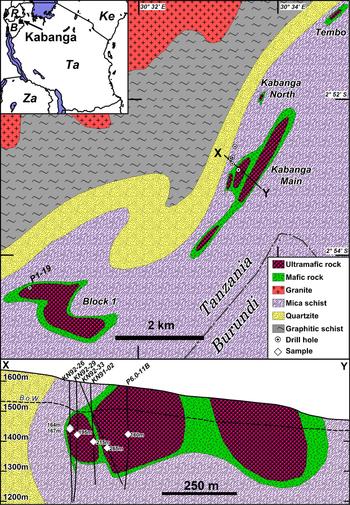
There are several intrusive bodies at Kabanga that outcrop very poorly, but that are delineated well by intense aeromagnetic anomalies and soil geochemistry. They are all located on the southeast side of a major regional anticline that is cored by an S-type granite and they intrude weakly sulfidic mica schists (Fig. 1). Exploration drilling of the intrusions indicates that they have a highly elongate shape and plunge to the north. The southernmost Block 1 intrusion is roughly two to three times the size (1 to 2 km across) of the other intrusions, which are narrower, thinner (0.3 to 0.6 km across) and more richly mineralized. The intrusions are concentrically zoned from (olivine) gabbronoritic margins (typically containing quartzitic xenoliths and hybrid quartz norite zones) to peridotitic and orthopyroxenitic cumulate-textured interiors (Maier et al., Reference Maier, Barnes, Sarkar, Ripley, Li and Livesey2010). The cumulate rocks are poorly to moderately banded, and this banding is generally parallel to the bedding of the enclosing metasedimentary rocks (Evans et al., Reference Evans, Boadi, Byemelwa, Gilligan, Kabete and Marcet2000). Chrome-spinel (hereafter referred to as chromite) is present in accessory amounts (1–2 modal %) in all olivine-bearing rocks but is absent in pure pyroxenites and gabbronorites. No chromitite bands or other concentrations of chromite above ~2 modal% have been observed in the Kabanga intrusions.
Geological sketch map of the Kabanga intrusions (after Evans et al., Reference Evans, Byemelwa and Gilligan1999 and Maier et al., Reference Maier, Barnes, Sarkar, Ripley, Li and Livesey2010), showing location of drill holes used in the study and the position of cross-section X–Y. Upper inset: Location of Kabanga in Tanzania (Ta) and neighbouring countries. B = Burundi, R = Rwanda, Ke = Kenya, Za = Zambia. Lower inset: cross section X–Y showing location of samples on projected drill hole traces (B.o.W is base of weathering).

Previous petrographical observations
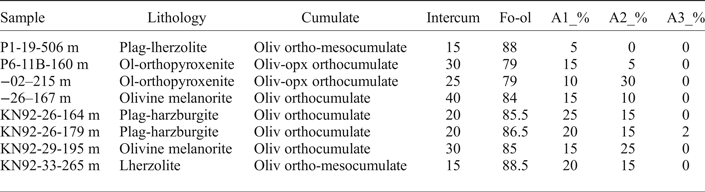
The unaltered chromites of the Kabanga intrusions, together with those of the similar Muremera and Musongati intrusions in Burundi, have been studied by Evans (Reference Evans2017). In the cumulate rocks, the forsterite (Fo) content of cumulate olivine is related broadly to the estimated volume of intercumulus space (intercumulate porosity: ‘Intercum’ in Table 1). Olivines in meso- to adcumulate rocks have compositions Fo88 to Fo89, whereas olivines in ortho- to mesocumulate rocks have compositions Fo84 to Fo87. Extreme orthocumulates (<50% cumulate olivine) and orthopyroxene-dominant cumulates contain olivine with Fo78 to Fo83. The chromites within these olivines and in adjacent intercumulus minerals (plagioclase, clinopyroxene and phlogopite) have correspondingly varying Mg# (atomic ratio of Mg/(Mg + Fe2+) expressed as a percentage) that correlates with the Mg# of enclosing ferromagnesian silicates. This indicates that the chromites have maintained equilibrium with the hosting or adjacent olivines and orthopyroxenes during late-magmatic crystallization reactions and sub-solidus cooling, as would be expected in a slowly-cooled intrusion. Evans (Reference Evans2017) describes the chromites of the larger layered intrusions of Musongati and Kapalagulu as being unzoned and homogeneous.
List of samples used in this study*.

*A1, A2 and A3 are alteration mineral assemblages defined in Evans (Reference Evans2014) – modal percent alteration.
Evans (Reference Evans2014) has made a study of the effects of metamorphism on the ultramafic rocks of the Muremera intrusions, adjacent to Kabanga in northeastern Burundi (Fig.1). Three alteration assemblages can be recognized in ultramafic rocks. At Muremera, Evans (Reference Evans2014) found that the first two types of alteration (pseudomorphic serpentine) have had no effect on the shape or composition of chromite grains, other than simple fracturing. These mesh-type serpentine-dominated alteration assemblages are widespread and generally result in pseudomorphic and only partial replacement of primary silicate minerals, so are inferred to be due to retrogressive, low-temperature metamorphism, with low fluid-rock ratios. In contrast, the third alteration assemblage, talc-carbonate-chlorite, is much more localized and is accompanied by wholesale textural degradation of primary silicates, and of earlier serpentine minerals. This type of alteration is inferred to be caused by large amounts of fluid flow in shear zones and associated adjacent extensional vein systems at greenschist-facies conditions. This hydrous carbonate alteration has variably and locally affected chromite grains, resulting in overgrowth of magnetite and causing the progressive dissolution-precipitation of Al-poor ferrian chromite and chromian magnetite rims at the expense of primary chromite (Abzalov et al. Reference Abzalov1998; Barnes, Reference Barnes2000). Petrographic observations show that the Kabanga intrusions have undergone a similar history of deformation and metamorphism as those of the Muremera intrusions (Maier et al., Reference Maier, Barnes, Sarkar, Ripley, Li and Livesey2010; Evans, Reference Evans2017).
Study methods
Samples used in this study were chosen from diamond drill core from well below the level of surficial weathering (below ~60 to 100 m depth; Fig. 1). The samples were chosen for their minimal metamorphic effects and absence of any deformational textures. They come mainly from the Kabanga Main intrusion, but one sample representing pristine peridotite comes from the larger Block 1 intrusion (Fig. 1). Petrographic descriptions have allowed classification of the samples into porphyritic (<50% cumulus grains), orthocumulate (50 to 70% cumulus grains) and mesocumulate (70 to 90% cumulus grains) textures (Table 1).
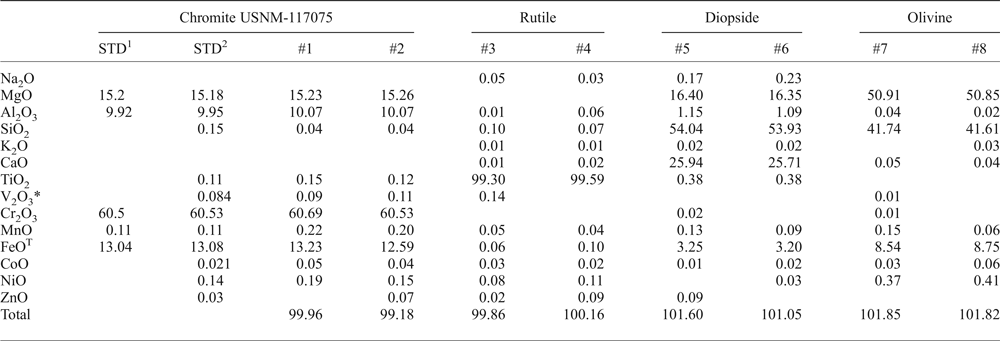
Chrome-spinels for analysis were first selected by microscopic examination, classified according to their shape, size and enclosure by cumulus (olivine and granular or poikilitic orthopyroxene) or intercumulus (interstitial clinopyroxene, plagioclase, phlogopite and sulfide) minerals. Their compositions were initially measured on a Hitachi S2500 SEM with Link EDS system at the Natural History Museum, London, to evaluate their broad compositional range and internal zoning. This was followed by wavelength dispersive electron probe microanalysis (EPMA) on Cameca SX50 and SX100 machines. For routine point analyses of Cr-spinel cores and rims on the SX50, the operating conditions were 20 kV accelerating voltage and a 60 nA beam current. Major oxides were calibrated on corundum (Al), periclase (Mg), chrome sesquioxide (Cr), rutile (Ti), hematite and pure iron (Fe) and wollastonite (Ca, Si). Trace elements were calibrated on pure metals (Mn, V, Ni, Co) or sphalerite (Zn). Count times on peaks were 10 s (Cr, Al, Mg), 20 s (Fe, Ca, Si, Ti, Mn, Zn), 30 s (V) or 40 s (Ni, Co), and on background positions were half those of the peak. For zoning profiles in spinels and adjacent silicates, an accelerating voltage of 15 kV with a beam current of 60 nA was used. Calibrations were made on jadeite (Na), periclase (Mg), corundum (Al), diopside (Si), wollastonite (Ca), pyrophanite (Mn, Ti), chrome sesquioxide (Cr), hematite (Fe), vanadinite (V), sphalerite (Zn) and pure metals (Ni, Co). Count times on peak positions were 10 s (Si, Al, Mg), 20 s (Na, Ca, Ti, Cr, Mn, Fe), 40 s (V, Zn), 60 s (Ni, Co). The Fe2O3 content of chrome-spinel was calculated by assuming charge balance and perfect spinel stoichiometry. Standard minerals were analysed at the start of each session and these results are summarized in Table 2. A full listing of EPMA results of zoning profiles on chromites is given as an appendix in the Supplementary material as Table A.1 (Supplementary Appendices A and B and Figs S1–11 have been deposited with the Principal Editor of Mineralogical Magazine, see below for details).
Standard minerals analysed during the study.

1 From Jarosewich et al. (Reference Jarosewich, Nelen and Norberg1980); 2 From Barnes (Reference Barnes1998).
Petrographic observations on chromites at Kabanga
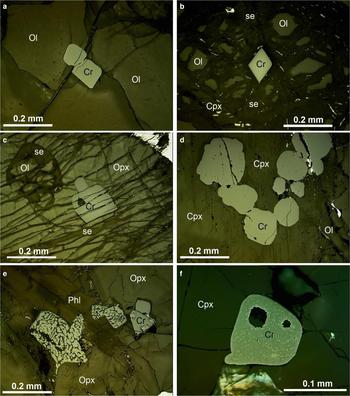
Petrographic examination of some 22 samples of different lithologies from a wide variety of stratigraphic positions at Kabanga has shown that the results of Evans (Reference Evans2014) on the metamorphism of ultramafic rocks at Muremera also hold true at Kabanga. The three alteration assemblages that are typically found in chromite-bearing olivine-rich rocks are also identified at Kabanga and have similar intensities. Six samples representing the least-altered examples of porphyritic to mesocumulate melanorite and peridotite and two samples of olivine-orthopyroxenite were chosen for detailed study of chromite zoning (Table 1). The relative intensity of the three alteration assemblages in these chosen samples are detailed in Table 1 (given as modal percent alteration minerals). Some typical textures of chromite and the mineral assemblages found in these samples are shown in Fig. 2.
Reflected light photomicrographs of representative textures of chromite at Kabanga: (a) euhedral chromite included within unaltered olivine, P1-19-506 m, spot 05; (b) euhedral chromite within partly serpentinized olivine, sample KN92-33-265 m spot 01; (c) euhedral chromite and rounded olivine within orthopyroxene oikocryst, sample KN92-26-164 m spot 06; (d) a chain of subhedral chromite grains within interstitial clinopyroxene, sample P1-19-506 m spot 04; (e) euhedral and subhedral chromites partly enclosed within phlogopite and showing complete myrmekitic texture where fully enclosed by phlogopite and partial myrmekitic texture (castellated margin) where partly enclosed within an embayment in orthopyroxene, sample P6-11B-160 m spot 15; (f) euhedral chromite grain within clinopyroxene, showing speckling due to exsolution of very fine ilmenite lamellae (under oil immersion), sample P1-19-506 m spot 13. Igneous mineral abbreviations: Cr chromite, Cpx clinopyroxene, Opx orthopyroxene, Ol olivine, Pl plagioclase, Phl phlogopite, Po pyrrhotite; alteration mineral abbreviations: cl chlorite, pmp pumpellyite, se serpentine, tr tremolite.
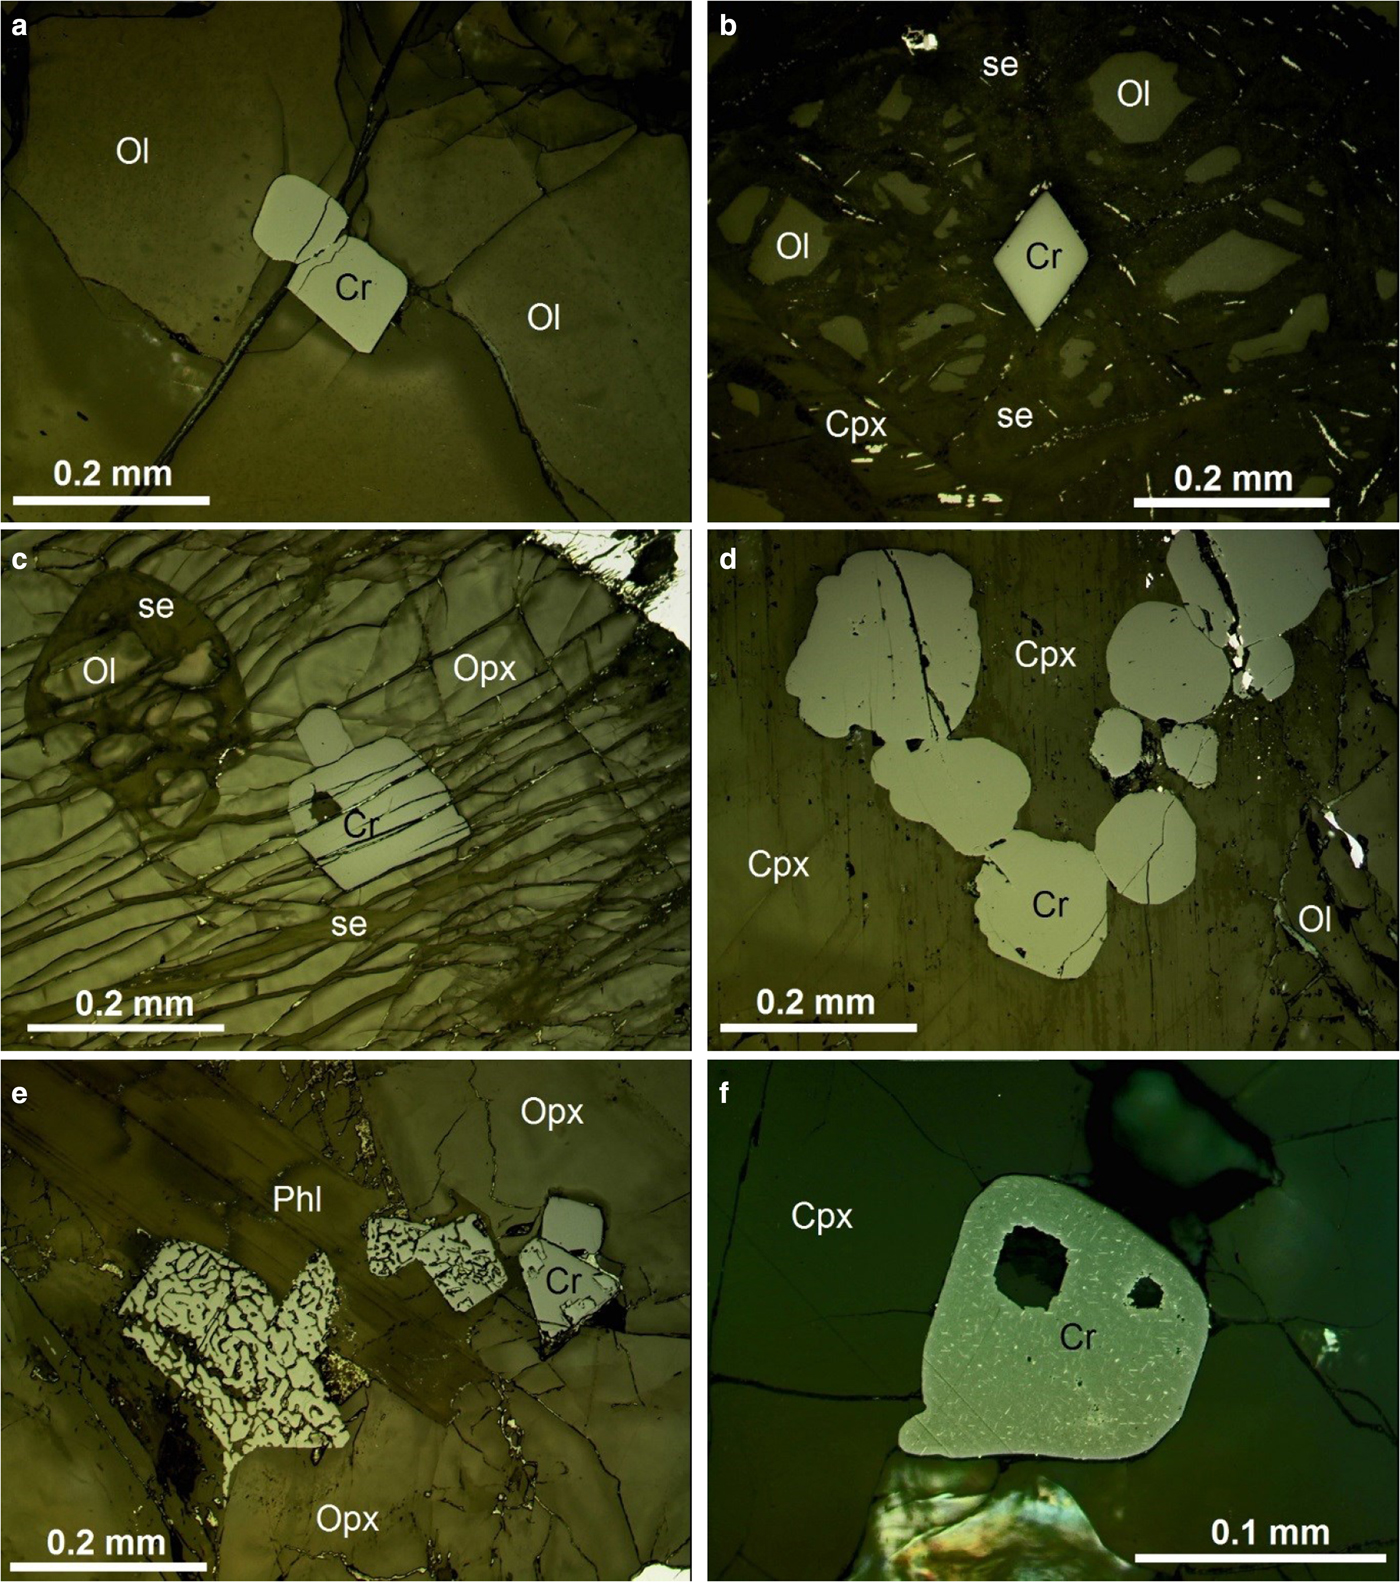
It should be emphasized again that the chromite found in the unaltered or weakly-altered rocks studied here have no distinct or incipient ferrian-chromite or magnetite rims and thus are inferred to be unaffected by metamorphism and fluid-dominated alteration. Most of the chromites observed in these samples are euhedral to subhedral and of normal size for chromites of olivine-rich cumulate intrusive rocks (0.03 to 0.3 mm). In transmitted and reflected light, the chromites generally appear to be homogeneous and unzoned (Fig 2).
Relatively few, generally isolated grains are found within cumulus olivine, and these tend to be of smaller size (0.02 to 0.1 mm) and of more rounded shape than those in post-cumulus grains (Fig. 2a, b). The chromite hosted in olivine is usually located at the intersection of two or more curviplanar fractures of the olivine that usually carry serpentine alteration (Fig. 2b). Chromite in olivine is always opaque in thin section and commonly contains very fine lamellae of ilmenite.
A large majority of chromite grains are wholly or partly enclosed within late cumulus or post-cumulus silicate grains, either large poikilitic orthopyroxene oikocrysts (Fig. 2c) or anhedral interstitial plagioclase, clinopyroxene and phlogopite, inferred to have crystallized after both olivine and orthopyroxene. These chromites are typically grouped in clusters or chains of 30 or more grains (Fig. 2d). The grainsize of the chromite in these interstitial minerals is generally larger (0.07 to 0.30 mm) and they more often have an idiomorphic octahedral shape (Fig. 2c,e).
The chromite grains hosted within poikilitic orthopyroxene are euhedral and commonly loosely clustered between small, rounded partly resorbed (reacted) olivine grains (Fig. 2c). They are usually translucent reddish-brown in transmitted light and do not contain visible exsolution lamellae of ilmenite (Fig. 2c). In contrast, chromite enclosed in late intercumulus minerals (plagioclase, clinopyroxene and phlogopite) are opaque in transmitted light and usually contain very fine crystallographically-oriented lamellae of ilmenite that are microscopically visible in reflected light (Fig 2f).
An exception to the rule of homogeneous grains is seen in those samples containing abundant interstitial magmatic phlogopite. In these samples, the chromite that is enclosed by phlogopite, or that is in contact with narrow bands of phlogopite that have penetrated along cumulus or intercumulus grain boundaries, has a more highly reflective ‘castellated’ rim that is separated from the main grain by a thin and discontinuous band of phlogopite (Fig. 3b,d). In some cases, the whole grain has been converted to a myrmekite-like intergrowth of a brighter chromite with the phlogopite (Fig. 2e). This phenomenon, here termed phlogopite reaction, is only observed where the chromite is in contact with magmatic interstitial phlogopite: within the same thin section, chromite that is not in contact with phlogopite is not rimmed in this way.
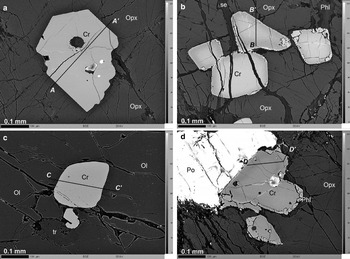
Back-scattered electron images of chromites showing gradational compositional zoning: (a) euhedral chromite within orthopyroxene oikocryst enhanced to emphasize zoning in orthopyroxene around the chromite, sample KN92-26-164 m, spot 17; (b) cluster of subhedral chromites within orthopyroxene oikocryst and showing weak castellated rim at top right corner adjacent to phlogopite, sample KN92-26-164 m, spot 03; (c) subhedral chromite with weak reverse zoning within olivine, sample P1-19-506 m, spot 09; (d) large subhedral grain at interface between orthopyroxene and sulfide, rimmed by narrow band of phlogopite adjacent to the orthopyroxene, sample KN92-26-164 m, spot 05. The location of the analysis profiles A–A’, B–B’, C–C’ and D–D’ are shown; mineral abbreviations as in Fig. 2.

Although zoning of the chromite grains was not observed in transmitted- or reflected-light microscopy, a gradational concentric zoning was observed by back-scattered electron (BSE) imaging to be present in many grains, especially the larger grains enclosed in intercumulus minerals. Such zoning can be seen clearly in the orthopyroxene-hosted chromites of Fig 3b. The BSE image intensity reflects the proportion of heavier elements (Fe, Cr) to the less dense components of the spinel (Mg, Al), therefore the darker rims of the chromite indicate Al (and Mg)-rich compositions. Such darker, Al-rich outer zones are also observed on chromite grain faces adjacent to interstitial sulfide aggregates (Fig. 3d). In a relatively small number of cases mainly from the peridotite sample from the Block 1 intrusion, some chromite grains show an inverse sense of zoning, from a darker core to a brighter rim (Fig. 3c, d). This is the case for olivine-hosted chromite from Block 1 and the chromite grains in contact with interstitial sulfides. It should be noted that zoning of chromite in the Block 1 sample is otherwise weak or absent.
Additionally, Mg-rich, Fe-poor gradationally-zoned haloes of width 30 to 60 µm are generally present in olivine and orthopyroxene wherever they are in direct contact with chromite. This can be seen in Fig. 3a, for example, where the darker intensity of the enclosing orthopyroxene in a halo around the chromite grain reflects a higher Mg content. The zoning of silicates adjacent to chromite is observed in samples from the smaller Kabanga Main as well as the larger Block 1 intrusion.
It is observed that many chromite grains within partly serpentine-altered olivine and orthopyroxene are weakly fractured, with the irregular fractures filled by a thin infill of serpentine (Fig. 2c, 3b). The serpentine infill is similar in appearance to and typically contiguous with thin veins cutting through the olivine and orthopyroxene. It can be noted that these serpentine-filled fractures cut passively across the gradational zoning described above and that the zoning is not modified adjacent to the fractures (Fig. 3b).
Mineral chemistry of chrome spinels at Kabanga
Intergrain variation
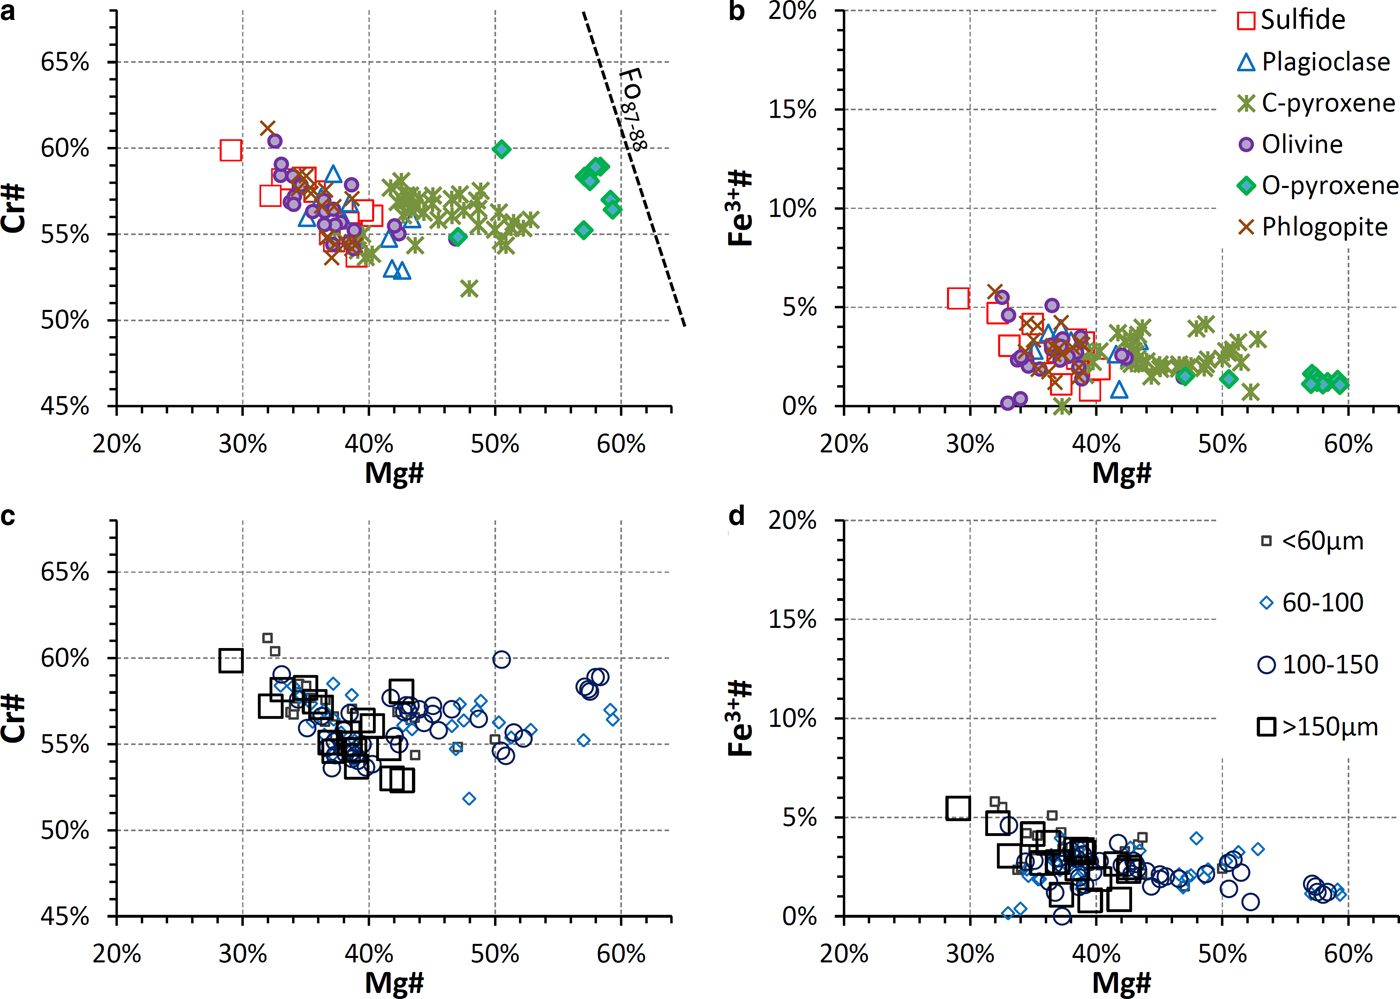
The intergrain chemical variation of chromite was measured by analysing the cores of 50 to 100 grains from each sample either as single points or more often as an average of 3 to 5 points within the core. Chromite compositions from all the samples chosen for detailed investigation show a wide variation of Mg# relative to a moderate variation of Cr# (atomic ratio of Cr/(Cr + Al) expressed as a percentage; analyses from one representative sample only are presented in Figs 4 and 5 to aid clarity). The Mg# varies from about 20 to 60% whereas the Cr# varies from 50 to 65%. At lower values of Mg#, there is typically an apparent anti-correlation between Cr# and Mg#. In all samples, the grains have low Fe3+# (Fe3+/(Fe3++Cr + Al) of below 5%. Chromite grains hosted in the orthopyroxene oikocrysts of olivine cumulate rocks have the most Mg-rich compositions (40 to 63%), those hosted in clinopyroxene have intermediate values (35 to 52%), whereas those hosted in other interstitial minerals and in olivine have lower values (20 to 45%; Fig. 4a). The observation that orthopyroxene-hosted chromite has the highest Mg# values and the lowest levels of trace elements, particularly TiO2 is common to all samples investigated.
Major-element ratios of chromite cores from sample P1-19-506 m only – each point represents the core analysis of an individual grain to illustrate intergrain variation: (a) and (b) classified by mineral host; (c) and (d) classified by grain size. The regression of high-temperature chromites in equilibrium with olivines of composition Fo87–88 in primitive volcanic rocks (Kamenetsky et al. Reference Kamenetsky, Crawford and Meffre2001) is shown as a dashed line in (a).

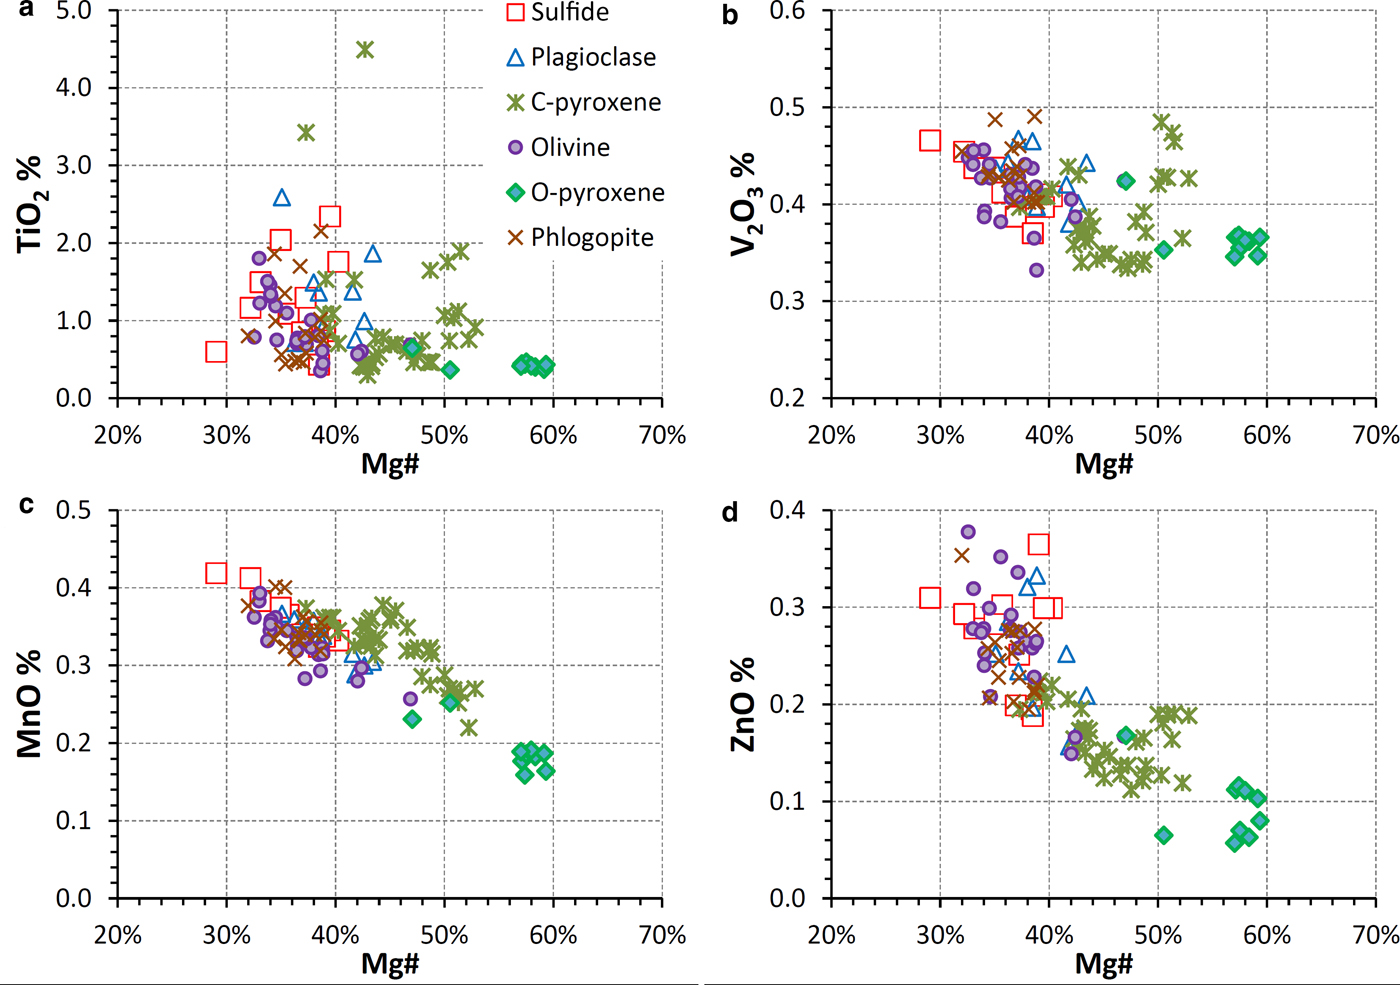
Minor-element compositions of individual chromite cores from sample P1-19-506 m, plotted against Mg# ratio to illustrate intergrain variation. NiO levels were also analysed but show considerable scatter around the detection limit (0.05 wt%).

The core compositions of coarser grained chromite grains tend to be higher in Cr# but lower in Mg# than finer-grained grains in the same host mineral (Fig. 4c). It should be noted that no attempt has been made to estimate true grain sizes by examination in transmitted light of over-thick sections. The grain sizes used in the figure refer to apparent sizes as measured on the upper surface of the polished thin section, so may often underestimate the true size of grains that have been sectioned near their edge or corner.
Of the trace-element oxides, TiO2 is most variable in these grains, showing no correlation with the major-element oxides or ratios. V2O3 shows a weak inverse correlation, whereas MnO and ZnO have a relatively strong inverse correlation with Mg# (Fig. 5). The highly variable TiO2 values can be linked to the petrographic observation of fine, discontinuous ilmenite lamellae in many chromite grains. Attempts were made to minimize this TiO2 variability by avoiding ilmenite lamellae during EPMA point selection, though this was only partly successful due to beam drift and fluorescence effects around the beam. It was found that averaging of 3 to 5 point analyses (1–2 µm beam size) gave a similar precision to analysis of a single point with a beam defocussed to a diameter of ~10 µm.
Intragrain variation
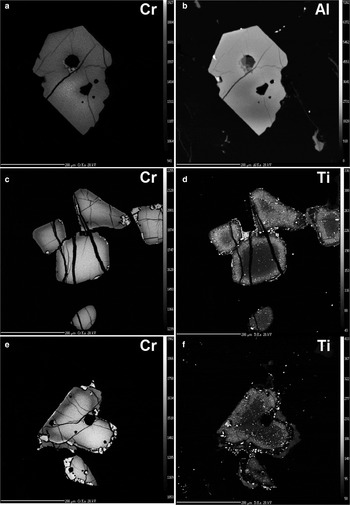
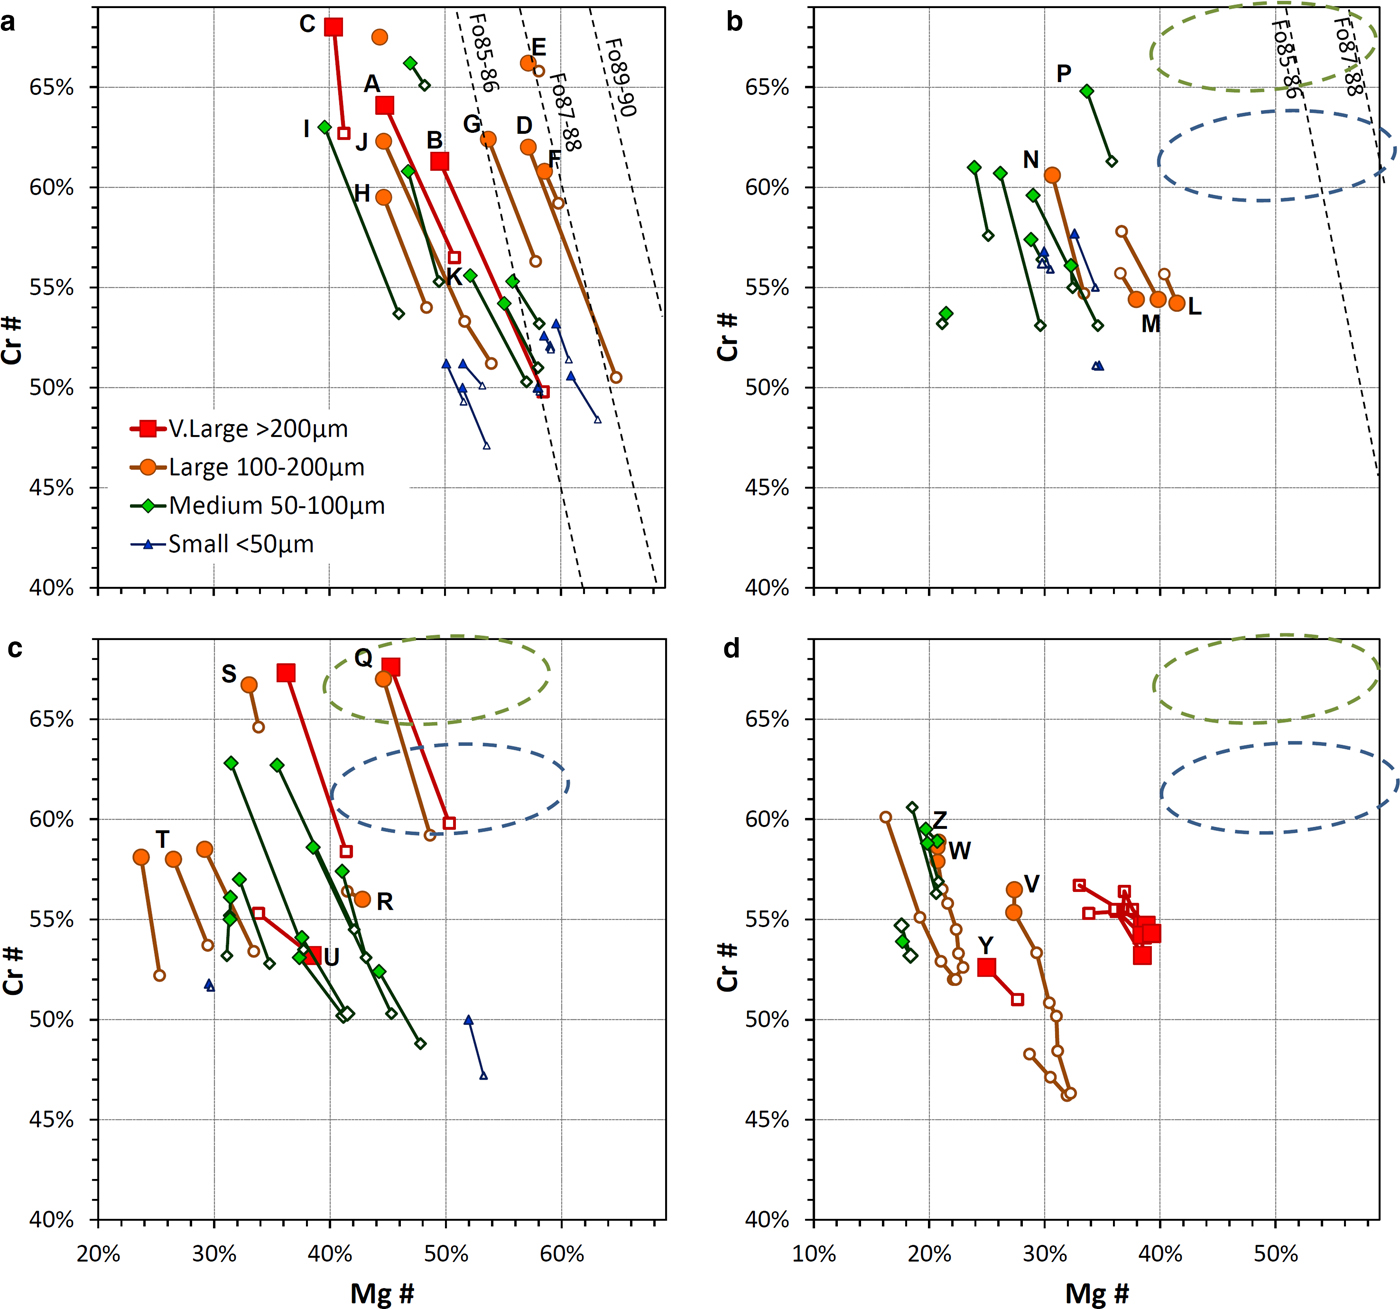
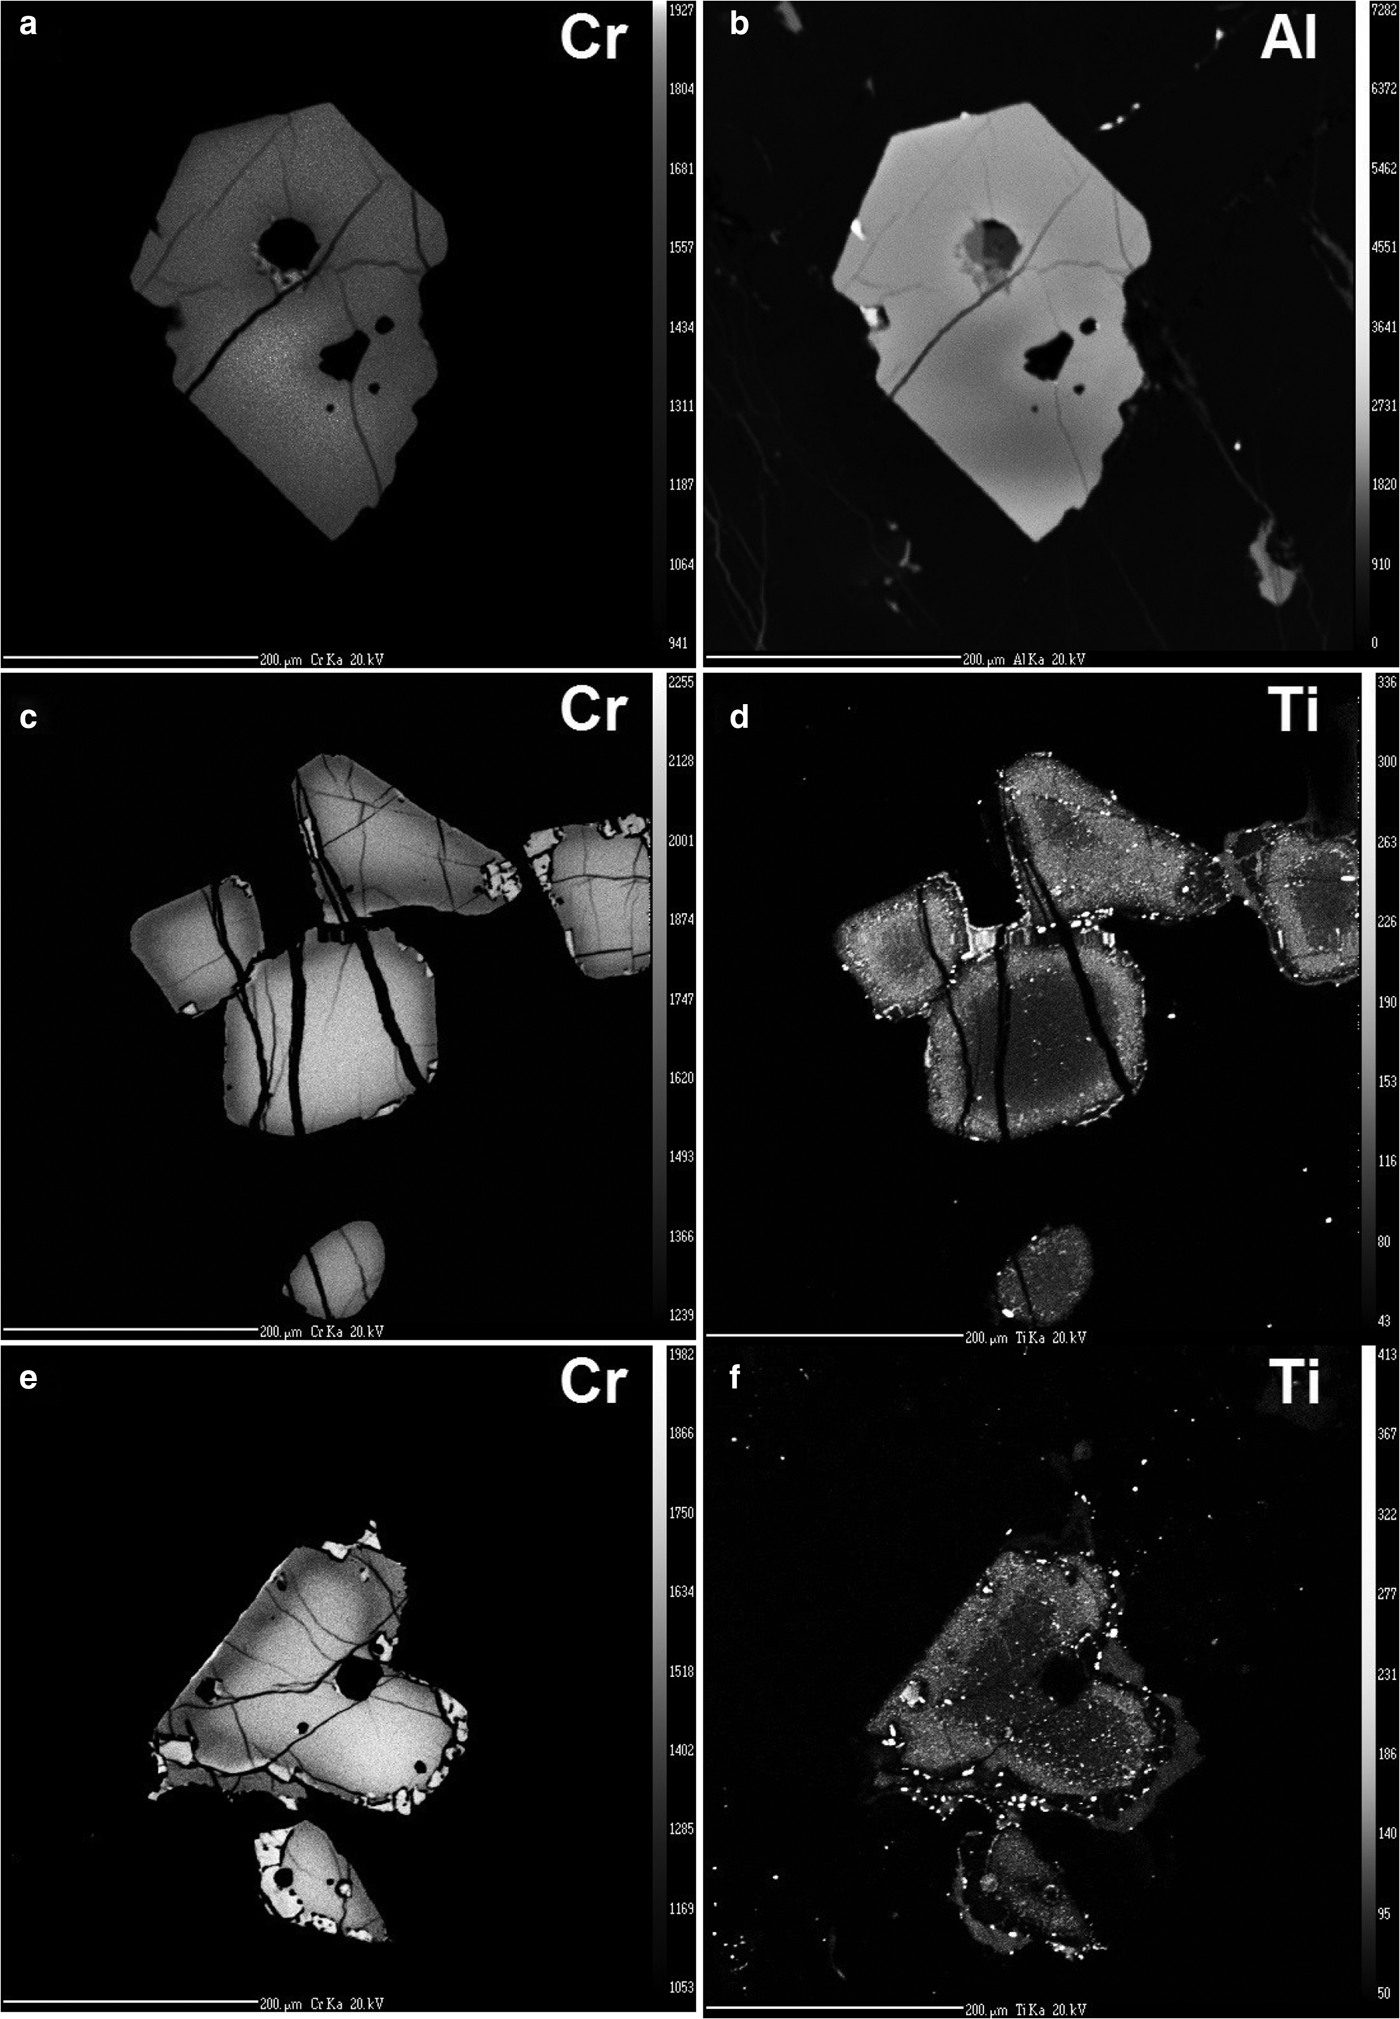
Most chromites in unaltered ultramafic rock at Kabanga are not chemically homogeneous and show gradational concentric zoning. The zoning is usually cryptic in that it is not easily discernible optically in either reflected or transmitted light (Fig. 2) but can readily be seen in back-scattered electron (BSE) and X-ray intensity images (Figs 3, 6) by using appropriate contrast and brightness settings. The zoning is most apparent in the trivalent cations Cr3+ and Al3+, but Mg2+ and Fe2+ are also zoned. The Fe3+ cation appears to be unzoned within the errors of its stoichiometric calculation. With Fe3+ unvarying and at very low levels, Al3+ and Cr3+ vary inversely on the spinel octahedral sites in the zoning, as do Mg2+ and Fe2+ on the tetrahedral sites. The zoning can thus be best represented on Cr# vs. Mg# diagrams (Fig. 7).
EPMA X-ray element images for chromite grains shown in Fig. 3: (a) Cr and (b) Al for sample KN92-26-164 m Spot-17A (compare with Fig. 3a, grain A in Fig. 7a); (c) Cr and (d) Ti for sample KN92-26-164 m Spot-03 (c.f. Fig. 3b, grain J in Fig. 7a); (e) Cr and (f) Ti for sample KN92-26-164 m Spot-05 (c.f. Fig. 3d, grain V in Fig. 7d). Scale bar is 0.2 mm in all images.
Intragrain variation of individual chromite grains showing cores (solid-filled symbols) linked to their rims (open symbols) classified by their grain size: (a) mainly normal-sense zoning of unreacted (TiO2-poor) chromites contained in orthopyroxene oikocrysts; (b) reverse and normal-sense zoning of chromites enclosed within olivines; (c) mainly normal-sense zoning of reacted (TiO2-rich) chromites in interstitial orthopyroxene, clinopyroxene and plagioclase; (d) composite zoning shown by some chromite grains interstitial to silicates and adjacent to sulfide blebs. The dashed oblique lines in (a) and (b) are the regression lines of volcanic chromites in equilibrium with olivine of given compositions from Kamenetsky et al. (Reference Kamenetsky, Crawford and Meffre2001). The dashed oval fields represent two groups of core compositions of unreacted orthopyroxene-hosted grains in Fig. 7a, centred around grain B and grain C. Some notable individual grains are labelled by a capitalized letter referring to a label in Appendix 1 (Supplementary material, Table A1).

It is notable that Mg# and Cr# are strongly anti-correlated from core to rim in all zoned chromite grains. Thus, zones with low Cr# (Al-rich) have relatively high Mg# (Fe-poor) and vice versa. The parallelism of zoning relations presented in Fig. 7 shows that substitution of divalent cations in the spinel structure is not independent of that of the trivalent cations. The substitution of Mg2+ for Fe2+ is linked strongly to the substitution of Al3+ for Cr3+.
This zoning is most developed in larger grains (>0.1 mm) such as those hosted in orthopyroxene oikocrysts (Fig. 7a), or in interstitial plagioclase, clinopyroxene or phlogopite (Fig. 7c): smaller grains (<0.04 mm) in all these hosts show weak or no apparent zoning. Figure 7 also shows that the composition of the smaller grains lies towards the lower end of the Cr#–Mg# zoning trend of the larger grains, that is, close to their rim compositions. This feature may be explained partly by the different levels of sectioning of individual grains on the thin section, such that many apparently smaller grains represent the corners or edges of larger grains (i.e. their rims). Note that large grains containing rounded composite silicate inclusions are also zoned internally towards the margins of these inclusions (Fig. 6a, b).
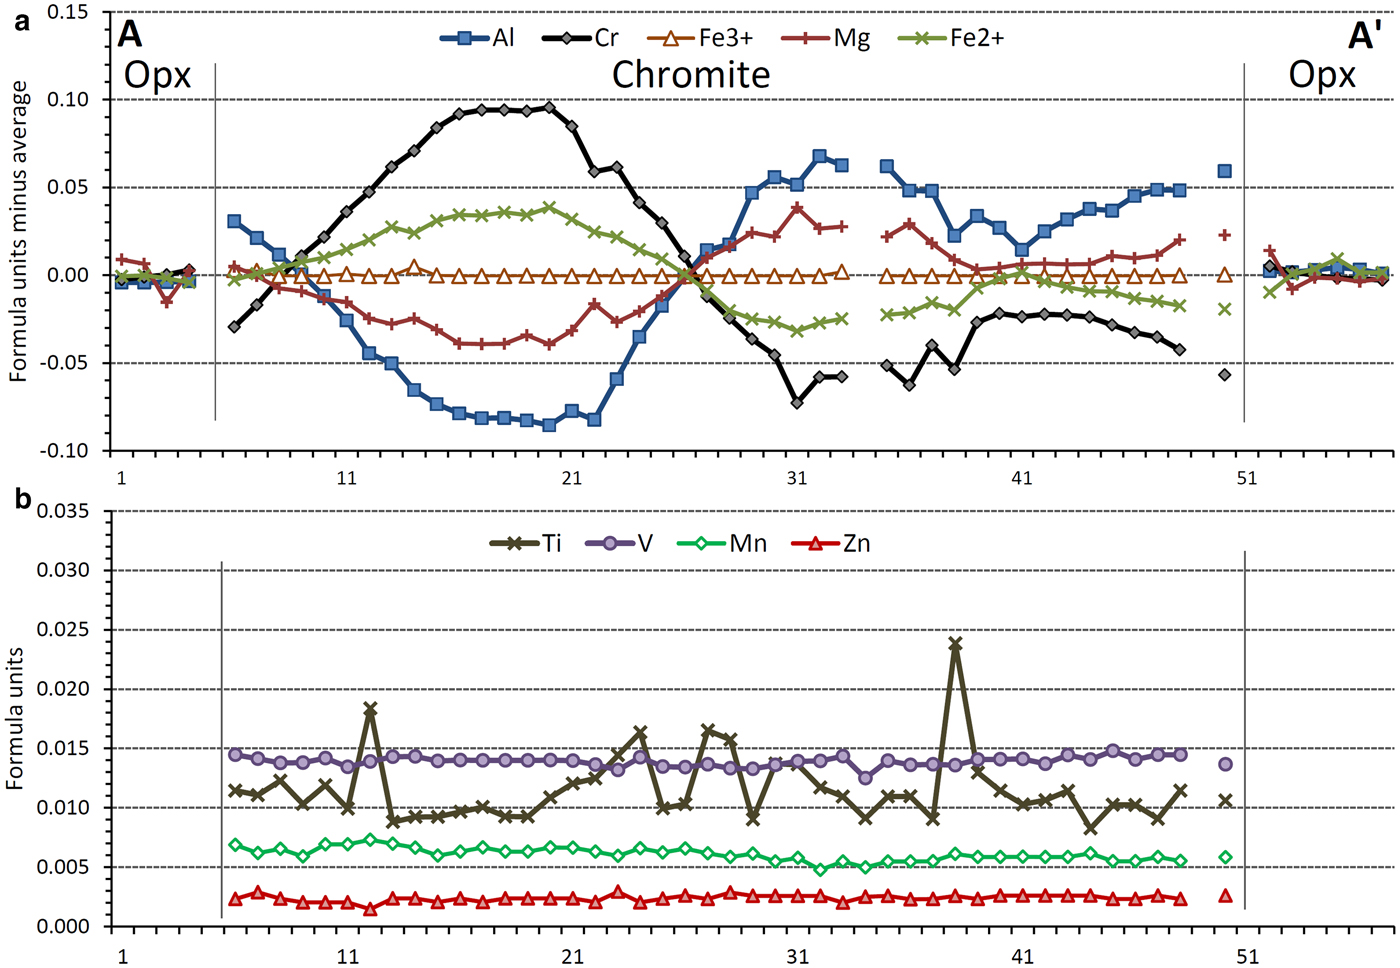
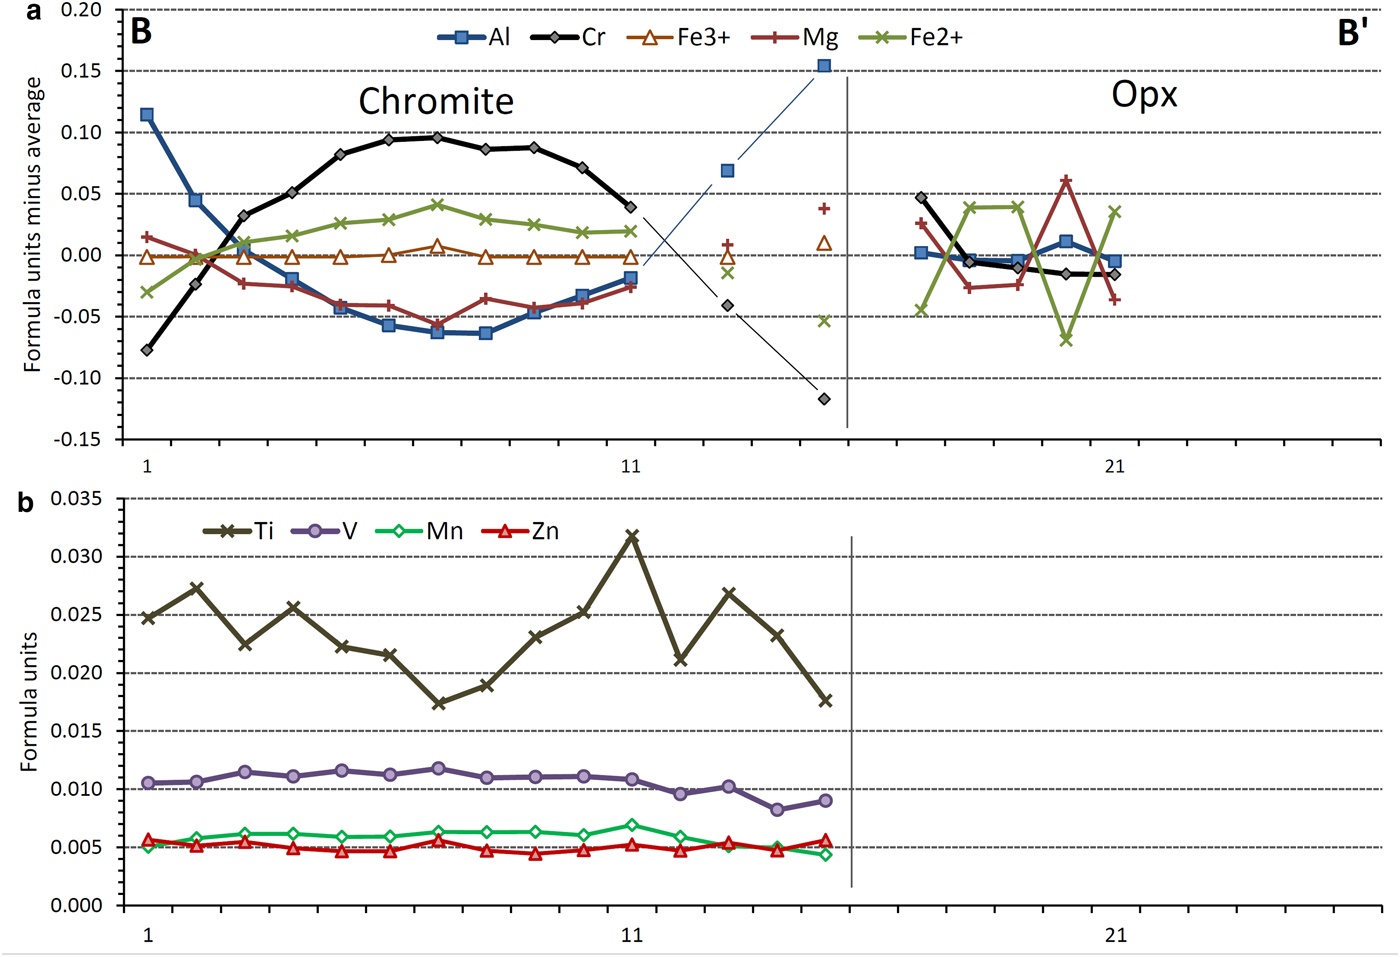
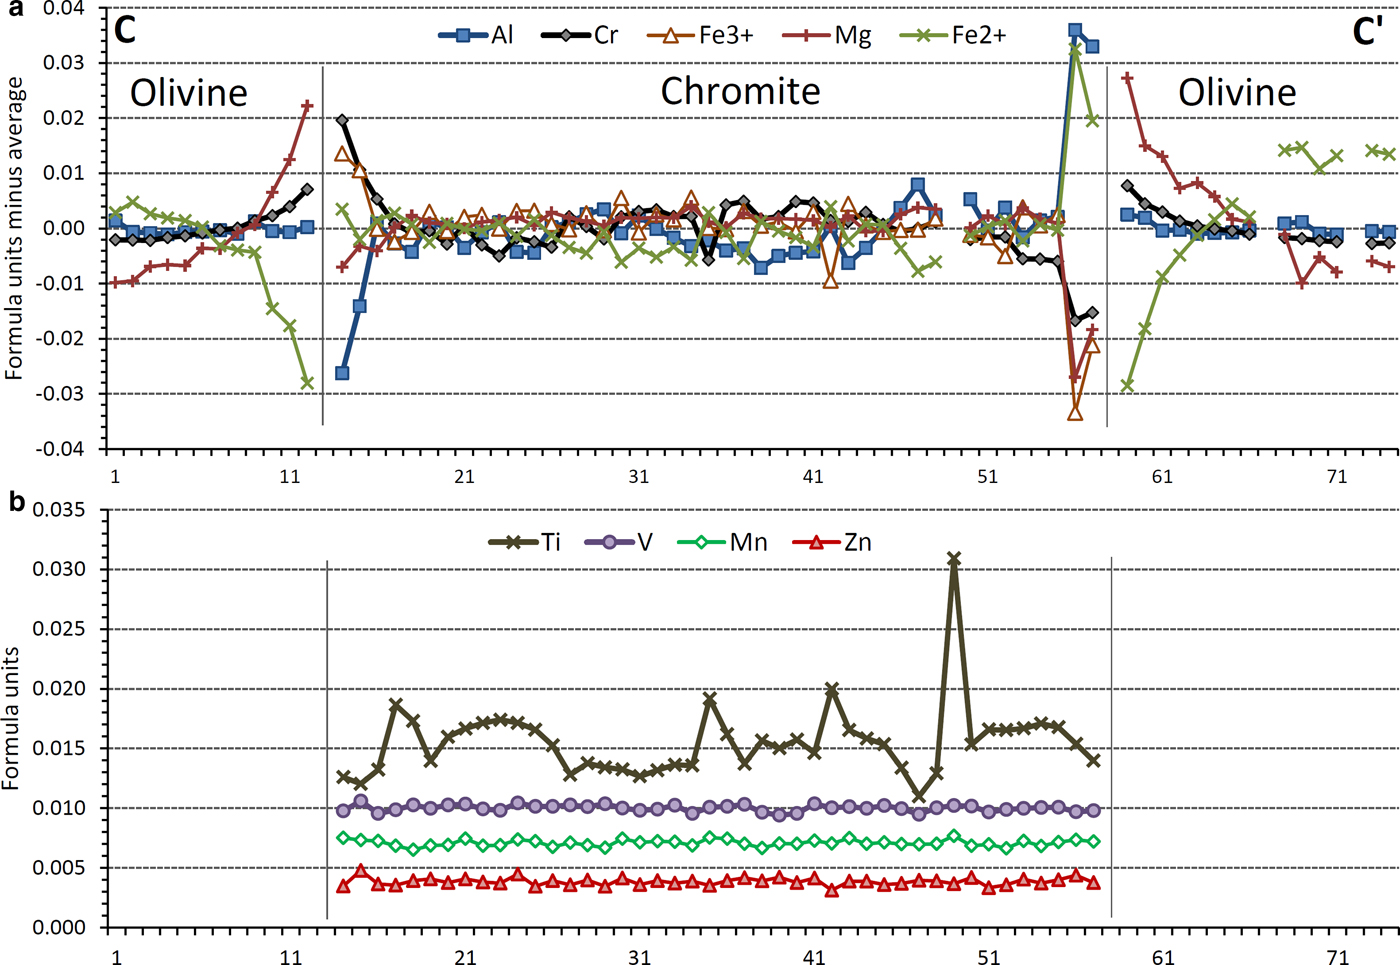
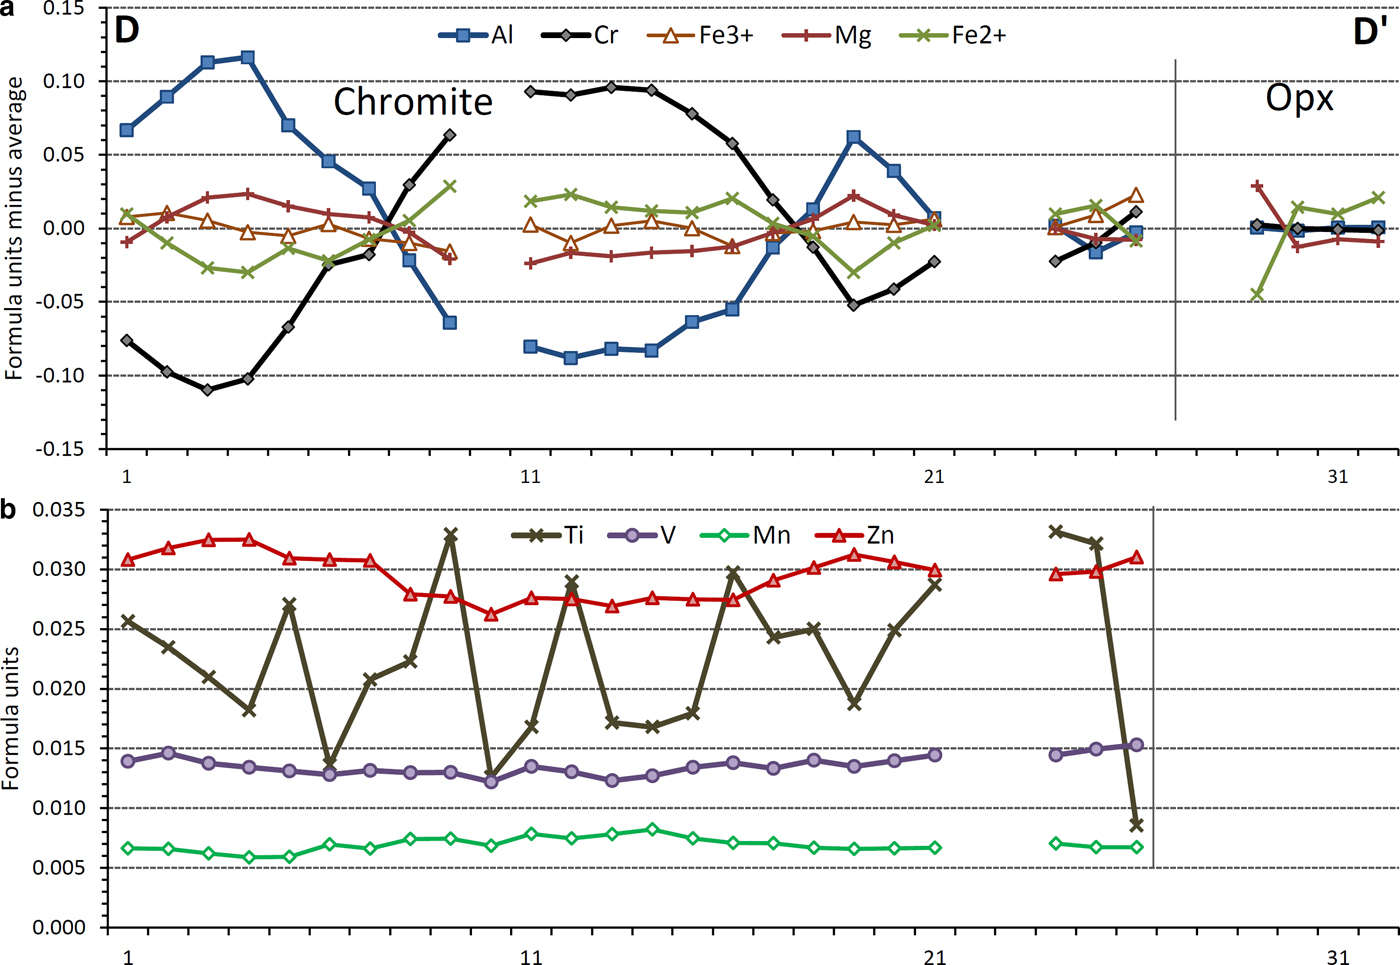
Spot analyses by EPMA along traverses from rim to rim clearly show the smooth, gradational aspect of the zoning (Figs 8, 9, 10, 11). These analytical traverses are presented in formula units rather than weight percent to emphasize the complementarity of the cation exchanges within the spinel structure. The major-element formula unit values are presented as variations from the average value across the grain so that the elements can be plotted on the same graph. Minor elements, however, are presented simply as formula units, without subtraction of their average.
EPMA compositional profiles A–A’ shown on Fig. 3a: (a) major-element formula units (for four oxygens in spinel, six oxygens in pyroxene) less the average across the whole grain (calculated separately for chromite and orthopyroxene); (b) minor-element formula units.

EPMA compositional profiles B–B’ shown on Fig. 3b: (a) major-element formula units (for four oxygens in spinel, six oxygens in pyroxene) less the average across the whole grain (calculated separately for chromite and orthopyroxene); (b) minor-element formula units.

EPMA compositional profiles C–C’ shown on Fig. 3c: (a) major-element formula units (for four oxygens in spinel, four oxygens in olivine) less the average across the whole grain (calculated separately for chromite and olivine); (b) minor-element formula units.

EPMA compositional profiles D–D’ shown on Fig. 3d: (a) major-element formula units (for four oxygens in spinel, six oxygens in pyroxene) less the average across the whole grain (calculated separately for chromite and orthopyroxene); (b) minor-element formula units.

Most grains are zoned from Cr-Fe-rich cores to Al-Mg-rich rims (Figs 7a, 7b, 8, 9 and 11): this is referred to in this work as the normal sense of zoning, from a nominally more primitive Cr-rich core to a more evolved Al-rich rim. The larger grains with normal-sense zoning show a range of Cr# variation that covers the whole range of intergrain variation (compare for example grains B and J on Fig. 7a with the range of Cr# values on Fig. 4). Some grains hosted in olivine are weakly zoned from Mg and Al-rich cores to more Fe2+ and Cr-rich rims (reverse-sense zoning: Figs 3c, 7b grains L and M and Fig. 10). Some larger grains show composite zoning with a normal sense over the broad centre of the grains, and a thin rim with a reverse sense of zoning (Fig. 3d and grains V and W in Fig. 7d). This is particularly the case with large, interstitial chromite grains that are not enclosed by a single silicate mineral but that occur on grain boundaries between different interstitial minerals. This composite zoning may be markedly asymmetric when the chromite grain is in contact with a silicate on one side and a sulfide mineral on another (Fig. 11 and Supplementary figures S5 and S6).
The minor elements show less distinct zoning than the major elements, either due to the inherent lower analytical precision at trace levels, or to the variability of TiO2 due to exsolution of fine ilmenite lamellae. Nevertheless, Mn shows a clear propensity to follow the Fe2+ variation in the zoning, whereas Zn follows Mg variation (Figs 9 and 11). Vanadium is usually only weakly zoned but shows instances of correlation with both Fe-Cr (Fig. 8) and with Mg-Al (Fig. 11).
Zoning of adjacent ferromagnesian silicates
In the least altered samples, a gradational zoning of the olivine and orthopyroxene can be observed immediately adjacent to the chromite grains, where this contact is well-preserved from serpentine veining (Fig. 10). Thus, a narrow Mg-rich band forms a halo within the olivine or orthopyroxene around the chromite grain, shown as a darker halo in back-scattered images (Fig. 3a). This Mg-enrichment of the silicate adjacent to chromite occurs irrespective of whether the chromite grain is normal or reverse-zoned (compare Figs 8 and 10).
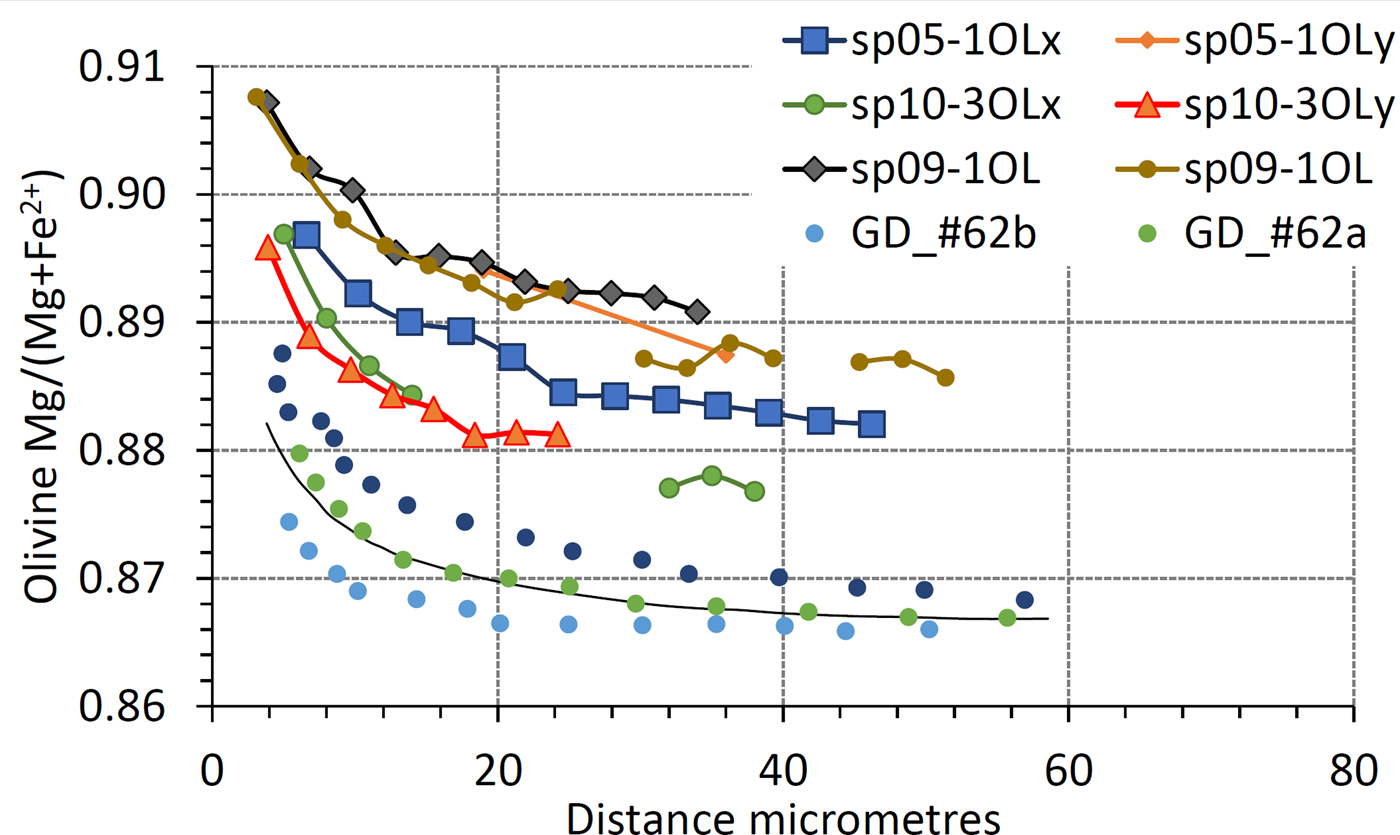
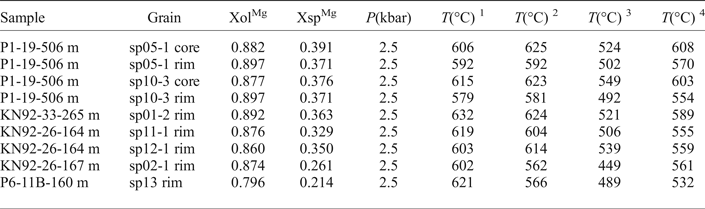
This indicates that Mg and Fe2+ have been exchanged by subsolidus diffusion between chromite and olivine or orthopyroxene during subsolidus cooling (Irvine, Reference Irvine1965). Figure 12 shows the zoning profiles of olivine adjacent to three different chromite grains of the Block 1 intrusion sample and compares them with diffusion haloes seen in olivine of the Great Dyke (Wilson, Reference Wilson1982). The diffusion profiles at Kabanga are similar in extent and range to those of the Great Dyke sample, although at overall higher forsterite contents. Assuming a pressure of 2.5 kbar at emplacement and applying the olivine–chrome-spinel Fe2+-Mg2+ exchange geothermometer of Sack and Ghiorso (Reference Sack and Ghiorso1991) to these zoned (rim) chromite–olivine pairs and to those in other samples indicates very low equilibration temperatures of ~580 to 630°C at Kabanga (Table 3).
EPMA compositional profiles in olivine adjacent to three separate chromite grains in sample P1-19-506 m (Block 1). Small dots represent analyses of olivine adjacent to chromite of the Great Dyke from sample 62 (harzburgite of Unit 2; data of Wilson, Reference Wilson1982). The fine continuous line represents Wilson's diffusion model for the crystallographic b axis of olivine in sample 62.

Geothermometry of chromite-olivine pairs.

1 Sack and Ghiorso (Reference Sack and Ghiorso1991); 2 Fabriès (Reference Fabriès1979); 3 Roeder et al. (Reference Roeder, Campbell and Jamieson1979); 4 O'Neill and Wall (Reference O'Neill and Wall1987).
Discussion
Estimation of primary magmatic compositions of chromites and parent magmas
The cores of the larger chromite grains enclosed in orthopyroxene oikocrysts have compositions that have moderately high Mg# (45–50%) and Cr# (60–68%) values (Fig. 7a). Such grains are thought to represent the least-modified chromites relative to original primocryst compositions. These compositions lie closest to the regression lines of chromites in high-temperature equilibrium with olivine derived from the compilation of modern volcanic rocks of Kamenetsky et al. (Reference Kamenetsky, Crawford and Meffre2001; Fig. 7a). Although it is likely that the composition of these orthopyroxene-hosted chromites has been modified to lower Mg# values by later processes (Cameron, Reference Cameron1975, Roeder et al. Reference Roeder, Campbell and Jamieson1979), their compositions do indicate crystallization from a moderately primitive Mg- and Cr-rich magma such as a tholeiitic picrite, which is consistent with geochemical evidence presented by Evans (Reference Evans and Hall1999) and Maier et al. (Reference Maier, Barnes, Sarkar, Ripley, Li and Livesey2010). During emplacement in the crust, this primitive magma interacted with and abundantly assimilated siliceous and aluminous pelitic rocks, resulting in a more siliceous, alumina-rich hybrid magma, with a lower  $f_{{\rm O}_{\rm 2}} $ (Maier et al., Reference Maier, Barnes, Sarkar, Ripley, Li and Livesey2010; Evans, Reference Evans2017). Such a change in magma composition may have resulted in the initial concentric growth zoning of still-crystallizing chromite grains to more Al-rich and Ti-rich margins (Fig. 6d) before their entrapment in orthopyroxene oikocrysts.
Origin and preservation of trivalent and tetravalent cation zoning
In general, trivalent and tetravalent cations have much lower interdiffusion rates in oxides and silicates than do divalent cations (Posner et al., Reference Posner, Ganguly and Hervig2016; Suzuki et al., Reference Suzuki, Yasuda and Ozawa2008; Van Orman and Crispin, Reference Van Orman, Crispin, Zhang and Cherniak2010) and thus should be more useful for determining high-temperature processes. The zoning of the trivalent cations Cr and Al in chromite discussed in this paper is smoothly gradational, concentric and is usually simple (without repetition or reversal). Serpentine veining cuts across passively and has no effect on the zoning (Fig. 4, 6a,b). It is present in chromites hosted by unaltered igneous minerals such as orthopyroxene and olivine, thus it is inferred to predate and be independent of any metamorphic or hydrous alteration effects. The zoning occurs in small euhedral chromites wholly enclosed in early-crystallizing olivine and orthopyroxene, as well as in larger interstitial grains. Thus, the zoning can be inferred to be an early feature of chromite growth associated with changing relative activities of Cr and Al in the magma, prior to entrapment of the grains in enclosing silicates. The common observation of normal zoning from a Cr-rich core to an Al-rich rim suggests the grains initially grew from a primitive Cr-rich magma, with later growth from a more Cr-depleted, Al-rich liquid.
Those chromites enclosed within early-crystallized phases such as orthopyroxene and olivine have low Ti contents in their core, but sometimes have a sharply-bounded Ti-enriched rim, coinciding roughly with the enrichment of Al discussed above (Fig. 6). The sharp boundary of the outer zone for Ti relative to the gradational boundary for Cr and Al suggests that the tetravalent cations have an even slower diffusion in chromite than the trivalent. The enrichment in Ti of the cores of many chromites hosted in clinopyroxene, plagioclase and phlogopite (Fig. 5a) suggest that reaction with residual liquid must take place at temperatures at which Ti can still diffuse throughout the spinel grain.
Although most chromite grains in the samples have euhedral to subhedral shapes and zoning of Ti is sometimes sharply bounded (Fig. 6d,f), the compositional zoning of Cr, Al, Mg and Fe2+ is usually gradationally rounded and runs broadly parallel to the outer margins (Figs 3, 6, 8 and 9). These observations might suggest that the currently-observed zoning has been modified by diffusional movement of cations within, or into and out of the grain (Van Orman and Crispin, Reference Van Orman, Crispin, Zhang and Cherniak2010). This diffusion may occur in two situations: (1) a later, lower-temperature interdiffusion overprint on early, high-temperature magmatic crystal growth zones (which might have been initially sharply-bounded and internally euhedral; Roeder et al., Reference Roeder, Poustovetov and Oskarsson2001); and (2) homogeneous early cumulus crystals are subject to late-magmatic reaction with evolved interstitial melts and subsolidus diffusional exchange with enclosing silicate minerals (Cameron, Reference Cameron1975, Scowen et al., Reference Scowen, Roeder and Helz1991). These possibilities will be discussed later in an evaluation of cooling and diffusion rates.
Chrome-spinel as an early-crystallizing mineral in basaltic and komatiitic magmas is known to be susceptible to later magmatic reaction with evolved melts and sub-solidus re-equilibration with adjacent or enclosing minerals (Cameron, Reference Cameron1975; Henderson, Reference Henderson1975; Roeder and Campbell, Reference Roeder and Campbell1985). Thus, in most intrusions chrome-spinel compositions are no longer representative of primary igneous conditions at initial crystallization and growth. Observers of chromite compositions in large layered intrusions have generally remarked that these reacted and re-equilibrated chromites are compositionally homogeneous and show no signs of internal zoning (Wilson, Reference Wilson1982; Roeder and Campbell, Reference Roeder and Campbell1985). This lack of zoning is usually ascribed to the continuous diffusion of cations in the spinels during the slow cooling of such intrusions (Wilson, Reference Wilson1982; Vogt et al., Reference Vogt, Dohmen and Chakraborty2015). It can be noted, however, that even in the large, slowly-cooled intrusions such as the Great Dyke, there is a considerable degree of intergrain Cr# variation, and Wilson (Reference Wilson1982) notes that the smaller grains tend to be more enriched in Al, as at Kabanga, suggesting that a similar process of magmatic reaction has occurred prior to homogenization of the grains. That the chromites of the Kabanga intrusions have preserved distinct concentric zoning patterns that reflect disequilibrium during growth or cooling is unusual and needs explanation.
Two specific examples of chrome-spinels zoned in trivalent cations in a similar way to those of Kabanga have been described previously. Gradational zoning of Cr# from high values in the core to low values at the margin in chrome-spinels of rapidly cooled glassy MORB lavas has been observed by Roeder et al. (Reference Roeder, Poustovetov and Oskarsson2001) and has been explained as due to local changes of Al3+ and Cr3+ activity due to supercooling of the melt during emplacement, and the diffusion-controlled crystallization of the chrome-spinel from melt. However, the extreme cooling conditions experienced by a submarine-erupted basalt lava cannot be related to those of small intrusions emplaced into enclosing sediments.
Peltonen (Reference Peltonen1995) found that chrome-spinels of the Vammala intrusive belt in Finland were commonly gradationally zoned from Cr-rich cores to Al-rich rims. He demonstrated on textural and compositional grounds that this zoning was an early magmatic feature, caused by incremental growth during evolution of the parent melt due to fractional crystallization and sediment assimilation. He explained the preservation of this zoning as due to the slow diffusion rates of the trivalent cations compared to those of the divalent cations, which stayed in equilibrium with adjacent silicates to relatively low temperatures. The description of the intrusions of the Vammala belt by Peltonen (Reference Peltonen1995) resembles that of small irregular chonoliths, such as those of the Kabanga group of intrusions. It is likely that the small size of these intrusions has contributed to the preservation of tetravalent and trivalent cation zoning patterns in the enclosed chrome-spinels, discussed below.
Late-magmatic to sub-solidus processes at Kabanga
Cumulus minerals, such as olivine, chromite and orthopyroxene have reacted with late residual interstitial magma at Kabanga, leading to decreasing Mg# of all cumulate phases, and increase of certain trace elements (TiO2) in chromite (Maier et al., Reference Maier, Barnes, Sarkar, Ripley, Li and Livesey2010; see also discussion by Barnes et al., Reference Barnes, Mole, Le Vaillant, Campbell, Verrall, Roberts and Evans2016 on the timing of crystallization of orthopyroxene oikocrysts). This reaction between chromite and late evolved interstitial liquid can explain to some degree the wide range of Mg# of chromites at Kabanga. Chromite grains that are now enclosed in late interstitial silicates such as clinopyroxene, plagioclase and phlogopite are enriched in Fe2+ at the expense of Mg (Fig. 4a, b), as well as in Ti (Fig 5a). Chromites enclosed in olivine grains also have low Mg# values due to continuing post-cumulus reaction and subsolidus diffusional re-equilibration, as has been observed at many other intrusions (Roeder et al. Reference Roeder, Campbell and Jamieson1979; Wilson, Reference Wilson1982; Scowen et al., Reference Scowen, Roeder and Helz1991; Barnes and Tang, Reference Barnes and Tang1999).
A particular texture of chromite associated with phlogopite is observed at Kabanga (Figs 2e and 3b). This myrmekitic intergrowth texture between phlogopite and a more Cr-Fe2+ rich, Ti-poor chromite is only observed where late interstitial chromite is in direct contact with interstitial phlogopite. This phlogopite is inferred to represent the locality of final crystallization of the last residual trapped liquid, which would have contained appreciable levels of volatiles and alkalis. The texture may represent the product of a peritectic reaction between the spinel (s.s.) component of the high temperature chrome-spinel and this last liquid, to result in the intergrowth of a Mg-Al-Ti depleted chromite with a Mg-Al-Ti bearing phlogopite. A very similar texture has been observed in chrome-spinels enclosed in glasses of primitive MORB rocks by Roeder et al. (Reference Roeder, Poustovetov and Oskarsson2001), who, in contrast, interpreted them as dendritic growth forms due to diffusion-controlled growth of chrome-spinel in rapidly-cooled lavas. Such a mechanism cannot be applicable in the small intrusions of Kabanga, where the cumulate rocks show only minor evidence of rapid or dendritic growth forms close to the intrusion margins and the myrmekitic chromite texture is only associated with interstitial phlogopite crystallization.
Two observations need further explanation in terms of subsolidus equilibration between chromite and enclosing silicates. Firstly, divalent cation variations are strongly correlated with trivalent cations within individual zoned grains, whereas there is a wide range of Mg# values between chromite grains for a limited range of Cr# (c.f. Figs 4a and 7). Secondly, whereas trivalent cations seem to have preserved high temperature magmatic zoning patterns, the divalent cation contents are in equilibrium with adjacent silicates at low temperatures, as indicated by the extensive diffusion profiles in olivine and orthopyroxene adjacent to chromite and the olivine–spinel geothermometer results (Table 3). These observations can be readily explained by the probable much lower rates of diffusion of the trivalent cations than those of divalent cations (Posner et al., Reference Posner, Ganguly and Hervig2016; Suzuki et al., Reference Suzuki, Yasuda and Ozawa2008; Vogt et al., Reference Vogt, Dohmen and Chakraborty2015). Primary or high-temperature magmatic zoning patterns are preserved in chromite by the Cr and Al, as discussed above, whereas the divalent cations have continued to diffuse within spinel and adjacent silicates to lower blocking temperatures, losing Mg from the spinel and gaining Fe2+ from the silicates. However, the divalent cations are still controlled by the relative Cr and Al levels within the different zones of the chromite due to the well-known control by YCr on the Mg and Fe2+ distribution coefficients described by Irvine (Reference Irvine1965). Thus, absolute levels of Fe2+ and Mg are controlled by the textural position of the chromite grain, which controls the degree of reaction with intercumulus liquid, or of subsolidus re-equilibration with its eventual host mineral, whereas relative levels of Mg and Fe2+ from core to rim within each grain are controlled by the proportions of the trivalent cations of chromite. This can be confirmed by the further observation that the olivine–spinel geothermometer indicates similar apparent equilibrium temperatures for the core and rim compositions of zoned chromite (Table 3).
Cooling and diffusion rates and geothermometry
In the Kabanga intrusions, chromite is affected by both late magmatic reaction with evolved interstitial melt, and/or subsolidus re-equilibration with adjacent minerals. This re-equilibration has continued to relatively low temperatures for the divalent cations, as witnessed by the low blocking temperatures indicated by the olivine–spinel geothermometer (580 to 630°C, Table 3). Diffusion profiles of Mg and Fe2+ in olivine immediately adjacent to chromite are similar in amplitude and length scales to those observed by Wilson (Reference Wilson1982) in the Great Dyke (Fig. 12). Therefore, the thermal regime or cooling rate of the Kabanga intrusions as deduced by the divalent cations would appear to be like that of much larger intrusions. Indeed, many chromites of the larger Block 1 intrusion at Kabanga are without distinct zoning. However, the chromites of the smaller Kabanga Main intrusion do preserve distinct concentric zoning of the trivalent cations Cr and Al and of Ti4+ that is generally not observed in the larger intrusions. In the larger intrusions, the absence of zoning of the chromites, in terms of both trivalent and divalent cations is normally explained by slow interior cooling that allows homogenization of the grains. How can the preservation of early concentric zoning in chromite be compatible with the slow cooling indicated by the divalent ion distributions?
The answer lies in the slower diffusion speeds of trivalent cations compared to those of divalent cations in oxide structures and thus higher blocking temperatures (Posner et al., Reference Posner, Ganguly and Hervig2016; Suzuki et al., Reference Suzuki, Yasuda and Ozawa2008), and in the specific cooling regime of small tube-like chonoliths compared to larger layered intrusions. Jaeger (Reference Jaeger, Hess and Poldevaart1968) has modelled the cooling regimes of several configurations of intrusive body. For those bodies resembling the size and shape of the Kabanga Main intrusions (tube-like and <500 m across) and intruded into cold sediments, initial cooling from magmatic temperatures was rapid, particularly at the margins of the intrusion, but this is followed by a relatively long period of slower cooling throughout the intrusion as the adjacent sediments are heated and metamorphosed. This results in rapid cooling to below the effective blocking temperatures for trivalent and tetravalent cations in spinel (estimated at 800 to 950°C; Posner et al., Reference Posner, Ganguly and Hervig2016), freezing in the early magmatic and immediately post-magmatic disequilibrium textures.
The modelled cooling regime of larger layered intrusions includes a much slower initial cooling rate (Jaeger, Reference Jaeger, Hess and Poldevaart1968; Wilson, Reference Wilson1982), and correspondingly lower closure temperature for Cr in chrome-spinel (between 700°C and 800°C) allowing any early magmatic zoning of trivalent cations in chromite to become homogenized. This may be the case for the very weakly zoned chromites of the larger Block 1 intrusion at Kabanga, and chromites from the Musongati and Kapalagulu layered intrusions, which are unzoned (Evans, Reference Evans2017).
At Kabanga, the mineralized chonoliths may have also witnessed a prolonged period of continuous or episodic flow-through of fresh magma pulses, as proposed by Maier et al (Reference Maier, Barnes, Sarkar, Ripley, Li and Livesey2010), which would have held earlier-formed cumulate rocks at high enough temperatures (500 to 600°C) to allow equilibration of divalent cations between chromite and adjacent silicates while evidently not disturbing the early-formed Cr-Al zoning of chromites. A similar process may have operated in many other mineralized chonoliths, as has already been suggested by Barnes and Kunilov (Reference Barnes and Kunilov2000) for the Noril'sk 1 and Talnakh intrusions in Russia (although no relict zoning of chromite was noted here). The Vammala belt intrusions, which resemble chonoliths in shape and size, also show anomalously low olivine–chrome-spinel equilibration temperatures (Peltonen, Reference Peltonen1995) and yet have preserved primary Cr# zoning in chromite. A possible explanation for the absence of chromite zoning at the Noril'sk and Talnakh intrusions could be that they experienced a very large volume of magma flow-through within these chonoliths compared to less well-mineralized chonoliths like Kabanga and Vammala such that the early-formed cumulates experienced a much longer period at temperatures above the blocking temperature of the trivalent cations. The flow-through thermal regime being such that any early-formed compositional zoning of chromite would have been eliminated by the grains being held at high temperature for long enough for diffusion to completely homogenize the grains, just as in large layered intrusions.
It would be interesting to compare the zoning structure and olivine–chrome-spinel equilibration temperatures of several other chonolith-hosted Ni-Cu sulfide deposits, such as that of Nkomati in South Africa and the Eagle and Tamarack deposits in the United States, to generalize the systematic relationships between intrusion size, flow-through rate, cooling rate and chromite zoning patterns that are indicated in this study.
Barkov et al. (Reference Barkov, Nixon, Levson, Martin and Fleet2013) have reported large numbers of chrome-spinels zoned in a similar manner to those at Kabanga and Vammala, found in heavy mineral concentrates of central British Columbia. The observations here on cooling rates, intrusion size and zoning patterns may be used as an indirect targeting criterion when using such a sampling medium for regional grassroots exploration for Ni-Cu sulfides.
Conclusion
Gradational compositional zoning is observed in chromites of the small intrusions at Kabanga. This zoning can be demonstrated on textural grounds to be developed at the magmatic stage, before later metamorphism. The common normal sense of zoning, from a Cr-rich core to a more Al-rich rim, indicates that it is related to depletion of the melt in Cr by fractional crystallization, or to enrichment of the residual melt in Al by sediment assimilation processes. The smoothly gradational nature of the zoning indicates its modification by diffusional processes, either during crystallization of the rock by reaction with remaining evolved melt, or by re-equilibration with adjacent silicates at the sub-solidus cooling stage. Divalent cations Mg and Fe2+ have continued to re-equilibrate by interdiffusion with adjacent ferromagnesian silicates to low subsolidus temperatures but are still controlled on a grain-scale by the existing trivalent cation distributions. This zoning is characteristic for intrusive bodies that undergo rapid early cooling due to their small size, and then much slower later cooling due to continued flow-through of magma pulses in the body or due to anomalous heating of the crust. Such zoning is rarely described from cumulate rocks of slowly-cooled large intrusions but may be common in small mafic-ultramafic intrusions such as dyke-like or tube-like chonoliths. Such small bodies are commonly associated with nickel sulfide mineralization, thus the presence of zoned chromites found in regional heavy-mineral indicator surveys may be a pointer to mineralization. The presence of diffusional zoning in chromites from Kabanga that can be related to early magmatic and immediately post-magmatic processes is a testament to the preservation potential within rigid, anhydrous blocks within deformed, metamorphosed mafic-ultramafic intrusions, and the importance of finding and sampling these blocks for the elucidation of early magmatic processes.
Acknowledgements
I am indebted to Mr John Spratt of the Imaging and Analysis team of the Natural History Museum, London, who set up the instrumentation and calibrations on the Cameca SX50 and SX100 electron microprobes and guided me in their day to day use for this study. I also acknowledge the preparation of high quality polished thin sections by Tony Wighton of the same team at the NHM. I am indebted to the two reviewers, Prof. Grant Cawthorn and Dr. Stephen Barnes for their pertinent comments and suggestions for improvements to the original manuscript. The management of Kabanga Nickel Company Limited (Tanzania) is thanked for allowing the publication of data obtained from samples of their drill cores.
Supplementary material
To view supplementary material for this article, please visit https://doi.org/10.1180/mgm.2018.87