


Introduction
Glacier mass balance is an important climate-related variable for monitoring impacts of climate change (Reference HoughtonHoughton and others, 2001). In order to assess the climatological effect manifested as the glacier mass balance, the relationship between the climatological forcing and the measured parameters must be established.
Glacier mass balance at mid- to high latitudes typically consists of the two measurable parameters, winter and summer balance. Subtracting the ablation from accumulation yields the net balance and hence the total mass loss or gain that has occurred on the glacier during a ‘glaciological’ year. Measurements of these parameters are made by surveying the total mass added at the end of the accumulation season and total mass lost at the end of the ablation season (e.g. according to standard methods described in Reference Østrem and BrugmanØstrem and Brugman, 1991; Reference Kaser, Fountain and JanssonKaser and others, 2003).
The coupling between climate and summer balance has been investigated in much detail. Summer balance is strongly coupled to air temperature and radiation balance at the glacier surface (e.g. Reference OerlemansOerlemans, 2001; Reference OhmuraOhmura, 2001) and hence can be accurately modeled. Winter balance is more difficult to model since it contains a precipitation signal that may partially be a function of temperature (moisture-holding capacity of air) and partially a function of wind conditions (wind-drifting), local topography (lee effects and avalanching) and storm intensity and frequency. Several studies that have tried to correlate the winter balance on Scandinavian glaciers with atmospheric circulation yield only weak correlations (e.g. North Atlantic Oscillation (NAO) and the Arctic Oscillation (AO) on Scandinavian glaciers) (Reference Pohjola and RogersPohjola and Rogers, 1997; Reference Nesje, Lie and DahlNesje and others, 2000; Reference Jansson and LinderholmJansson and Linderholm, 2005), although newer studies (Reference Nordli, Lie, Nesje and BenestadNordli and others, 2005; Reference Linderholm and JanssonLinderholm and Jansson, 2007; Reference Linderholm, Jansson and ChenLinderholm and others, 2007) using regional, rather than large-scale, proxies for atmospheric circulation effects show more promising results. We believe the weak correlations result because the events that produce snow, mainly frontal passages, occur during brief winter periods (one to a few days) but the correlation calculations must be for averages over either whole months or an entire winter season, thereby ‘diluting’ the signal with longer periods of time without significant events.
In order to improve winter balance models, we must understand under what atmospheric conditions most accumulation occurs. It is therefore important to investigate what weather situations provide most of the accumulation and find ways to quantify these conditions so that they can be used to predict future changes (e.g. under forcing from global climate models running climate-change scenarios).
We have investigated the coupling between the accumulation on Storglaciären, Sweden, and the atmospheric circulation by high-resolution stratigraphic sampling of the cold snowpack at the end of winter. Since we know from environmental studies (e.g. Reference Berg, Røyset, Steinnes and VadsetBerg and others, 1995) that point sources, mainly heavy industries, exist for heavy metals and that sea salts reach the Swedish interior from the North Atlantic to varying degrees, we hypothesized that different snow accumulation events would be ‘tagged’ with different chemical signatures depending on their origin and direction of transport. Our results show that several signatures can be identified in the snow but that their correlation to a specific atmospheric circulation pattern or source region, or both, is difficult to assess due to lack of knowledge of the timing of snow deposition on the glacier. The method can clearly yield the desired results if snow accumulation events can be registered precisely in time, and may then provide a useful method for quantifying the relevant atmospheric circulation for glacier mass balance.
Field Area
Storglaciären is a 3.1 km2 valley glacier in northern Sweden. Detailed mass-balance studies have been carried out since the 1945/46 mass-balance year (e.g. Reference Holmlund, Jansson and PetterssonHolmlund and others, 2005). The glacier is located to the east of Kebnekaise (2104ma.s.l.), the highest mountain in northern Scandinavia. The mountain forms a largely north–south-trending ridge with three peaks over or near 2000ma.s.l. The predominant wind direction is westerly, hence the glacier is located in the lee of the mountain ridge. Large quantities of snow accumulate in the uppermost areas of the glacier through avalanching from the east-facing head-walls. The snow distribution is highly variable (Reference Jansson and PetterssonJansson and Pettersson, in press). The glacier receives 5–10m of snow over large areas in the accumulation area, whereas the ablation area sometimes contains patches with no snow but in general has snow depths of 1–2 m. The pattern of high and low snowpack thickness can be attributed to wind eroding and depositing snow on convex and concave areas of the glacier surface, respectively. The very high values of 8–10m found at the head-wall are largely extra contributions from avalanches.
Methods and Results
Snow distribution
Snow distribution was determined between 1 and 18 May 2001, at 266 points; vertical profiles of snow density were established at six points on the glacier (Fig. 1). Reference Jonsell and KlingbjerJonsell (2002) provides a full description of the measurement data and mass-balance calculations. The 2000/01 winter balance, 1.05 mw.e., was significantly smaller than the average for the period 1946–2006, 1.45 ±0.40mw.e. The snow distribution follows a pattern that is largely persistent from year to year (Reference Jansson and PetterssonJansson and Pettersson, in press) (Fig. 1). The pattern visible in Figure 1 is representative for the general accumulation pattern on Storglaciären.
Maps of Storglaciären showing (a) 20m elevation contours and sampling points for snow depth and density and chemistry and (b) snow thickness isopleths for the 2000/01 winter balance. Contour labels are omitted for clarity regarding sample and accumulation pattern.

Snow stratigraphy and sampling
During spring 2001, snow was sampled at two locations on the glacier (sites 10C and 29C in Fig. 1; the numbering scheme refers to the standard 100m increment probing network on Storglaciären). These locations are standard snow-density sampling points for the mass-balance program on Storglaciären. Site 29C is located in an area of high accumulation without influence from avalanching; site 10C is in an area of locally high accumulation rates in the lower part of the ablation area. The sampling was carried out under cold conditions and there was no sign of melting in the snowpack. At site 29C, sampled on 23 and 24 April, the uppermost 0.57m of the snowpack was sampled in a pit. The remaining snowpack down to 3.39 m was sampled from a core obtained with a PICO (Polar Ice Coring Office) hand auger. A total of 126 samples were taken in 0.01, 0.02 or 0.03m increments depending on the thickness of snow horizons. Naturally weak layers, typically causing the core to break and indicating discontinuities in mechanical snow properties, were sampled in small increments, whereas homogeneous parts of the core were sampled in 0.03m increments. Sampled snow was cut directly from the core and placed into airtight clean containers and stored in a freezer for transport to the laboratory. A total of 45 samples were retrieved from a pit excavated at site 10C using similar methods.
Stable isotopes
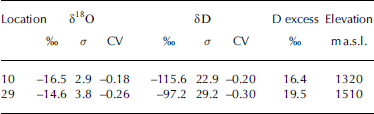
The average δ18O and δD values for sites 10C and 29C are given in Table 1. δ18O values are comparable to values obtained for ice from Storglaciären (Reference Pohjola, Isaksson, Stenberg, Lindén and JanssonPohjola and others, 1994; Reference Glasser, Hambrey, Etienne, Jansson and PetterssonGlasser and others, 2003; Pettersson, unpublished information) and are also within the range in snow samples reported from other valley glaciers (e.g. Reference Stichler, Baker, Oerter and TrimbornStichler and others, 1982; Reference Lemmens, Lorrain and HarenLemmens and others, 1983; Reference Souchez and GrooteSouchez and de Groote, 1985; Reference Raben and TheakstoneRaben and Theakstone, 1998; Reference He, Theakstone, Yao and YangHe and others, 2002). δD values were not reported for the earlier studies. The δ18O/δD values obtained from the snow samples lie parallel to the global meteoric waterline, δD = 8δ18O - 10 (e.g. Reference DansgaardDansgaard, 1964) (Fig. 2).
Average δ18O, δD, and deuterium excess at locations 10 and 29 in 2001. The standard deviation (σ) and coefficient of variation (CV=x/σ) are also given for the averages
δ18O and δD values from sites 10C (crosses) and 29C (circles) compared with the meteoric waterline (δD = 8δ18O - 10; solid line).

The δ18O profiles from sites 10C and 29C are shown in Figure 3. The two isotope profiles (Fig. 3) exhibit similar patterns with possibly contemporaneous low values at 0.75 m (site 10C) and 1.5 m (site 29C) and with regions of high values around 0.25 and 1.0m (site 10C) and 1.1 and 1.75 m (site 29C).
Variations in δ18O and deuterium excess (d = δD - 8δ18O) for sites 10C and 29C. A possible correlation between the sites is indicated by the dotted lines for data at each site connected by a bold line.

We have also calculated the deuterium excess, expressed as d = δD - 8δ18O (Reference DansgaardDansgaard, 1964), for the samples in the cores (Fig. 3). Deuterium excess can be used in conjunction with the δ18O values to help identify the origin of precipitated moisture, or, more specifically in our case, any change in source region.
Cations
Figure 4a and b show the chemical characteristics of the snow profiles at sites 10C and 29C respectively. It is clear in the records from site 29C that several influx ‘events’ occur but with different characteristics. At 2.8–2.9m a series of spikes occur in Al, Fe, Mn, S and Si with very little response in the other cations. Some minor fluctuations occur above this level, but it is only at 1.5 m that another larger spike with higher concentrations of Al, Ca, Fe, K, Mn and Zn occurs. At 1.3 m, a spike occurs in Mn and Zn only. At about 1.1 m, a sharp increase in Ca, K, Mg, Na, S and Sr occurs. This tapers out at about 0.8 m. A wide peak occurs between 0.6 and 0.5m in all elements except perhaps Si. Immediately above this wide peak, there is a narrow (one sample) peak in Al, Ca, K and Zn. A subdued peak also occurs between 0.2 and 0.1 m in Ca, K, Mg, Na, S and Sr. The record from site 10C is less clear because of the relatively coarse sampling (relative to the depth of the snowpack); it may suffice to state that similar patterns are also distinguishable at site 10C.
(a) Concentrations of different cation species (in ppb) at site 10C. (b) Concentrations of different cation species (in ppb) at site 29C. In both plots, the δ18O record from Figure 3 is included for comparison. A possible correlation between the cores is given by the dominant excursion in δ18O marked by the dotted line in both (a) and (b). Horizontal markers in the δ18O parts of the plots indicate the occurrence of weak layers in the snowpack. Note that cation concentrations are given with logarithmic x scale to emphasize large concentration peaks; this subdues smaller-scale signals.

Climatology
We have calculated circulation indices based on Reference Jenkinson and CollisonJenkinson and Collison (1977) and Reference Briffa, von Storch and NavarraBriffa’s (1995) adaptation of Reference LambLamb’s (1950) classification of circulation. In this paper, we present the westerly (zonal, u) and southerly (meridional, v) components of the geostrophic wind p since these components determine the wind speed  and direction. The method of calculation and basic data are described in detail by Reference ChenChen (2000; see fig. 1, p. 1069). The circulation indices were derived from a dataset containing monthly mean sea-level pressure data from the Climate Research Unit (Reference Trenberth and PaolinoTrenberth and Paolino, 1980; Reference Basnett and ParkerBasnett and Parker, 1997) on a 5˚ latitude by 10˚ longitude gridpoint basis for the Northern Hemisphere. Here the circulation indices are calculated for the area 55–70˚ N, 0–30˚ E. In the classification (Fig. 5j), purely directional flow types can be distinguished (north, east, south, west as well as intermediate directions), or rotational fields (C, cyclonic, or A, anticyclonic); intermediate combinations of the two main categories are also possible.
Meteorological and climatological parameters for stations in northern Sweden. (a) Daily average air temperature at Tarfala Research Station, Bodø and Tromsø; (b–f) daily precipitation at stations Bodø (b), Tromsø (c), Kiruna (d),Ålloluokta (e) and Nikkaluokta (f); (g, h), daily meridional (g) and zonal (h) geostrophic wind components; (i) daily average wind speed at Tromsø; and (j) daily calculated (Reference LambLamb, 1950) circulation types, from the bottom: flow in the directions north, northeast, east,. . . , northwest, cyclonic and anticyclonic type (C & A), different types of C & A given by CX and AX, where X denotes directions north, northeast, east,. . . , northwest. Shaded areas indicate distinct precipitation events dominated by either meridional (events 1 and 5) or zonal (events 2, 3, 4 and 6) flow discussed in the text.

We have also gathered daily meteorological data for the period 1 September 2000 to 1 June 2001, from Tarfala Research Station (1km from Storglaciären), the Norwegian coastal cities Bodø and Tromsø (both close to sea level) and the Swedish inland stations in Kiruna, Ålloluokta and Nikkaluokta (all 400–500ma.s.l.). The Swedish stations are all on the eastern side of the Scandinavian mountains. Nikkaluokta is only ~20 km to the east of Tarfala. The meteorological data are also presented in Figure 5. In the figure we have shaded six events that show how meridional (v; events 1 and 5) and zonal (u; events 2, 3, 4 and 6) flow types are associated with different types of precipitation events. These are not the only events during the winter but serve as examples.
Discussion
The δ18O values (Fig. 3) show a distinct pattern that occurs at both sites 10C and 29C. The pattern consists of several distinct peaks of more negative and positive δ18O values. The positive peaks indicate snow layers depleted of the lighter isotope. This can be interpreted as either an indication of evaporation due to extensive exposure of the snow surface to the atmosphere, or a variation in the atmospheric temperature at the time of deposition. If the former is true, the δ18O record shows where snow surfaces occur that have been exposed for longer periods of time to the atmosphere and hence correlate with periods of calm weather and absence of precipitation. When extracting the core at site 29C and sampling the pit at site 10C, no obvious structures were identified that correlate in depth with positive and negative peaks in the oxygen isotope curves. Thus it is uncertain that the intercalated layers of higher δ18O values correspond to periods of accumulation and other calm periods where little or no evaporation or condensation deposition has occurred. Furthermore, the δ18O–δD relationship (Fig. 2) indicates that no significant fractionation beyond that which occurs due to temperature and elevation has occurred. If the δ18O curve reflects depositional temperatures, there should be a rough resemblance between the δ18O curve and the temperature curve as was suggested by Reference He and TheakstoneHe and Theakstone (1994). It is important to realize that since snowfall is not constant, the δ18O curve shows a curve consisting of merged sequences of snowfall and shorter or longer hiatuses. In contrast to Reference He and TheakstoneHe and Theakstone (1994), we find no obvious way to correlate the two curves.
The cation data (Fig. 4) show that several species are cross-correlated at site 29C. The appearance of trace elements in the snow may indicate long-distance transport. Reference Berg, Røyset, Steinnes and VadsetBerg and others (1995, Reference Berg2003) have shown that several heavy metal species identified in mosses in Norway are closely connected to point polluting sources. Of the sources singled out in Berg and others (1995), Mosjøen and Mo i Rana in central Norway and Kirkenes and Russian smelters in northernmost Scandinavia and the Kola Peninsula (see Reference Berg, Røyset, Steinnes and VadsetBerg and others, 1995, fig. 2, p. 70 for locations) are likely sources for Fe, Cr, Al, Ni, Cu, Co and As. Although point sources exist in Sweden (e.g. Reference Kindbom, Svensson, Sjöberg and Pihl KarlssonKindbom and others, 2001) for these elements, they are located further south and not upwind in any dominant wind direction. On the basis of the low trace-metal concentrations found in northern Sweden, we assume that the southern Swedish sources are less important and hence we focus mainly on these known strong sources for our continued discussion.
At 1.5m a small peak occurs in Al, Fe, Mn and Zn. Following the mapping by Reference Berg, Røyset, Steinnes and VadsetBerg and others (1995, Reference Berg2003), this peak indicates pollution probably from either the Mo i Rana area or the Russian smelters to the northeast. At ~1m, a broad peak occurs which starts abruptly with high values in Ca, K, Mg, Na, S and Sr; the peak tapers upwards in the snowpack. These species are all typical for marine sources. The tapering could be the result of either a change in distance to the moisture source (e.g. due to shifts in wind direction) or a decrease in the strength of the circulation, and hence in the possibility of long-distance transport of elements, during the snowfall. The species found in the small peak at 1.5 m are also completely missing at 1 m, indicating a very different source for the snow. At ~0.5 m, a broad peak occurs in elements Ca, Fe, Mg, Mn, Na, S, Sr, Zn and possibly K. This seems to be a combination in composition of the two earlier peaks. The strong signal indicating a marine source is combined with some of the heavy metal species. Since the two sources for metals are located in diametrically opposite locations from Storglaciären, this peak may indicate that snow is coming from the southwest, bringing pollutants from the Mo i Rana area. If that is true, then the peak at 1.5 m may consist of pollutants from the northeast. The uppermost peak in the snowpack consists of quite high concentrations in Al and Fe but not in any other species. The lack of other heavy metals makes the smelters less likely as sources. However, Al seems to appear as spurious peaks throughout the snowpack. Al- and Fe-based stakes are widely used to measure the mass balance on the glacier. It is thus possible that local contamination may be responsible. Around 2.8 m, a series of peaks of higher concentrations of Al, Fe, Mn, S and Si occur. There are also faint traces of elevated concentrations of Ca, K and Zn. This assemblage does not fit any of the signatures discussed above. In fact Si shows the only high concentrations in this part of the record. The different peaks thus have different chemical signatures that may allow us to trace back their origin to either point source polluters or a natural oceanic origin, or some combination of both.
The pattern of variability at site 29C is reflected in the results from site 10C, although not in great detail since each sample represents a larger fraction of the total snow depth at site 10C due to thinner total snow depth (1.74m at site 10C, 3.35m at site 29C). A possible correlation, based on the strong negative excursion in δ18O value, is indicated in Figure 4 by the dotted line at ~0.8m in the site 10C data and at ~1.45m in the site 29C data; this corresponds to 45% and 43% of total snow thickness at the two sites, respectively. This should not be taken to indicate that accumulation is assumed linearly correlated between the sites; we do not have data to confirm this. Correlating the different chemical species between cores is difficult since the relatively coarse sampling at site 10C may average out sharp peaks that can be seen in the site 29C records. The results still indicate that similar vertical distributions of snow composition can be found at both sites.
The precipitation data show that stations on either side of the mountain chain have a common signal but that precipitation-shadow effects from the mountains are present. This is particularly evident during events 1 and 3 (Fig. 5) but also observable in the other larger events. During event 1, u is negative while v is positive, whereas for event 3 the opposite occurs. This shows that strong precipitation events occur on the Norwegian side when the zonal flow is westerly and the meridional flow component is northerly and that strong events on the Swedish side occur when the zonal flow is easterly and the meridional southerly. Our data do not allow us to conclude whether precipitation from both sides of the Scandinavian mountain chain reaches the glacier, so accumulation consists of a combination of the western and eastern records in Figure 5.
Reference Jansson and PetterssonJansson and Pettersson (in press) show that the total winter balance values correlate with point values across the glacier, although some areas have zero or even negative near-zero correlations; site 10C is located at a site with good correlations (R 2 = 0.55), and correlations at site 29C are very high (R 2 = 0.88). Reference Jansson and PetterssonJansson and Pettersson (in press) also show that the area where site 10C is located is associated with an area of locally high accumulation surrounded by areas with low values, inferred to be the result of significant wind redistribution of snow. Site 10C thus receives snow eroded from surrounding areas. Site 29C is located in an area with a higher accumulation rate and little or no sign of wind erosion during the winter season; some redistribution occurs on all parts of the glacier. Because of the different conditions met at the two sites, the high degree of similarity in both stable isotopes and cations indicates that redistribution mainly affects the newly fallen snow at each redistribution event, and that mixing with older snow (with different composition) may be small.
A complication to our inferences is the occurrence of dry deposition of trace metals (e.g. Reference Davidson, Oeschger and LangwayDavidson, 1989). Narrow spikes common to the records may indicate that dry deposition has occurred on a snow surface exposed to the atmosphere for a longer period, and could thus be considered marker horizons if they can be traced between sampling locations. Because the rate of dry deposition in the area is poorly known and because there is no correspondence between the occurrence of narrow peaks and observed structures in the snowpack, we are unable to assess if significant dry deposition can explain the occurrence of narrow peaks. Furthermore, because precipitation is not monitored at the Tarfala Research Station in the unmanned winter period, it is difficult to assess to what extent the different precipitation signals of the Norwegian coast and the Swedish inland describe conditions in Tarfala and on Storglaciären. Because of the location of the glacier and the mountain massif, it seems likely that strong zonal flow will produce significant precipitation on the glacier. Experience has also shown that strong southerly meridional flow can generate large quantities of precipitation and it is hence possible that Storglaciären receives precipitation events from both regimes.
We have so far focused on the peaks in concentration of trace elements of the snow, but the striking feature of the chemistry profiles is actually the relative lack of significant structure in most of the snowpack; however, this should not be taken to indicate absence of variability in these parts of the core. It is possible that this indicates that significant mixing has occurred, but, judging from the size of the broad peak at ~1m, there must otherwise be significant snowfall with low trace-element content. The strength of the winds carrying precipitation from the trace-element sources may also be a factor; stronger winds will bring more salts and particulates to the glacier. If this is the case, then peaks may indicate the occurrence of stronger storms. Using the relationship between u, v and V, several periods with high wind speeds can be identified: first a short period around 1 November (1 in Fig. 5) with very high wind speeds, and a longer period in mid-January (3 in Fig. 5). Event 1 can possibly correlate with the ~2.7m level at site 29C. It is less obvious whether there is a correlative event 3 in 29C. The ~1m level seems too close to the surface for a January snow surface since Storglaciären typically receives much snow in late winter and spring; however, we have no record of local conditions during the 2001 spring.
In summary, our study shows that the snowpack on Storglaciären contains trace elements with varied composition. It seems possible to trace some of the composition signatures to individual sources; however, difficulties in dating the snow containing a specific chemical signature and hence correctly tying a snow layer to the proper atmospheric circulation event make such connections speculative. Timing and rate of accumulation measurements are obviously key to solving the puzzle. Adding an automatic weather station at the sampling site to any future study should greatly improve the possibility of resolving the issue; however, such a station must be placed in a location where 4–6m of snow accumulates in winter, and the station may run the risk of being buried by snow between visits. Without such additional information, chemical variations in the entire snowpack on Storglaciären cannot be traced to their origins with any certainty in a study of this kind. The chemical composition in combination with atmospheric climatology and a record of timing of deposition, on the other hand, shows large potential for studying, for example, temporal and spatial variability in deposition of long-transport pollutants.
Conclusions
Cation concentration and stable-isotope profiles were extracted from the winter snowpack at two locations on Storglaciären to assess the possibility of coupling accumulation events to atmospheric circulation patterns. Although much detail is recorded, contemporaneity with recorded meteorology and calculated circulation proxies cannot be established without knowing the timing of specific accumulation events. This means that, in general, the snowpack alone cannot provide an unambiguous record of accumulation events and their coupling to the climate. With the addition of temporal information, the combination of snowpack chemistry and atmospheric climatology should yield new insights into the climatological conditions controlling the winter balance of a glacier.
Acknowledgements
This study was entirely funded by generous grants (Nos. 0103, 02-03 and 03-13) from the Göran Gustafssons Stiftelse 2001–03. The very careful reviews by W.H. Theakstone and an anonymous reviewer, as well as additional comments by the scientific editor E. Mosley-Thompson, significantly helped to improve the final paper; however, remaining ambiguities are the responsibility of the authors.



