

Over the years, there has been interest in the link between religion and support for political conservatism in Canada, particularly during the heydays of Reform and Conservative leaders such as Preston Manning, Stockwell Day and Stephen Harper (see, for example, Basen, Reference Basen2013; McDonald, Reference McDonald2011). In the 1990s and early 2000s, those who considered religion to be important in their lives were more likely to vote for the Conservative party, which was attributed in part to their more conservative positions on certain moral issues, such as premarital sex, traditional gender roles, abortion and same-sex marriage (Clarke et al., Reference Clarke, Kornberg, Scotto and Twynman2006; Fournier et al., Reference Fournier, Cutler, Soroka, Stolle and Bélanger2013; Guth and Fraser, Reference Guth and Fraser2001; Gidengil et al., Reference Gidengil, Blais, Everitt, Fournier and Nevitte2012: 37–52; Wilkins-Laflamme, Reference Wilkins-Laflamme2016a). However, in the 2015 federal election, after nearly 10 years of Conservative leadership, Justin Trudeau led his Liberal party to a decisive victory, winning nearly 40 per cent of the popular vote.Footnote 1 One wonders if the political alignment of the religiously committed has changed in Canada. Or has religiosity simply begun to play a smaller role in key issue positions and vote choice in recent years?
In this article, we examine the effect of personal religiosity on Conservative voting in federal elections from 2004 to 2015 by testing opposing liberalization and polarization hypotheses. We give particular attention to how this effect is mediated by individuals’ issue positions on same-sex marriage and women working outside the home to better understand the mutating effects of social conservatism on voter choice over the past five federal elections. These changes over time are especially important to examine in light of not only the Liberal victory in 2015 but also the nationwide legalization of same-sex marriage in 2005 and the growing importance of issues surrounding gender inequality in political and social discourse in the 2010s. We argue that traditional views on these two issues, along with the wider social conservative value orientation they often capture, are not separate effects from religiosity, as they have often been treated in previous empirical models (Blais et al., Reference Blais, Gidengil, Nadeau and Nevitte2002: 110; Gidengil et al., Reference Gidengil, Blais, Everitt, Fournier and Nevitte2012: 193–202; Stephenson, Reference Stephenson, Anderson and Stephenson2010), but rather act as important intervening variables between religiosity and the Conservative vote. They also help explain the continued salience of religiosity on voter choice despite overall religious decline and liberalizing attitudes in Canada.
Religiosity, Issue Positions and Voting
Much of the existing research since the early 2000s on the link between religion and vote choice in Canada has focused on the Liberals’ support among those who identify as Catholic (Bélanger and Eagles, Reference Bélanger and Eagles2006; Blais, Reference Blais2005; Kay and Perrella, Reference Kay, Perrella, Kanji, Bilodeau and Scotto2012; Stephenson, Reference Stephenson, Anderson and Stephenson2010). However, some research suggests that in recent elections, personal religiosity may be a more important predictor of vote choice than affiliation (Wilkins-Laflamme, Reference Wilkins-Laflamme2016a). For example, Catholics who consider religion very important to their lives may think and vote differently than a cultural Catholic for whom everyday religiosity is not salient. Religious Canadians, in general, are more likely to vote for the Conservative party, while those who have no religious affiliation and do not consider religion to be important in their lives have tended to vote for the New Democratic party (NDP) (Gidengil et al., Reference Gidengil, Blais, Everitt, Fournier and Nevitte2012: 37–52; Guth and Fraser, Reference Guth and Fraser2001; Johnston, Reference Johnston, Kanji, Bilodeau and Scotto2012; Wilkins-Laflamme Reference Wilkins-Laflamme2016a). This voting pattern has taken shape in a social and political landscape where church participation has been declining since the 1960s (Blais and Loewen, Reference Blais and Loewen2009; Clarke and Macdonald, Reference Clarke and Macdonald2017; Gidengil et al., Reference Gidengil, Blais, Everitt, Fournier and Nevitte2012: 37–52; Meunier and Wilkins-Laflamme, Reference Meunier and Wilkins-Laflamme2011; Reimer, Reference Reimer2017), attitudes on family and reproductive values have been liberalizing (Anderson and Fetner, Reference Anderson and Fetner2008; Gidengil et al., Reference Gidengil, Blais, Everitt, Fournier and Nevitte2012: 37–52; Matthews, Reference Matthews2005) and religious diversity has been growing, largely due to non-Western immigration (Bibby, Reference Bibby2017; Bramadat and Seljak, Reference Bramadat and Seljak2005). In addition, federal political parties have seen a number of changes—including the creation of the socially conservative, western-Canadian-based Reform party in 1987; its rebranding as the Canadian Alliance party in 2000; and the merger of that party with the Progressive Conservatives in 2003, which formed the current Conservative party of Canada.
Many understand the association between level of religiosity and vote choice as an issue voting effect (Raymond, Reference Raymond2011; Smidt et al., Reference Smidt, Dulk, Froehle, Penning, Monsma and Koopman2010; Van der Brug et al., Reference Van der Brug, Hobolt and de Vreese2009). Those actively involved with a religious group are more likely to be regularly exposed to right-leaning values within their congregations, families and faith-based schools, as well as within their network of friends and acquaintances who are more likely to share their religious identities and beliefs (Adkins et al., Reference Adkins, Layman, Campbell and Green2013; Ang and Petrocik, Reference Ang and Petrocik2012; Harrison and Michelson, Reference Harrison and Michelson2015; Nicolet and Tresch, Reference Nicolet and Tresch2009; O'Neill, Reference O'Neill2001; Putnam and Campbell, Reference Putnam and Campbell2010; Raymond, Reference Raymond2011; Reimer, Reference Reimer2003; Reimer and Wilkinson, Reference Reimer and Wilkinson2015; Smidt et al., Reference Smidt, Dulk, Froehle, Penning, Monsma and Koopman2010; Van der Brug et al., Reference Van der Brug, Hobolt and de Vreese2009). To be clear, however, not all organized religious groups have more conservative teachings and values on issues such as premarital sex, homosexuality, abortion, family life and gender roles. Nevertheless, on average, more do than what can be found in general Canadian popular culture and society. Those with traditional moral views are, in turn, more likely to support (conservative) candidates and parties who are perceived to share their values (Blais et al., Reference Blais, Gidengil, Nadeau and Nevitte2002; Clarke et al., Reference Clarke, Kornberg, Scotto and Twynman2006; Fournier et al., Reference Fournier, Cutler, Soroka, Stolle and Bélanger2013; Gidengil et al., Reference Gidengil, Blais, Everitt, Fournier and Nevitte2012).
Party positions on same-sex marriage and women's work fluctuated to a certain extent in the decade prior to the 2015 election. In 2004, the Liberals did not have a clear stand on same-sex marriage, while the NDP gained votes by coming out with clear support (Dostie-Goulet, Reference Dostie-Goulet2006; Gidengil et al., Reference Gidengil, Blais, Everitt, Fournier and Nevitte2012: 37–52). Even in the 2006 and 2008 elections, the Liberal party remained somewhat divided on same-sex marriage (even though Paul Martin's Liberals introduced the legislation to legalize same-sex marriage in Reference Bramadat and Seljak2005), while the Conservatives were against it and the NDP and Bloc Québécois were for it. Even though Harper Tories reopened the same-sex debate in 2006, by 2010 all major parties were either supportive of it or not willing to revisit its legislation for the time being (Gidengil et al., Reference Gidengil, Blais, Everitt, Fournier and Nevitte2012; Rayside, Reference Rayside, Rayside and Wilcox2011). Although women's participation in the labour force was not as contested between 2004 and 2015, some initiatives of the Conservative party could be viewed as signalling a preference for women to stay home with their children (Rayside, Reference Rayside, Rayside and Wilcox2011). In 2005, Harper's Conservatives announced a decision to provide a “universal child care” payment to parents with children, instead of supporting the Liberals’ intentions for state-funded child care facilities. In addition, Harper introduced income splitting (the “Family Tax Cut”) for parents with children in 2014 (Geddes, Reference Geddes2015).
Although the indirect effect of religiosity on voting conservative through a variety of issue positions has been tested in other liberal democracies such as the US, Germany and Great Britain (see notably Raymond, Reference Raymond2011), it has not been studied to the same extent in Canada. Is the religiosity effect on vote choice in Canada entirely mediated by socially conservative issue positions? How has this effect changed between 2004 and 2015? Did religious Canadians still vote for the Conservative party in 2015, despite the Liberal party's victory, and are moral issues still significant predictors of voting choice? Or is the effect of religiosity weakening due to prevalent religious decline?
Theory and Hypotheses
Two separate theoretical frameworks offer two opposing sets of hypotheses for what is happening to religiosity's effect on voting behaviour in Western democracies in general, including in Canada. The first framework is one of general liberalization. With this framework, we would expect the influence of religion on voting behaviour and moral issues to weaken over time. Large portions of the Canadian population no longer have any regular contact with religious groups. Fewer attend religious services regularly, and growing numbers of people say they have no religion at all (Bibby, Reference Bibby2017; Clarke and Macdonald, Reference Clarke and Macdonald2017). At the same time as many Canadians have moved away from the more traditional and conservative teachings coming from many organized religious groups, attitudes on issues related to gender roles, family values and sexuality have liberalized and moved left since the 1960s (Anderson and Fetner, Reference Anderson and Fetner2008; Gidengil et al., Reference Gidengil, Blais, Everitt, Fournier and Nevitte2012: 37–52; Matthews, Reference Matthews2005). The overall effect of these trends may be that religiosity matters less and less to most Canadians and thus would have a weakening impact on vote choice.
H1.1:
All Canadians, including the highly religious, are liberalizing on such issues as same-sex marriage and gender roles.
H1.2:
The effect size of religiosity on moral attitudes, and of moral attitudes on the conservative vote, is declining over time.
Within this liberalization framework, even the declining proportion of religiously committed would be changing their political alignment and their views on moral issues. For example, Bean and Martinez (Reference Bean and Martinez2014) found that young American evangelicals were softening their stance against same-sex marriage, so it would not be surprising if (younger) Canadian evangelicals are as well (Reimer, Reference Reimer, Rayside and Wilcox2011). These liberalizing trends are seen not only at the individual level but also, in many cases, among religious institutions. Mainline Protestant groups have been liberalizing their social attitudes for decades (Bibby and Reid, Reference Bibby and Reid2016; O'Toole et al., Reference O'Toole, Campbell, Hannigan, Beyer, Simpson and Hewitt1993), and most Christian groups have become increasingly positive toward feminist and egalitarian views (Reimer, Reference Reimer, Beaman and Beyer2008). For example, women have been ordained by the mainline Protestant denominations since before 1975 and in many evangelical Protestant denominations more recently.Footnote 2 Similarly, same-sex marriage is affirmed by the United Church and the Evangelical Lutheran Church in Canada. Groups like the Presbyterian Church in Canada, the Anglican Church of Canada and other groups are currently debating this issue. By contrast, Catholics and some conservative Protestants still do not ordain women and remain opposed to same-sex marriage.
This brings us to the second framework—polarization. Here we would expect the relationship between religion and voting, and between religion and moral issues, to strengthen over time, despite religion now being found among a smaller portion of the population. In this framework, the remaining religiously committed would feel a growing tension with societal norms, which could lead them to harden their positions and/or form alliances with fellow conservatives in order to combat secularizing and liberalizing trends. At the same time as the highly religious retrench, many of the nominally religious (who affiliate with a religious group but with low religiosity and more left-leaning values) would vacate the middle and move to the other end of the spectrum by becoming religious “nones.” These opposing movements would lead to a growing religious/secular polarization in Canada and other Western societies.
H2.1:
As the less religious and nonreligious in society liberalize on issues such as same-sex marriage and gender roles, the actively religious become more conservative on such issues.
H2.2:
The effect size of religiosity on moral attitudes and of moral attitudes on the conservative vote will grow over time, even if these mechanisms are now found among a smaller portion of the population.
The notion of polarization between liberals and conservatives began in the US with proponents of the “culture wars” thesis (Hunter, Reference Hunter1991; see also Wuthnow, Reference Wuthnow1988) but more recently has been extended to touch on the growing divide between religious conservatives and nonreligious liberals in the US and Europe (Putnam and Campbell, Reference Putnam and Campbell2010; Wilkins-Laflamme Reference Wilkins-Laflamme2016b).
Methodology
In order to test these opposing sets of hypotheses and measure the effects of religiosity and moral issue positions on the Conservative vote, we analyzed survey data from the Canadian Election Study (CES) from the years 2004 to 2015. The CES is run each time there is a federal election in Canada. In more recent years, the surveys have taken a three-wave format: a series of questions asked by means of telephone interviews during the election campaign period and just after election day and then through a self-completion mail-back questionnaire (turned online questionnaire in 2011) (Fournier et al., Reference Fournier, Cutler, Soroka and Stolle2017). The cross-sectional probability samples for each of the 2004–2015 CES surveys range from 2,059 respondents (2006) to 9,982 respondents (2015 web and phone combined file), for a total of 21,080 respondents in the cumulative 2004–2015 dataset.Footnote 3 Of these respondents, 15,256 answered all three of the salience of religion, same-sex marriage and gender roles questions used in this study (from a low of 1,949 in 2006 to a high of 6,330 in 2015).
Due to the focus of this study on social conservatism, we limit the main endogenous (outcome) variable to a binary one for voting for the Conservative party, compared with all other federal political parties.Footnote 4 Salience of religion is the main exogenous (predictor) variable for this study, based on the question: “In your life, would you say religion is very important, somewhat important, not very important, or not important at all?” It is the only measure of religious commitment included in all 2004–2015 CES surveys. It also stands to reason that those who consider their religion very important to their lives are the ones who are most likely to have their religiosity shape their voting behaviour and moral views.
This study also focuses on two separate mediator variables associated with social conservatism, based on respondents’ answers to the following questions: “Do you favour or oppose same-sex marriage, or do you have no opinion on this?” and “Society would be better off if fewer women worked outside the home: Do you strongly agree, somewhat agree, somewhat disagree, or strongly disagree?” These are the only two questions capturing socially conservative positions on family, sexual orientation, gender roles and reproductive values included in all 2004–2015 waves of the CES and have been used to form scales of moral traditionalism and social conservatism in previous studies (Blais et al., Reference Blais, Gidengil, Nadeau and Nevitte2002; Gidengil et al., Reference Gidengil, Blais, Everitt, Fournier and Nevitte2012). These two issue positions are kept as distinct variables in our models to measure their specific mediating impacts on the Conservative vote.
The analyses also include a series of sociodemographic controls, in order to better isolate the effect of importance of religion on the endogenous variables. Religious affiliation is included in the models, based on the question “Please tell me what is your religion, if you have one?” We group those denominations and religious traditions provided by respondents into four categories, based on classifications made by previous research in Canada (Bibby, Reference Bibby2017) as well as on what is possible with our sample sizes. These categories include Catholics, mainline Protestants (Anglicans, the United Church, Presbyterians, Lutherans and those who declared they were either Protestant or Christian after further questioning), other Protestants (including Baptists, Jehovah's Witnesses, Mormons, Pentecostals, the Salvation Army, Mennonites and other Protestant groups) and Christian Orthodox and non-Christians (grouped into one category).Footnote 5 Since the salience of religion question was asked only of respondents who declared having a religion, for the purposes of this study we must make the assumption that those respondents who declare having no religion also consider religion not to be at all important in their lives. Other standard sociodemographic controls for these types of analyses, present in all waves of the 2004–2015 CES surveys, include age, gender, level of education, employment status, country of birth and province of residence.Footnote 6
A series of descriptive statistics and generalized structural equation (path) logit models were generated for the purposes of this study. The path models measure the effects of attitudes toward same-sex marriage and gender roles as mediators in the religiosity–Conservative vote relationship, while also controlling for other sociodemographic covariates. These models include indirect pathways for the effects of religiosity on the Conservative vote through attitudes toward same-sex marriage and women working outside the home, as well as a direct effect pathway of religiosity on the Conservative vote, in order to capture any potential remaining association not mediated through the two issue positions (see Figure 4). Since all three endogenous variables in this series of models are categorical variables—with ordinal-level attitudes toward same-sex marriage and women working outside the home, as well as a binary variable for voting Conservative—a logit link function was used (with ordinal and Bernoulli family links).
Previous studies examining the impact of religiosity and social conservatism on vote choice in Canada have only ever included personal religiosity and issue positions as distinct independent variables in regression models (Blais et al., Reference Blais, Gidengil, Nadeau and Nevitte2002: 110; Gidengil et al., Reference Gidengil, Blais, Everitt, Fournier and Nevitte2012: 193–202; Stephenson, Reference Stephenson, Anderson and Stephenson2010). This often masks the crucial role of religiosity in driving social conservatism—and thus indirectly impacting vote choice—in existing empirical models and results. One of the main contributions of our study is to model the same-sex marriage and gender role issue positions as mediator variables between religiosity and vote choice and to see how these direct and indirect effects have changed between 2004 and 2015. This allows us to better capture the conceptual realities of vote choice with our empirical models.
Results and Discussion
To begin, Figure 1 contains the estimated distribution of the voting adult Canadian population by the level of importance respondents assign to religion in their lives. The proportions of those who say religion is very or somewhat important in their lives declined over the 11-year period, from 60 per cent for the two categories in 2004 to 49 per cent in 2015. The decline in religiosity is also evident in the proportional increase in the “no religion/not at all important” category between 2004 and 2015, from 25 per cent to 36 per cent of the total population. This change is especially apparent in 2015 and is most likely linked to the youth vote that turned out in larger numbers (Elections Canada, 2016), who on average have lower levels of religiosity (Blais and Loewen, Reference Blais and Loewen2009; Bibby, Reference Bibby2017; Wilkins-Laflamme, Reference Wilkins-Laflamme2015).
Salience of Religion and Conservative Vote Levels among Respondents Who Voted in the 2004-2015 Federal Elections

Although not as large as it was in 2004, the voting bloc that says religion is very important in their lives is still substantial in 2015, at an estimated 21 per cent of all voting adults in Canada. In 2015, this group of voters was on average older than the rest of the voting population (mean age of 56 years compared with 50 years), contained a higher ratio of women (57 per cent female compared with 48 per cent), had a higher ratio of immigrants (18 per cent born outside of Canada compared with 11 per cent) and had similar rates of university education (43 per cent of voters who say religion is very important in their lives had a university degree in 2015 compared with 41 per cent among the rest of voters).
As for the Conservative vote, the descriptive statistics in Figure 1 show that the estimated proportion of the general population who voted for the federal Conservative party rose steadily after 2004 (29 per cent share of the vote) to reach a peak in 2011 (42 per cent share) and then experienced a sharp decline in 2015 (28 per cent share). The same voting trend is evident among respondents who consider religion to be very important in their lives, although this demographic generally has a stronger Conservative vote: the proportion of this group who voted Conservative reached an estimated high of 55 per cent in 2011 and then declined to 43 per cent in 2015.
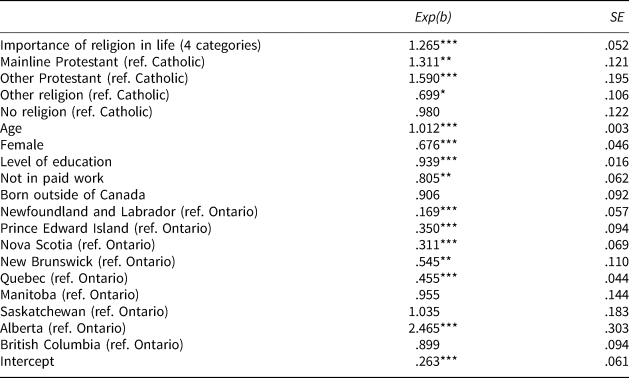
So not only has one of the electoral bases of the Conservative party shrunk in size, with a proportional decline of those who say that religion is very important in their lives, but proportionally fewer of these individuals seem to have voted for the Conservative party in 2015 than in 2011, following trends in the wider adult population. Yet there remains a salience of religion effect on the Conservative vote across the period at study, including in 2015: Table 1 contains this estimated effect in 2015, controlling for other sociodemographic variables at their mean.
Effects on the Conservative Vote in Odds Ratios, Canada, 2015

Source: Canadian Election Study, 2015.
Notes: N = 5,195. Results from logit gsem model with maximum likelihood estimation. †= p ≤ .10; * = p ≤ .05; ** = p ≤ .01; *** = p ≤ .001. McFadden's R2 = .085.
A one-unit increase in salience of religion is associated with 1.27 times greater odds for an average respondent to have voted for the Conservative Party in 2015. In other words, average respondents for whom religion is very important in their lives had a predicted probability of 32 per cent of voting Conservative, compared with 19 per cent among those who do not consider religion at all important in their lives. Salience of religion is one of the stronger effects on the Conservative vote in the model—larger in strength in 2015 than specific religious affiliation, gender, level of education, employment status and country of birth. It is only surpassed in effect strength by age and province of residence. In other words, the trends of older respondents and those living in Alberta being more likely to vote Conservative, and residents of Eastern Canada and Quebec being less likely to vote Conservative, are the only effects in this model that are more pronounced than the positive association between salience of religion and the Conservative vote.
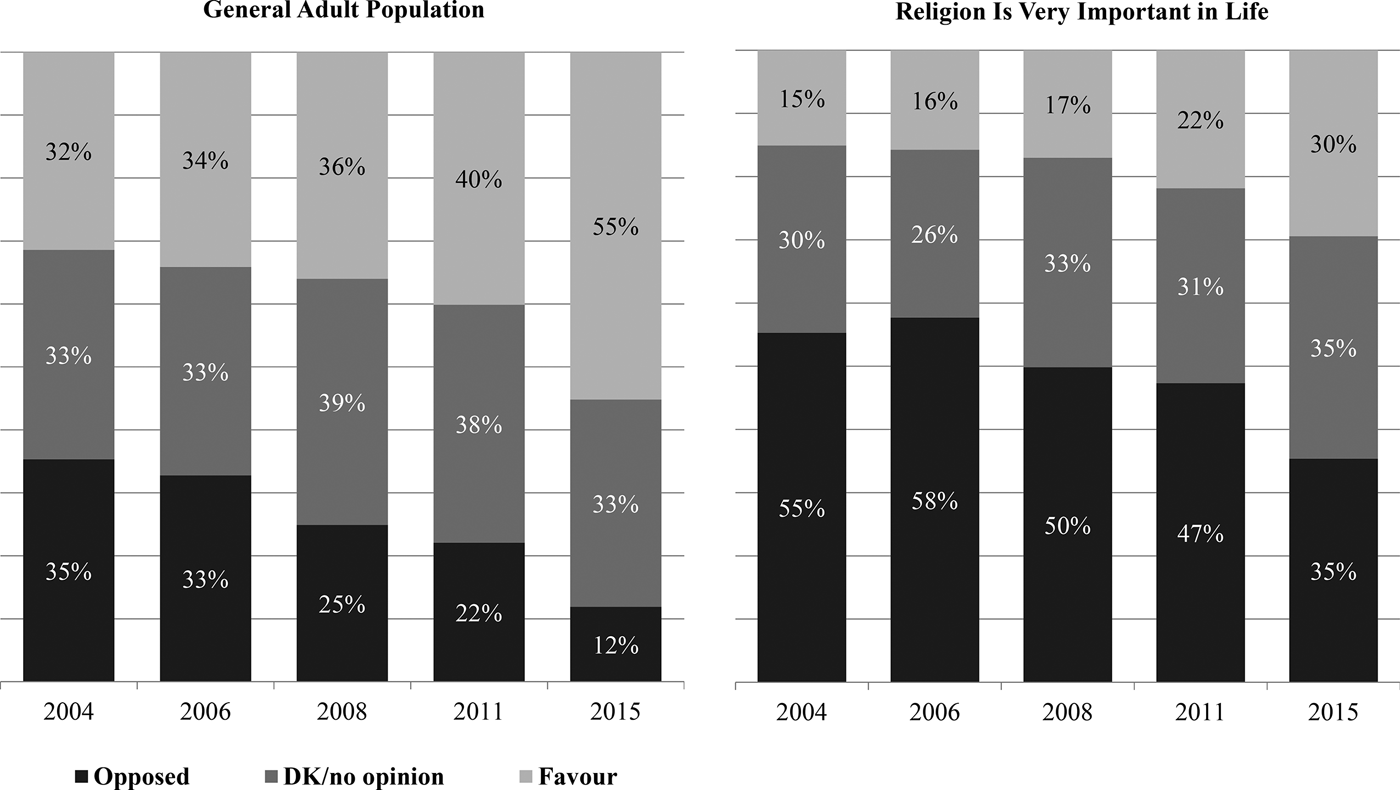
The descriptive statistics in Figures 2 and 3 in turn show that adult Canadians in general have become more left-leaning, on average, between 2004 and 2015 on the issues of same-sex marriage and women in the labour force, in line with findings from Anderson and Fetner (Reference Anderson and Fetner2008) and Gidengil et al. (Reference Gidengil, Blais, Everitt, Fournier and Nevitte2012: 37–52). A greater proportion were in favour of same-sex marriage in 2015 (55 per cent share) than in 2004 (32 per cent share) (see Figure 2), and a greater proportion disagreed or strongly disagreed that society would be better off if women stayed at home in 2015 (79 per cent share) than in 2004 (56 per cent share) (see Figure 3).Footnote 7
Attitudes toward Same-Sex Marriage, 2004-2015

Society Would Be Better Off If Fewer Women Worked outside the Home, 2004-2015

This liberalizing trend is also present on the issues of same-sex marriage and women in the labour force among those respondents who say religion is very important in their lives, although they remain less left-leaning on these issues than the general population: 30 per cent of respondents who say religion is very important in their lives were in favour of same-sex marriage in 2015, compared with only 15 per cent in 2004 (Figure 2); and 67 per cent of this same group disagreed or strongly disagreed with the statement that society would be better off if women stayed in the home in 2015, compared with 42 per cent in 2004 (Figure 3).
These initial results lend support to the liberalization trend described in H1.1 and consequently lead us to reject the alternative polarization hypothesis of H2.1. There does not appear to be a polarization trend at play between the religious and less religious on the issues of same-sex marriage and women in the labour force over the period at study: both the general population and the religious have become more liberal between 2004 and 2015 on these issues, yet with the religious demographic still more right-leaning on average than the general population across all the years at study.
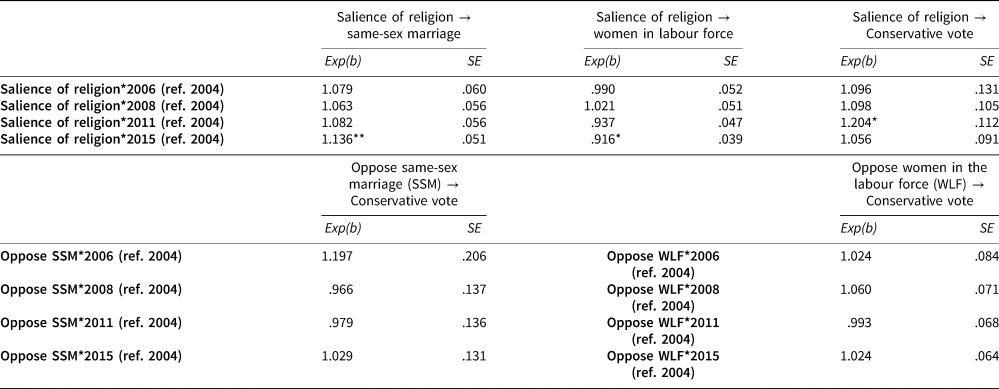
What about H1.2 and H2.2? How has this liberalization trend affected the relationship between religiosity and the Conservative vote in Canada, mediated through issue positions on same-sex marriage and women's participation in the labour force? Figure 4 contains the main results from the generalized structural equation (path) logit model, based on the 2004–2015 pooled CES data; and Table 2 contains the interaction effects between the exogenous variables in the model and survey wave, in order to capture potential differences in effect size across the years at study. In line with previous research (Ang and Petrocik, Reference Ang and Petrocik2012; Blais et al., Reference Blais, Gidengil, Nadeau and Nevitte2002; Gidengil et al., Reference Gidengil, Blais, Everitt, Fournier and Nevitte2012; Reimer, Reference Reimer2003; Reimer and Wilkinson, Reference Reimer and Wilkinson2015) and our descriptive statistics in Figures 2 and 3, we find that salience of religion is associated with higher levels of opposition to same-sex marriage and to women working outside the home even once we control for sociodemographics. In our path model, for a one-unit increase in salience of religion, the odds of opposing same-sex marriage are 1.9 times greater than for favouring it or having no opinion on the issue. A one-unit increase in salience of religion is also associated with 1.4 times greater odds of strongly agreeing that society would be better off if fewer women worked outside the home.
Effects on the Likelihood of Voting Conservative in 2004-2015 (pooled) Canadian Federal Elections, in Odds Ratios (Sociodemographic Controls Included in the Model Not Illustrated Here)

Year Interaction Effects on Likelihood for Voting Conservative, by Canadian Federal Election (2004–2015), in Odds Ratios

Notes: Results from generalized structural equation (path) model. Sociodemographic controls include religious affiliation, age, gender, level of education, employment status, country of birth, province of residence and year of election. Maximum likelihood estimation. N same-sex marriage = 14,623. N women in the labour force = 14,587. N Conservative vote = 10,131. †= p ≤ .10; * = p ≤ .05; ** = p ≤ .01; *** = p ≤ .001.
In turn, holding these more right-leaning issue positions are both associated with significantly greater odds of voting Conservative, also in line with previous research (Blais et al., Reference Blais, Gidengil, Nadeau and Nevitte2002; Clarke et al., Reference Clarke, Kornberg, Scotto and Twynman2006; Fournier et al., Reference Fournier, Cutler, Soroka, Stolle and Bélanger2013; Gidengil et al., Reference Gidengil, Blais, Everitt, Fournier and Nevitte2012): for a one-unit increase in more right-leaning attitudes toward same-sex marriage, the odds of voting Conservative over any other political party are 2 times greater. For a one-unit increase in more right-leaning attitudes toward women in the labour force, the odds of voting Conservative are 1.1 times greater.
An average respondent's position on same-sex marriage is the more important intervening variable in this model, with it being more strongly associated with both religiosity and the Conservative vote. The pathway between salience of religion and attitudes toward same-sex marriage is fairly stable in magnitude over time, with a slight increase in more recent years (the difference in effect size reaches statistical significance in 2015) (see Table 2). In other words, respondents’ attitudes toward same-sex marriage are tied a bit more to their level of religiosity in 2015 than in 2004.Footnote 8 However, the effect size of attitudes toward same-sex marriage on the Conservative vote does not vary significantly across the survey waves. This indicates that these attitudes’ importance in respondents’ vote choice is relatively stable between 2004 and 2015.
The effects on and of attitudes toward women in the labour force are also statistically significant in Figure 4 but weaker than those for same-sex marriage. The pathway between salience of religion and attitudes toward women in the labour force is statistically significant overall but weakens somewhat over time (see Table 2).Footnote 9 In other words, people's attitudes toward women in the labour force seem to be slightly less tied to their level of religiosity in more recent years. As for the pathway between attitudes toward women in the labour force and the Conservative vote, its effect size does not vary significantly over the years at study (see Table 2). This indicates that although proportionately fewer voters held conservative positions on this issue in 2015 (as we saw in Figure 3), for those who still do, this issue is just as important in their vote choice as it was in 2004.
When the indirect pathways of the religiosity effect on the Conservative vote through attitudes toward same-sex marriage and women in the labour force are accounted for, there is no statistically significant direct effect of religiosity on voting Conservative for the overall period of 2004–2015. The interaction term with the 2011 survey year is statistically significant in Table 2, yet when a separate path model is run using only the 2011 data, this direct effect is still not statistically significant overall (see Table A.4 in the online supplementary material for these results). The link between religiosity and the Conservative vote in Canada thus seems to be entirely explained by voters’ positions on the two issues studied here. However, such positions may also be capturing voter attitudes toward other moral issues that could not be measured here, such as respondents’ positions on abortion, on sexual relations before marriage, on traditional family structures and so forth. Many individuals who hold conservative positions on same-sex marriage and gender roles most likely hold more conservative positions on other such issues. Additionally, positions on women in the labour force could also be capturing, in part, a certain kind of conservative job protectionism effect (a perception that more women staying in the home would mean more jobs available for others).
Conclusions
In this article, we have shown that religiosity remains an important predictor of voting behaviour. When its influence on social conservative attitudes has not been modelled in previous studies, its indirect effect on vote choice has often been missed. The importance of this indirect effect of religiosity on the Conservative vote remains present even though Canadians as a whole are becoming less religious and are liberalizing in their attitudes toward same-sex marriage and gender roles. Those who say religion is important in their lives are still considerably more likely to vote Conservative, even in the 2015 election when Trudeau won a Liberal majority. How, then, do we explain the continued salience of religiosity on voting in liberalizing and secularizing Canada?
Polarization as a trend does not seem to explain these findings. Those who claim high religious salience are liberalizing on sexual morals and gender attitudes just like most other Canadians. This supports the liberalization hypothesis of H1.1. Yet the data do not also support H1.2, the hypothesis that the effect of religiosity on conservative voting will decrease over time as society liberalizes. Instead, the data show that the magnitude of religiosity's effect on conservative voting remains important. Why? The reason is that voting Conservative is still important for the declining proportion of highly religious Canadians who hold right-leaning positions on the issues of same-sex marriage and gender roles. In fact, the mediating effects of same-sex marriage and gender roles fully accounted for the effect of religious salience on Conservative voting (as the direct effect was not significant in our models). The more powerful effect, and one that is clearly not declining in importance, is that of same-sex marriage. Even ten years after it was legalized in Canada, the issue still significantly shapes voting choice in 2015 for a number of religious Canadians. Consequently, a liberalization trend in attitudes across populations does not necessarily imply a decline in the strength of the religiosity effect, since differences persist in moral attitudes between the more and less religious in Canada and these differences remain important when it comes time to vote in elections.
While our study focuses on religious salience, the effects of being affiliated to a specific religious tradition are also worth mentioning here. Although salience of religion has a significant effect on voting behaviour in all our models, even when we control for religious tradition, affiliation with the “other Protestant” category (mostly conservative Protestants but other [non-mainline] Protestant groups as well) was also important (see Table A.3 in the online supplementary material). When salience of religion and the other sociodemographics are kept constant, other Protestants are more likely to oppose same-sex marriage (2.7 times greater odds than Catholics) and strongly agree that society would be better off if fewer women worked outside the home (1.4 times greater odds than Catholics). They are also more likely to vote Conservative (1.4 times greater odds than Catholics), even when controlling for their attitudes on the two issue positions. These Protestants’ attraction to the Conservative party is partly about conservative policy positions (Malloy, Reference Malloy2010a) and the evangelical faith of certain political leaders (Malloy, Reference Malloy2010b), but it is also a response to some hostile rhetoric from the Liberal party and NDP (Hutchinson and Hiemstra, Reference Hutchinson and Hiemstra2009).Footnote 10 Yet this group represents only about 10 per cent of Canadians, and there is no evidence that it is growing demographically, even when immigration is considered (Reimer and Wilkinson, Reference Reimer and Wilkinson2015).
Although there have been various efforts to form alliances among religious conservatives to resist the legalization of same-sex marriage in the past (Malloy, Reference Malloy, Rayside and Wilcox2011), these efforts have not resulted in policy change or even in a hardening of attitudes. Instead, the liberal trajectory of society on many issues—which includes the liberalization of the views of many Canadians who say religion is very important to their lives—indicates that socially conservative platform positions may not meet with much success in years to come: those who remain conservative on these issues still support them, but this base appears to be shrinking, especially when the youth vote turns out in greater numbers, as it did in 2015. Conservative platforms may have to shift which issues they focus on, or rethink their levels of social conservatism, to account for this trend. We agree with Malloy (Reference Malloy2010a) that “the important question to ask may not be ‘is Canada developing an American-style religious right?’ but rather ‘How is religion and politics evolving both in Canada and other countries?’”
As with any study, there are limits to our findings, and thus there are many avenues open for future research on the topic of religion and political behaviour in Canada. The data used in this study are cross-sectional in design, and so direction of causality is impossible to prove in the associations found here. Drawing on existing theory, we understand an individual's level of religiosity as directly impacting their attitudes toward certain issues and thus indirectly impacting their vote choice through these issue positions. This said, a feedback loop could also be present: more conservative positions on issues such as same-sex marriage and gender roles, as well as stronger bonds with the Conservative party, may in turn reinforce participation in religious activities where these views may be more accepted and shared with other like-minded individuals. Additionally, this study only focused on two issue positions due to their availability in the data. Future studies could incorporate other issue positions into the analysis of the effect of religion and religiosity on vote choice and other political behaviour: for example, attitudes toward abortion, premarital sex and traditional family structures, as well as toward issues such as the role of government in social life, economic policy and religious freedom.
In conclusion, our contribution is a more detailed examination of the influence of religiosity on voting behaviour. We have updated previous research to show that even in the 2015 federal election that resulted in a Liberal majority, religiosity remained a strong predictor of voting for the Conservative party. In addition, we have demonstrated the importance of moral issues in this relationship. That is, the mediating influence of gender role attitudes, and particularly of attitudes toward same-sex marriage, account for the link between religious salience and Conservative party support. This effect has been significant in the last five federal elections despite declining religiosity and increased liberalization, even though this mechanism is now found among a smaller portion of the population. Overall, grassroots social conservatism, along with a highly religious voting bloc, appears to be shrinking in Canada.
Supplementary material
To view supplementary material for this article, please visit https://doi.org/10.1017/S0008423919000544.